Free Statistics

of Irreproducible Research!

Author's title

Author*Unverified author*
R Software Modulerwasp_multipleregression.wasp
Title produced by softwareMultiple Regression
Date of computationThu, 27 Nov 2008 09:40:28 -0700
Cite this page as followsStatistical Computations at FreeStatistics.org, Office for Research Development and Education, URL https://freestatistics.org/blog/index.php?v=date/2008/Nov/27/t12278040716sgnvwwb49wngkz.htm/, Retrieved Sun, 19 May 2024 12:42:45 +0000
Statistical Computations at FreeStatistics.org, Office for Research Development and Education, URL https://freestatistics.org/blog/index.php?pk=25854, Retrieved Sun, 19 May 2024 12:42:45 +0000
QR Codes:

Original text written by user:
IsPrivate?No (this computation is public)
User-defined keywords
Estimated Impact132
Family? (F = Feedback message, R = changed R code, M = changed R Module, P = changed Parameters, D = changed Data)
-       [Multiple Regression] [s0700274] [2008-11-27 16:40:28] [e8ace8b3d80d7fc51f1760fb13a6fe6b] [Current]
Feedback Forum

Post a new message
Dataseries X:
9987	4881	5107
10022	4899	5123
10068	4923	5145
10101	4940	5161
10131	4956	5175
10143	4959	5184
10170	4972	5198
10192	4983	5209
10214	4994	5220
10239	5007	5233
10263	5018	5245
10310	5042	5268
10355	5068	5288
10396	5087	5309
10446	5112	5334
10511	5144	5367
10585	5182	5402
10667	5224	5443


Summary of computational transaction
Raw Inputview raw input (R code)
Raw Outputview raw output of R engine
Computing time2 seconds
R Server'Gwilym Jenkins' @ 72.249.127.135

\begin{tabular}{lllllllll}
\hline
Summary of computational transaction \tabularnewline
Raw Input & view raw input (R code)  \tabularnewline
Raw Output & view raw output of R engine  \tabularnewline
Computing time & 2 seconds \tabularnewline
R Server & 'Gwilym Jenkins' @ 72.249.127.135 \tabularnewline
\hline
\end{tabular}
%Source: https://freestatistics.org/blog/index.php?pk=25854&T=0

[TABLE]
[ROW][C]Summary of computational transaction[/C][/ROW]
[ROW][C]Raw Input[/C][C]view raw input (R code) [/C][/ROW]
[ROW][C]Raw Output[/C][C]view raw output of R engine [/C][/ROW]
[ROW][C]Computing time[/C][C]2 seconds[/C][/ROW]
[ROW][C]R Server[/C][C]'Gwilym Jenkins' @ 72.249.127.135[/C][/ROW]
[/TABLE]
Source: https://freestatistics.org/blog/index.php?pk=25854&T=0

Globally Unique Identifier (entire table): ba.freestatistics.org/blog/index.php?pk=25854&T=0

As an alternative you can also use a QR Code:  

The GUIDs for individual cells are displayed in the table below:

Summary of computational transaction
Raw Inputview raw input (R code)
Raw Outputview raw output of R engine
Computing time2 seconds
R Server'Gwilym Jenkins' @ 72.249.127.135


Multiple Linear Regression - Estimated Regression Equation
totaal[t] = -3.32509286680485 + 1.01945132482905mannen[t] + 0.981989672484985vrouwen[t] + e[t]

\begin{tabular}{lllllllll}
\hline
Multiple Linear Regression - Estimated Regression Equation \tabularnewline
totaal[t] =  -3.32509286680485 +  1.01945132482905mannen[t] +  0.981989672484985vrouwen[t]  + e[t] \tabularnewline
\hline
\end{tabular}
%Source: https://freestatistics.org/blog/index.php?pk=25854&T=1

[TABLE]
[ROW][C]Multiple Linear Regression - Estimated Regression Equation[/C][/ROW]
[ROW][C]totaal[t] =  -3.32509286680485 +  1.01945132482905mannen[t] +  0.981989672484985vrouwen[t]  + e[t][/C][/ROW]
[/TABLE]
Source: https://freestatistics.org/blog/index.php?pk=25854&T=1

Globally Unique Identifier (entire table): ba.freestatistics.org/blog/index.php?pk=25854&T=1

As an alternative you can also use a QR Code:  

The GUIDs for individual cells are displayed in the table below:

Multiple Linear Regression - Estimated Regression Equation
totaal[t] = -3.32509286680485 + 1.01945132482905mannen[t] + 0.981989672484985vrouwen[t] + e[t]


Multiple Linear Regression - Ordinary Least Squares
VariableParameterS.D.T-STATH0: parameter = 02-tail p-value1-tail p-value
(Intercept)-3.3250928668048514.522954-0.2290.8219970.410998
mannen1.019451324829050.04553922.386100
vrouwen0.9819896724849850.04611921.292500

\begin{tabular}{lllllllll}
\hline
Multiple Linear Regression - Ordinary Least Squares \tabularnewline
Variable & Parameter & S.D. & T-STATH0: parameter = 0 & 2-tail p-value & 1-tail p-value \tabularnewline
(Intercept) & -3.32509286680485 & 14.522954 & -0.229 & 0.821997 & 0.410998 \tabularnewline
mannen & 1.01945132482905 & 0.045539 & 22.3861 & 0 & 0 \tabularnewline
vrouwen & 0.981989672484985 & 0.046119 & 21.2925 & 0 & 0 \tabularnewline
\hline
\end{tabular}
%Source: https://freestatistics.org/blog/index.php?pk=25854&T=2

[TABLE]
[ROW][C]Multiple Linear Regression - Ordinary Least Squares[/C][/ROW]
[ROW][C]Variable[/C][C]Parameter[/C][C]S.D.[/C][C]T-STATH0: parameter = 0[/C][C]2-tail p-value[/C][C]1-tail p-value[/C][/ROW]
[ROW][C](Intercept)[/C][C]-3.32509286680485[/C][C]14.522954[/C][C]-0.229[/C][C]0.821997[/C][C]0.410998[/C][/ROW]
[ROW][C]mannen[/C][C]1.01945132482905[/C][C]0.045539[/C][C]22.3861[/C][C]0[/C][C]0[/C][/ROW]
[ROW][C]vrouwen[/C][C]0.981989672484985[/C][C]0.046119[/C][C]21.2925[/C][C]0[/C][C]0[/C][/ROW]
[/TABLE]
Source: https://freestatistics.org/blog/index.php?pk=25854&T=2

Globally Unique Identifier (entire table): ba.freestatistics.org/blog/index.php?pk=25854&T=2

As an alternative you can also use a QR Code:  

The GUIDs for individual cells are displayed in the table below:

Multiple Linear Regression - Ordinary Least Squares
VariableParameterS.D.T-STATH0: parameter = 02-tail p-value1-tail p-value
(Intercept)-3.3250928668048514.522954-0.2290.8219970.410998
mannen1.019451324829050.04553922.386100
vrouwen0.9819896724849850.04611921.292500


Multiple Linear Regression - Regression Statistics
Multiple R0.999997414989691
R-squared0.999994829986065
Adjusted R-squared0.999994140650874
F-TEST (value)1450665.57252891
F-TEST (DF numerator)2
F-TEST (DF denominator)15
p-value0
Multiple Linear Regression - Residual Statistics
Residual Standard Deviation0.468576139452811
Sum Squared Residuals3.2934539769675

\begin{tabular}{lllllllll}
\hline
Multiple Linear Regression - Regression Statistics \tabularnewline
Multiple R & 0.999997414989691 \tabularnewline
R-squared & 0.999994829986065 \tabularnewline
Adjusted R-squared & 0.999994140650874 \tabularnewline
F-TEST (value) & 1450665.57252891 \tabularnewline
F-TEST (DF numerator) & 2 \tabularnewline
F-TEST (DF denominator) & 15 \tabularnewline
p-value & 0 \tabularnewline
Multiple Linear Regression - Residual Statistics \tabularnewline
Residual Standard Deviation & 0.468576139452811 \tabularnewline
Sum Squared Residuals & 3.2934539769675 \tabularnewline
\hline
\end{tabular}
%Source: https://freestatistics.org/blog/index.php?pk=25854&T=3

[TABLE]
[ROW][C]Multiple Linear Regression - Regression Statistics[/C][/ROW]
[ROW][C]Multiple R[/C][C]0.999997414989691[/C][/ROW]
[ROW][C]R-squared[/C][C]0.999994829986065[/C][/ROW]
[ROW][C]Adjusted R-squared[/C][C]0.999994140650874[/C][/ROW]
[ROW][C]F-TEST (value)[/C][C]1450665.57252891[/C][/ROW]
[ROW][C]F-TEST (DF numerator)[/C][C]2[/C][/ROW]
[ROW][C]F-TEST (DF denominator)[/C][C]15[/C][/ROW]
[ROW][C]p-value[/C][C]0[/C][/ROW]
[ROW][C]Multiple Linear Regression - Residual Statistics[/C][/ROW]
[ROW][C]Residual Standard Deviation[/C][C]0.468576139452811[/C][/ROW]
[ROW][C]Sum Squared Residuals[/C][C]3.2934539769675[/C][/ROW]
[/TABLE]
Source: https://freestatistics.org/blog/index.php?pk=25854&T=3

Globally Unique Identifier (entire table): ba.freestatistics.org/blog/index.php?pk=25854&T=3

As an alternative you can also use a QR Code:  

The GUIDs for individual cells are displayed in the table below:

Multiple Linear Regression - Regression Statistics
Multiple R0.999997414989691
R-squared0.999994829986065
Adjusted R-squared0.999994140650874
F-TEST (value)1450665.57252891
F-TEST (DF numerator)2
F-TEST (DF denominator)15
p-value0
Multiple Linear Regression - Residual Statistics
Residual Standard Deviation0.468576139452811
Sum Squared Residuals3.2934539769675


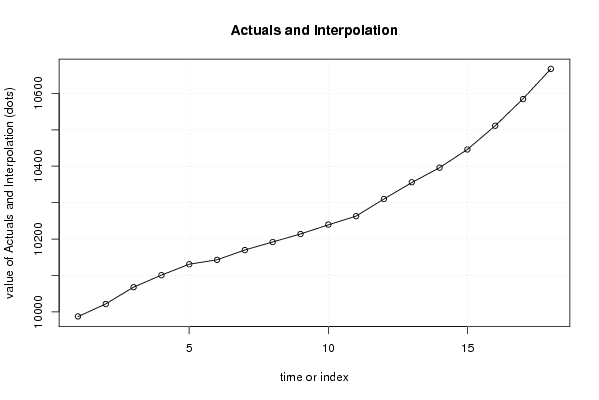
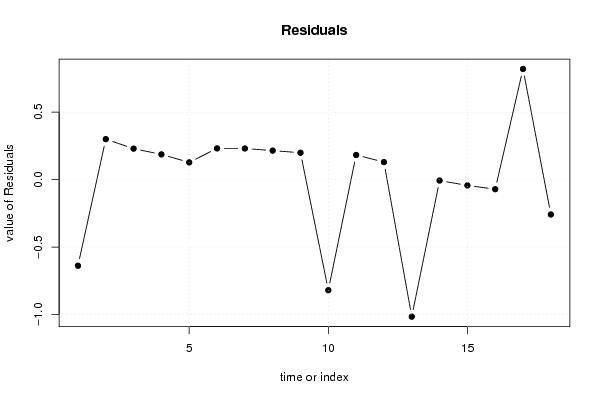
Multiple Linear Regression - Actuals, Interpolation, and Residuals
Time or IndexActualsInterpolationForecastResidualsPrediction Error
199879987.6380810046-0.638081004599039
21002210021.70003961130.299960388715512
31006810067.77064420190.229355798148648
41010110100.81315148370.186848516295068
51013110130.87222809580.127771904240495
61014310142.76848912260.231510877388484
71017010169.76921176020.230788239821042
81019210191.78506273060.214937269366668
91021410213.80091370110.199086298912288
101023910239.8196466662-0.819646666170159
111026310262.81748730910.182512690890476
121031010309.87008157220.129918427838631
131035510356.0156094674-1.01560946741637
141039610396.0069677614-0.00696776135298867
151044610446.0429926942-0.0429926942038176
161051110511.0710942807-0.0710942807379285
171058510584.17988316120.820116838783722
181066710667.2584153759-0.258415375920734

\begin{tabular}{lllllllll}
\hline
Multiple Linear Regression - Actuals, Interpolation, and Residuals \tabularnewline
Time or Index & Actuals & InterpolationForecast & ResidualsPrediction Error \tabularnewline
1 & 9987 & 9987.6380810046 & -0.638081004599039 \tabularnewline
2 & 10022 & 10021.7000396113 & 0.299960388715512 \tabularnewline
3 & 10068 & 10067.7706442019 & 0.229355798148648 \tabularnewline
4 & 10101 & 10100.8131514837 & 0.186848516295068 \tabularnewline
5 & 10131 & 10130.8722280958 & 0.127771904240495 \tabularnewline
6 & 10143 & 10142.7684891226 & 0.231510877388484 \tabularnewline
7 & 10170 & 10169.7692117602 & 0.230788239821042 \tabularnewline
8 & 10192 & 10191.7850627306 & 0.214937269366668 \tabularnewline
9 & 10214 & 10213.8009137011 & 0.199086298912288 \tabularnewline
10 & 10239 & 10239.8196466662 & -0.819646666170159 \tabularnewline
11 & 10263 & 10262.8174873091 & 0.182512690890476 \tabularnewline
12 & 10310 & 10309.8700815722 & 0.129918427838631 \tabularnewline
13 & 10355 & 10356.0156094674 & -1.01560946741637 \tabularnewline
14 & 10396 & 10396.0069677614 & -0.00696776135298867 \tabularnewline
15 & 10446 & 10446.0429926942 & -0.0429926942038176 \tabularnewline
16 & 10511 & 10511.0710942807 & -0.0710942807379285 \tabularnewline
17 & 10585 & 10584.1798831612 & 0.820116838783722 \tabularnewline
18 & 10667 & 10667.2584153759 & -0.258415375920734 \tabularnewline
\hline
\end{tabular}
%Source: https://freestatistics.org/blog/index.php?pk=25854&T=4

[TABLE]
[ROW][C]Multiple Linear Regression - Actuals, Interpolation, and Residuals[/C][/ROW]
[ROW][C]Time or Index[/C][C]Actuals[/C][C]InterpolationForecast[/C][C]ResidualsPrediction Error[/C][/ROW]
[ROW][C]1[/C][C]9987[/C][C]9987.6380810046[/C][C]-0.638081004599039[/C][/ROW]
[ROW][C]2[/C][C]10022[/C][C]10021.7000396113[/C][C]0.299960388715512[/C][/ROW]
[ROW][C]3[/C][C]10068[/C][C]10067.7706442019[/C][C]0.229355798148648[/C][/ROW]
[ROW][C]4[/C][C]10101[/C][C]10100.8131514837[/C][C]0.186848516295068[/C][/ROW]
[ROW][C]5[/C][C]10131[/C][C]10130.8722280958[/C][C]0.127771904240495[/C][/ROW]
[ROW][C]6[/C][C]10143[/C][C]10142.7684891226[/C][C]0.231510877388484[/C][/ROW]
[ROW][C]7[/C][C]10170[/C][C]10169.7692117602[/C][C]0.230788239821042[/C][/ROW]
[ROW][C]8[/C][C]10192[/C][C]10191.7850627306[/C][C]0.214937269366668[/C][/ROW]
[ROW][C]9[/C][C]10214[/C][C]10213.8009137011[/C][C]0.199086298912288[/C][/ROW]
[ROW][C]10[/C][C]10239[/C][C]10239.8196466662[/C][C]-0.819646666170159[/C][/ROW]
[ROW][C]11[/C][C]10263[/C][C]10262.8174873091[/C][C]0.182512690890476[/C][/ROW]
[ROW][C]12[/C][C]10310[/C][C]10309.8700815722[/C][C]0.129918427838631[/C][/ROW]
[ROW][C]13[/C][C]10355[/C][C]10356.0156094674[/C][C]-1.01560946741637[/C][/ROW]
[ROW][C]14[/C][C]10396[/C][C]10396.0069677614[/C][C]-0.00696776135298867[/C][/ROW]
[ROW][C]15[/C][C]10446[/C][C]10446.0429926942[/C][C]-0.0429926942038176[/C][/ROW]
[ROW][C]16[/C][C]10511[/C][C]10511.0710942807[/C][C]-0.0710942807379285[/C][/ROW]
[ROW][C]17[/C][C]10585[/C][C]10584.1798831612[/C][C]0.820116838783722[/C][/ROW]
[ROW][C]18[/C][C]10667[/C][C]10667.2584153759[/C][C]-0.258415375920734[/C][/ROW]
[/TABLE]
Source: https://freestatistics.org/blog/index.php?pk=25854&T=4

Globally Unique Identifier (entire table): ba.freestatistics.org/blog/index.php?pk=25854&T=4

As an alternative you can also use a QR Code:  

The GUIDs for individual cells are displayed in the table below:

Multiple Linear Regression - Actuals, Interpolation, and Residuals
Time or IndexActualsInterpolationForecastResidualsPrediction Error
199879987.6380810046-0.638081004599039
21002210021.70003961130.299960388715512
31006810067.77064420190.229355798148648
41010110100.81315148370.186848516295068
51013110130.87222809580.127771904240495
61014310142.76848912260.231510877388484
71017010169.76921176020.230788239821042
81019210191.78506273060.214937269366668
91021410213.80091370110.199086298912288
101023910239.8196466662-0.819646666170159
111026310262.81748730910.182512690890476
121031010309.87008157220.129918427838631
131035510356.0156094674-1.01560946741637
141039610396.0069677614-0.00696776135298867
151044610446.0429926942-0.0429926942038176
161051110511.0710942807-0.0710942807379285
171058510584.17988316120.820116838783722
181066710667.2584153759-0.258415375920734


Parameters (Session):
par1 = 1 ; par2 = Do not include Seasonal Dummies ; par3 = No Linear Trend ;
Parameters (R input):
par1 = 1 ; par2 = Do not include Seasonal Dummies ; par3 = No Linear Trend ;
R code (references can be found in the software module):
library(lattice)
library(lmtest)
n25 <- 25 #minimum number of obs. for Goldfeld-Quandt test
par1 <- as.numeric(par1)
x <- t(y)
k <- length(x[1,])
n <- length(x[,1])
x1 <- cbind(x[,par1], x[,1:k!=par1])
mycolnames <- c(colnames(x)[par1], colnames(x)[1:k!=par1])
colnames(x1) <- mycolnames #colnames(x)[par1]
x <- x1
if (par3 == 'First Differences'){
x2 <- array(0, dim=c(n-1,k), dimnames=list(1:(n-1), paste('(1-B)',colnames(x),sep='')))
for (i in 1:n-1) {
for (j in 1:k) {
x2[i,j] <- x[i+1,j] - x[i,j]
}
}
x <- x2
}
if (par2 == 'Include Monthly Dummies'){
x2 <- array(0, dim=c(n,11), dimnames=list(1:n, paste('M', seq(1:11), sep ='')))
for (i in 1:11){
x2[seq(i,n,12),i] <- 1
}
x <- cbind(x, x2)
}
if (par2 == 'Include Quarterly Dummies'){
x2 <- array(0, dim=c(n,3), dimnames=list(1:n, paste('Q', seq(1:3), sep ='')))
for (i in 1:3){
x2[seq(i,n,4),i] <- 1
}
x <- cbind(x, x2)
}
k <- length(x[1,])
if (par3 == 'Linear Trend'){
x <- cbind(x, c(1:n))
colnames(x)[k+1] <- 't'
}
x
k <- length(x[1,])
df <- as.data.frame(x)
(mylm <- lm(df))
(mysum <- summary(mylm))
if (n > n25) {
kp3 <- k + 3
nmkm3 <- n - k - 3
gqarr <- array(NA, dim=c(nmkm3-kp3+1,3))
numgqtests <- 0
numsignificant1 <- 0
numsignificant5 <- 0
numsignificant10 <- 0
for (mypoint in kp3:nmkm3) {
j <- 0
numgqtests <- numgqtests + 1
for (myalt in c('greater', 'two.sided', 'less')) {
j <- j + 1
gqarr[mypoint-kp3+1,j] <- gqtest(mylm, point=mypoint, alternative=myalt)$p.value
}
if (gqarr[mypoint-kp3+1,2] < 0.01) numsignificant1 <- numsignificant1 + 1
if (gqarr[mypoint-kp3+1,2] < 0.05) numsignificant5 <- numsignificant5 + 1
if (gqarr[mypoint-kp3+1,2] < 0.10) numsignificant10 <- numsignificant10 + 1
}
gqarr
}
bitmap(file='test0.png')
plot(x[,1], type='l', main='Actuals and Interpolation', ylab='value of Actuals and Interpolation (dots)', xlab='time or index')
points(x[,1]-mysum$resid)
grid()
dev.off()
bitmap(file='test1.png')
plot(mysum$resid, type='b', pch=19, main='Residuals', ylab='value of Residuals', xlab='time or index')
grid()
dev.off()
bitmap(file='test2.png')
hist(mysum$resid, main='Residual Histogram', xlab='values of Residuals')
grid()
dev.off()
bitmap(file='test3.png')
densityplot(~mysum$resid,col='black',main='Residual Density Plot', xlab='values of Residuals')
dev.off()
bitmap(file='test4.png')
qqnorm(mysum$resid, main='Residual Normal Q-Q Plot')
qqline(mysum$resid)
grid()
dev.off()
(myerror <- as.ts(mysum$resid))
bitmap(file='test5.png')
dum <- cbind(lag(myerror,k=1),myerror)
dum
dum1 <- dum[2:length(myerror),]
dum1
z <- as.data.frame(dum1)
z
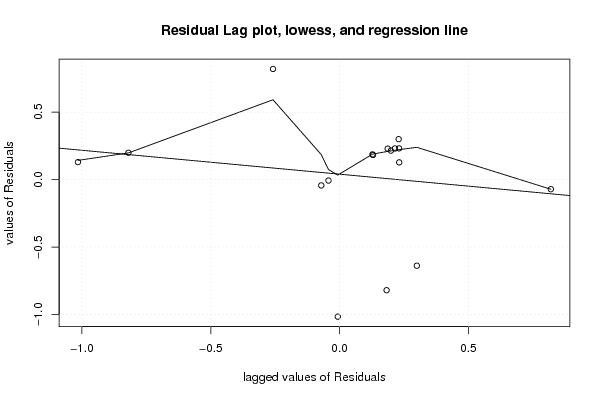
plot(z,main=paste('Residual Lag plot, lowess, and regression line'), ylab='values of Residuals', xlab='lagged values of Residuals')
lines(lowess(z))
abline(lm(z))
grid()
dev.off()
bitmap(file='test6.png')
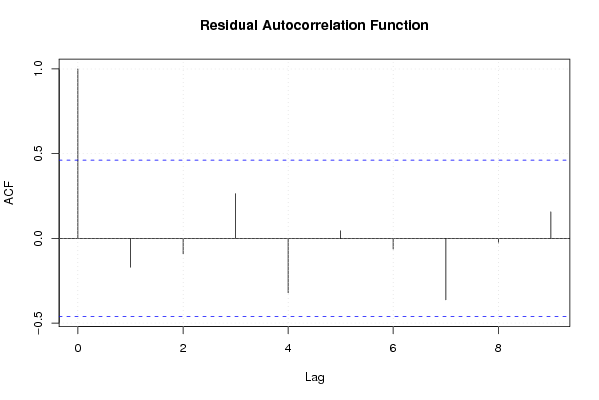
acf(mysum$resid, lag.max=length(mysum$resid)/2, main='Residual Autocorrelation Function')
grid()
dev.off()
bitmap(file='test7.png')
pacf(mysum$resid, lag.max=length(mysum$resid)/2, main='Residual Partial Autocorrelation Function')
grid()
dev.off()
bitmap(file='test8.png')
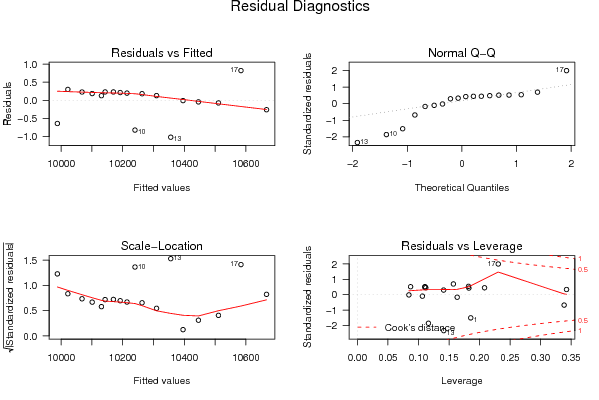
opar <- par(mfrow = c(2,2), oma = c(0, 0, 1.1, 0))
plot(mylm, las = 1, sub='Residual Diagnostics')
par(opar)
dev.off()
if (n > n25) {
bitmap(file='test9.png')
plot(kp3:nmkm3,gqarr[,2], main='Goldfeld-Quandt test',ylab='2-sided p-value',xlab='breakpoint')
grid()
dev.off()
}
load(file='createtable')
a<-table.start()
a<-table.row.start(a)
a<-table.element(a, 'Multiple Linear Regression - Estimated Regression Equation', 1, TRUE)
a<-table.row.end(a)
myeq <- colnames(x)[1]
myeq <- paste(myeq, '[t] = ', sep='')
for (i in 1:k){
if (mysum$coefficients[i,1] > 0) myeq <- paste(myeq, '+', '')
myeq <- paste(myeq, mysum$coefficients[i,1], sep=' ')
if (rownames(mysum$coefficients)[i] != '(Intercept)') {
myeq <- paste(myeq, rownames(mysum$coefficients)[i], sep='')
if (rownames(mysum$coefficients)[i] != 't') myeq <- paste(myeq, '[t]', sep='')
}
}
myeq <- paste(myeq, ' + e[t]')
a<-table.row.start(a)
a<-table.element(a, myeq)
a<-table.row.end(a)
a<-table.end(a)
table.save(a,file='mytable1.tab')
a<-table.start()
a<-table.row.start(a)
a<-table.element(a,hyperlink('ols1.htm','Multiple Linear Regression - Ordinary Least Squares',''), 6, TRUE)
a<-table.row.end(a)
a<-table.row.start(a)
a<-table.element(a,'Variable',header=TRUE)
a<-table.element(a,'Parameter',header=TRUE)
a<-table.element(a,'S.D.',header=TRUE)
a<-table.element(a,'T-STAT
H0: parameter = 0',header=TRUE)
a<-table.element(a,'2-tail p-value',header=TRUE)
a<-table.element(a,'1-tail p-value',header=TRUE)
a<-table.row.end(a)
for (i in 1:k){
a<-table.row.start(a)
a<-table.element(a,rownames(mysum$coefficients)[i],header=TRUE)
a<-table.element(a,mysum$coefficients[i,1])
a<-table.element(a, round(mysum$coefficients[i,2],6))
a<-table.element(a, round(mysum$coefficients[i,3],4))
a<-table.element(a, round(mysum$coefficients[i,4],6))
a<-table.element(a, round(mysum$coefficients[i,4]/2,6))
a<-table.row.end(a)
}
a<-table.end(a)
table.save(a,file='mytable2.tab')
a<-table.start()
a<-table.row.start(a)
a<-table.element(a, 'Multiple Linear Regression - Regression Statistics', 2, TRUE)
a<-table.row.end(a)
a<-table.row.start(a)
a<-table.element(a, 'Multiple R',1,TRUE)
a<-table.element(a, sqrt(mysum$r.squared))
a<-table.row.end(a)
a<-table.row.start(a)
a<-table.element(a, 'R-squared',1,TRUE)
a<-table.element(a, mysum$r.squared)
a<-table.row.end(a)
a<-table.row.start(a)
a<-table.element(a, 'Adjusted R-squared',1,TRUE)
a<-table.element(a, mysum$adj.r.squared)
a<-table.row.end(a)
a<-table.row.start(a)
a<-table.element(a, 'F-TEST (value)',1,TRUE)
a<-table.element(a, mysum$fstatistic[1])
a<-table.row.end(a)
a<-table.row.start(a)
a<-table.element(a, 'F-TEST (DF numerator)',1,TRUE)
a<-table.element(a, mysum$fstatistic[2])
a<-table.row.end(a)
a<-table.row.start(a)
a<-table.element(a, 'F-TEST (DF denominator)',1,TRUE)
a<-table.element(a, mysum$fstatistic[3])
a<-table.row.end(a)
a<-table.row.start(a)
a<-table.element(a, 'p-value',1,TRUE)
a<-table.element(a, 1-pf(mysum$fstatistic[1],mysum$fstatistic[2],mysum$fstatistic[3]))
a<-table.row.end(a)
a<-table.row.start(a)
a<-table.element(a, 'Multiple Linear Regression - Residual Statistics', 2, TRUE)
a<-table.row.end(a)
a<-table.row.start(a)
a<-table.element(a, 'Residual Standard Deviation',1,TRUE)
a<-table.element(a, mysum$sigma)
a<-table.row.end(a)
a<-table.row.start(a)
a<-table.element(a, 'Sum Squared Residuals',1,TRUE)
a<-table.element(a, sum(myerror*myerror))
a<-table.row.end(a)
a<-table.end(a)
table.save(a,file='mytable3.tab')
a<-table.start()
a<-table.row.start(a)
a<-table.element(a, 'Multiple Linear Regression - Actuals, Interpolation, and Residuals', 4, TRUE)
a<-table.row.end(a)
a<-table.row.start(a)
a<-table.element(a, 'Time or Index', 1, TRUE)
a<-table.element(a, 'Actuals', 1, TRUE)
a<-table.element(a, 'Interpolation
Forecast', 1, TRUE)
a<-table.element(a, 'Residuals
Prediction Error', 1, TRUE)
a<-table.row.end(a)
for (i in 1:n) {
a<-table.row.start(a)
a<-table.element(a,i, 1, TRUE)
a<-table.element(a,x[i])
a<-table.element(a,x[i]-mysum$resid[i])
a<-table.element(a,mysum$resid[i])
a<-table.row.end(a)
}
a<-table.end(a)
table.save(a,file='mytable4.tab')
if (n > n25) {
a<-table.start()
a<-table.row.start(a)
a<-table.element(a,'Goldfeld-Quandt test for Heteroskedasticity',4,TRUE)
a<-table.row.end(a)
a<-table.row.start(a)
a<-table.element(a,'p-values',header=TRUE)
a<-table.element(a,'Alternative Hypothesis',3,header=TRUE)
a<-table.row.end(a)
a<-table.row.start(a)
a<-table.element(a,'breakpoint index',header=TRUE)
a<-table.element(a,'greater',header=TRUE)
a<-table.element(a,'2-sided',header=TRUE)
a<-table.element(a,'less',header=TRUE)
a<-table.row.end(a)
for (mypoint in kp3:nmkm3) {
a<-table.row.start(a)
a<-table.element(a,mypoint,header=TRUE)
a<-table.element(a,gqarr[mypoint-kp3+1,1])
a<-table.element(a,gqarr[mypoint-kp3+1,2])
a<-table.element(a,gqarr[mypoint-kp3+1,3])
a<-table.row.end(a)
}
a<-table.end(a)
table.save(a,file='mytable5.tab')
a<-table.start()
a<-table.row.start(a)
a<-table.element(a,'Meta Analysis of Goldfeld-Quandt test for Heteroskedasticity',4,TRUE)
a<-table.row.end(a)
a<-table.row.start(a)
a<-table.element(a,'Description',header=TRUE)
a<-table.element(a,'# significant tests',header=TRUE)
a<-table.element(a,'% significant tests',header=TRUE)
a<-table.element(a,'OK/NOK',header=TRUE)
a<-table.row.end(a)
a<-table.row.start(a)
a<-table.element(a,'1% type I error level',header=TRUE)
a<-table.element(a,numsignificant1)
a<-table.element(a,numsignificant1/numgqtests)
if (numsignificant1/numgqtests < 0.01) dum <- 'OK' else dum <- 'NOK'
a<-table.element(a,dum)
a<-table.row.end(a)
a<-table.row.start(a)
a<-table.element(a,'5% type I error level',header=TRUE)
a<-table.element(a,numsignificant5)
a<-table.element(a,numsignificant5/numgqtests)
if (numsignificant5/numgqtests < 0.05) dum <- 'OK' else dum <- 'NOK'
a<-table.element(a,dum)
a<-table.row.end(a)
a<-table.row.start(a)
a<-table.element(a,'10% type I error level',header=TRUE)
a<-table.element(a,numsignificant10)
a<-table.element(a,numsignificant10/numgqtests)
if (numsignificant10/numgqtests < 0.1) dum <- 'OK' else dum <- 'NOK'
a<-table.element(a,dum)
a<-table.row.end(a)
a<-table.end(a)
table.save(a,file='mytable6.tab')
}