Free Statistics

of Irreproducible Research!

Author's title

Author*The author of this computation has been verified*
R Software Modulerwasp_multipleregression.wasp
Title produced by softwareMultiple Regression
Date of computationThu, 27 Nov 2008 08:47:24 -0700
Cite this page as followsStatistical Computations at FreeStatistics.org, Office for Research Development and Education, URL https://freestatistics.org/blog/index.php?v=date/2008/Nov/27/t12278011858nz9qs322j7ym0r.htm/, Retrieved Sun, 19 May 2024 11:30:08 +0000
Statistical Computations at FreeStatistics.org, Office for Research Development and Education, URL https://freestatistics.org/blog/index.php?pk=25846, Retrieved Sun, 19 May 2024 11:30:08 +0000
QR Codes:

Original text written by user:
IsPrivate?No (this computation is public)
User-defined keywords
Estimated Impact133
Family? (F = Feedback message, R = changed R code, M = changed R Module, P = changed Parameters, D = changed Data)
F     [Multiple Regression] [] [2007-11-19 19:55:31] [b731da8b544846036771bbf9bf2f34ce]
F    D    [Multiple Regression] [Seatbelt law Q3] [2008-11-27 15:47:24] [c4248bbb85fa4e400deddbf50234dcae] [Current]
Feedback Forum
2008-11-29 16:02:05 [Natalie De Wilde] [reply
Goed.
De T-STAT duidt op 5% kans vergissing als de absolute waarde groter is dan 2.
Je hebt bij de berekening geen lineaire trend gebruikt.
Je hebt wel goed alle grafieken besproken.
2008-11-29 16:09:43 [Natalie De Wilde] [reply
Het was niet nodig om de berekeningen zonder monthly dummies en linear trend te doen. De opdracht vroeg slechts om de derde output die je geproduceerd hebt.

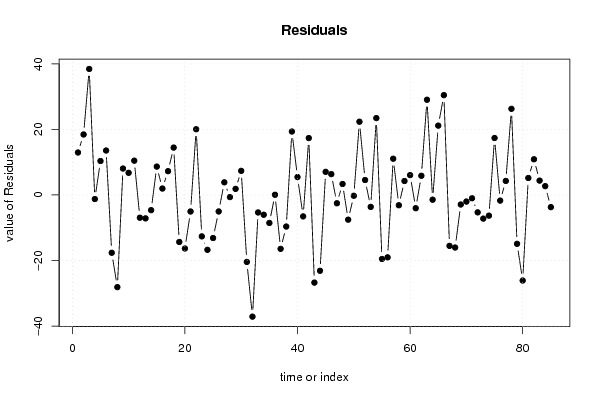
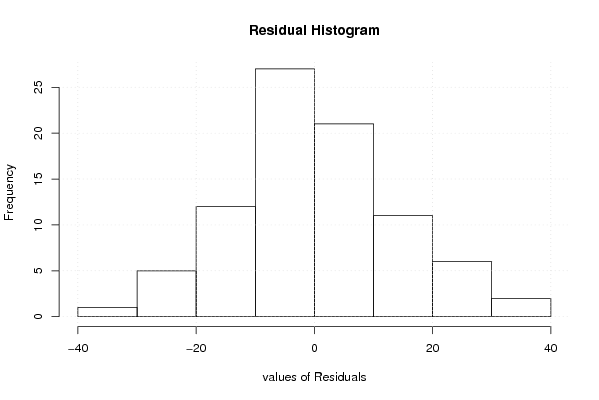
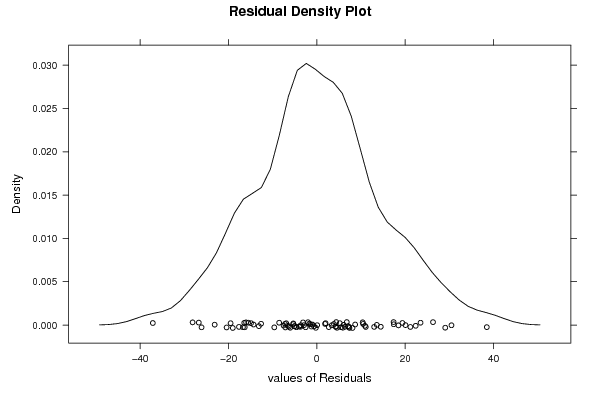
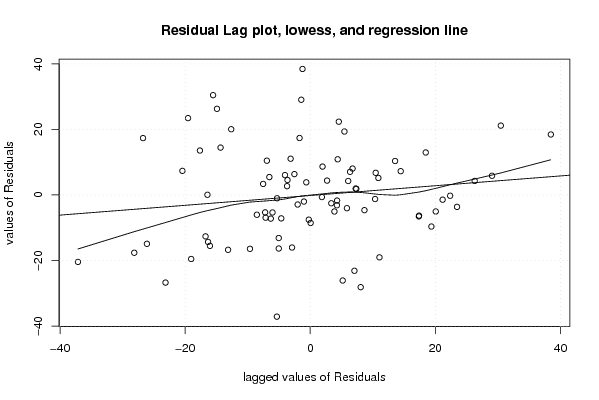
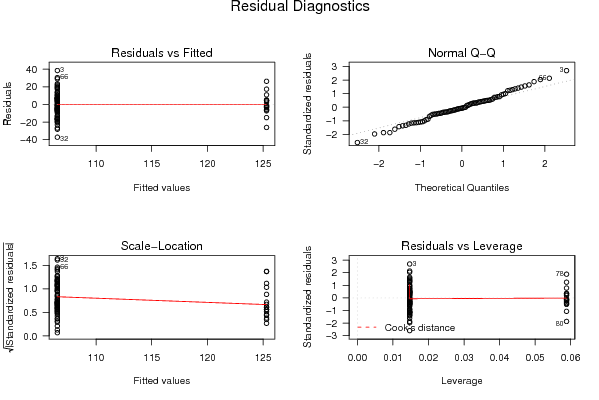
Je bespreekt enkel de tabellen, het is ook belangrijk om te kijken naar de grafieken. De actuals en interpolation vertoont duidelijk een daling na de invoering van de wet; de residuals vertonen een trend, dit is niet volledig correct, er zijn een aantal variabelen niet in rekening gebracht;het histogram vertoont min of meer een normaalverdeling met scheefheid aan beide kanten...
Zo moet je eigenlijk elke grafiek bespreken.
2008-12-01 16:09:29 [Erik Geysen] [reply
Je had je kunnen beperken tot de productie van je tijdsreeks met lineair trend en met seasonal dummies.

Het is een vrij goed model als we kijken naar de adjusted R-squared. We kunnen namelijk 74% van de schommelingen van het indexcijfer verklaren.
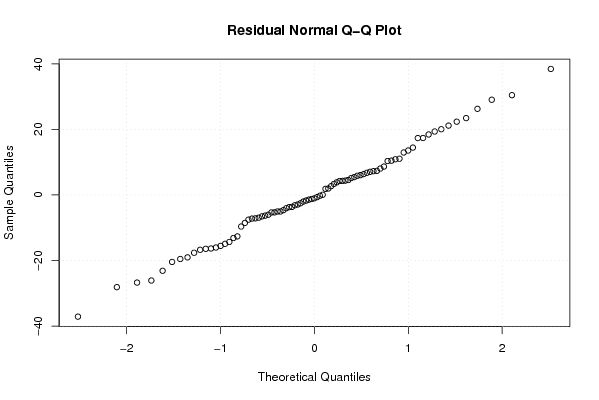
Het histogram is zowel links als rechtsscheef en op de normal Q-Q plot zien we dat er een redelijke lineaire trend is. Enkel aan de uiteinden vinden we een paar extremen.
Op de grafiek van de Residual Autocorrelation function zien we dat bijna elk lijntje buiten het betrouwbaarheidsinterval valt. Dit wil zeggen dat ze niet significant verschillend zijn en dus kunnen te wijten zijn aan het toeval.
Dit model staat dus nog niet op punt. Er gemiddelde moet nul zijn en er mag ook geen autocorrelatie zijn. Ik vind dat de student het vrij goed heeft gedaan. Hij heeft het ook bij het rechte eind om te kijken naar de 2-tailed P-value omdat we niet weten wat er gebeurd is in 2006.

Post a new message
Dataseries X:
119.5	0
125	0
145	0
105.3	0
116.9	0
120.1	0
88.9	0
78.4	0
114.6	0
113.3	0
117	0
99.6	0
99.4	0
101.9	0
115.2	0
108.5	0
113.8	0
121	0
92.2	0
90.2	0
101.5	0
126.6	0
93.9	0
89.8	0
93.4	0
101.5	0
110.4	0
105.9	0
108.4	0
113.9	0
86.1	0
69.4	0
101.2	0
100.5	0
98	0
106.6	0
90.1	0
96.9	0
125.9	0
112	0
100	0
123.9	0
79.8	0
83.4	0
113.6	0
112.9	0
104	0
109.9	0
99	0
106.3	0
128.9	0
111.1	0
102.9	0
130	0
87	0
87.5	0
117.6	0
103.4	0
110.8	0
112.6	0
102.5	0
112.4	0
135.6	0
105.1	0
127.7	0
137	0
91	0
90.5	0
122.4	1
123.3	1
124.3	1
120	1
118.1	1
119	1
142.7	1
123.6	1
129.6	1
151.6	1
110.4	1
99.2	1
130.5	1
136.2	1
129.7	1
128	1
121.6	1


Summary of computational transaction
Raw Inputview raw input (R code)
Raw Outputview raw output of R engine
Computing time3 seconds
R Server'Gwilym Jenkins' @ 72.249.127.135

\begin{tabular}{lllllllll}
\hline
Summary of computational transaction \tabularnewline
Raw Input & view raw input (R code)  \tabularnewline
Raw Output & view raw output of R engine  \tabularnewline
Computing time & 3 seconds \tabularnewline
R Server & 'Gwilym Jenkins' @ 72.249.127.135 \tabularnewline
\hline
\end{tabular}
%Source: https://freestatistics.org/blog/index.php?pk=25846&T=0

[TABLE]
[ROW][C]Summary of computational transaction[/C][/ROW]
[ROW][C]Raw Input[/C][C]view raw input (R code) [/C][/ROW]
[ROW][C]Raw Output[/C][C]view raw output of R engine [/C][/ROW]
[ROW][C]Computing time[/C][C]3 seconds[/C][/ROW]
[ROW][C]R Server[/C][C]'Gwilym Jenkins' @ 72.249.127.135[/C][/ROW]
[/TABLE]
Source: https://freestatistics.org/blog/index.php?pk=25846&T=0

Globally Unique Identifier (entire table): ba.freestatistics.org/blog/index.php?pk=25846&T=0

As an alternative you can also use a QR Code:  

The GUIDs for individual cells are displayed in the table below:

Summary of computational transaction
Raw Inputview raw input (R code)
Raw Outputview raw output of R engine
Computing time3 seconds
R Server'Gwilym Jenkins' @ 72.249.127.135


Multiple Linear Regression - Estimated Regression Equation
y[t] = + 106.532352941176 + 18.7735294117647x[t] + e[t]

\begin{tabular}{lllllllll}
\hline
Multiple Linear Regression - Estimated Regression Equation \tabularnewline
y[t] =  +  106.532352941176 +  18.7735294117647x[t]  + e[t] \tabularnewline
\hline
\end{tabular}
%Source: https://freestatistics.org/blog/index.php?pk=25846&T=1

[TABLE]
[ROW][C]Multiple Linear Regression - Estimated Regression Equation[/C][/ROW]
[ROW][C]y[t] =  +  106.532352941176 +  18.7735294117647x[t]  + e[t][/C][/ROW]
[/TABLE]
Source: https://freestatistics.org/blog/index.php?pk=25846&T=1

Globally Unique Identifier (entire table): ba.freestatistics.org/blog/index.php?pk=25846&T=1

As an alternative you can also use a QR Code:  

The GUIDs for individual cells are displayed in the table below:

Multiple Linear Regression - Estimated Regression Equation
y[t] = + 106.532352941176 + 18.7735294117647x[t] + e[t]


Multiple Linear Regression - Ordinary Least Squares
VariableParameterS.D.T-STATH0: parameter = 02-tail p-value1-tail p-value
(Intercept)106.5323529411761.74390661.088400
x18.77352941176473.8994924.81447e-063e-06

\begin{tabular}{lllllllll}
\hline
Multiple Linear Regression - Ordinary Least Squares \tabularnewline
Variable & Parameter & S.D. & T-STATH0: parameter = 0 & 2-tail p-value & 1-tail p-value \tabularnewline
(Intercept) & 106.532352941176 & 1.743906 & 61.0884 & 0 & 0 \tabularnewline
x & 18.7735294117647 & 3.899492 & 4.8144 & 7e-06 & 3e-06 \tabularnewline
\hline
\end{tabular}
%Source: https://freestatistics.org/blog/index.php?pk=25846&T=2

[TABLE]
[ROW][C]Multiple Linear Regression - Ordinary Least Squares[/C][/ROW]
[ROW][C]Variable[/C][C]Parameter[/C][C]S.D.[/C][C]T-STATH0: parameter = 0[/C][C]2-tail p-value[/C][C]1-tail p-value[/C][/ROW]
[ROW][C](Intercept)[/C][C]106.532352941176[/C][C]1.743906[/C][C]61.0884[/C][C]0[/C][C]0[/C][/ROW]
[ROW][C]x[/C][C]18.7735294117647[/C][C]3.899492[/C][C]4.8144[/C][C]7e-06[/C][C]3e-06[/C][/ROW]
[/TABLE]
Source: https://freestatistics.org/blog/index.php?pk=25846&T=2

Globally Unique Identifier (entire table): ba.freestatistics.org/blog/index.php?pk=25846&T=2

As an alternative you can also use a QR Code:  

The GUIDs for individual cells are displayed in the table below:

Multiple Linear Regression - Ordinary Least Squares
VariableParameterS.D.T-STATH0: parameter = 02-tail p-value1-tail p-value
(Intercept)106.5323529411761.74390661.088400
x18.77352941176473.8994924.81447e-063e-06


Multiple Linear Regression - Regression Statistics
Multiple R0.467219128896478
R-squared0.218293714406784
Adjusted R-squared0.208875566387588
F-TEST (value)23.1779872180681
F-TEST (DF numerator)1
F-TEST (DF denominator)83
p-value6.54887524531578e-06
Multiple Linear Regression - Residual Statistics
Residual Standard Deviation14.3806170734493
Sum Squared Residuals17164.5782352941

\begin{tabular}{lllllllll}
\hline
Multiple Linear Regression - Regression Statistics \tabularnewline
Multiple R & 0.467219128896478 \tabularnewline
R-squared & 0.218293714406784 \tabularnewline
Adjusted R-squared & 0.208875566387588 \tabularnewline
F-TEST (value) & 23.1779872180681 \tabularnewline
F-TEST (DF numerator) & 1 \tabularnewline
F-TEST (DF denominator) & 83 \tabularnewline
p-value & 6.54887524531578e-06 \tabularnewline
Multiple Linear Regression - Residual Statistics \tabularnewline
Residual Standard Deviation & 14.3806170734493 \tabularnewline
Sum Squared Residuals & 17164.5782352941 \tabularnewline
\hline
\end{tabular}
%Source: https://freestatistics.org/blog/index.php?pk=25846&T=3

[TABLE]
[ROW][C]Multiple Linear Regression - Regression Statistics[/C][/ROW]
[ROW][C]Multiple R[/C][C]0.467219128896478[/C][/ROW]
[ROW][C]R-squared[/C][C]0.218293714406784[/C][/ROW]
[ROW][C]Adjusted R-squared[/C][C]0.208875566387588[/C][/ROW]
[ROW][C]F-TEST (value)[/C][C]23.1779872180681[/C][/ROW]
[ROW][C]F-TEST (DF numerator)[/C][C]1[/C][/ROW]
[ROW][C]F-TEST (DF denominator)[/C][C]83[/C][/ROW]
[ROW][C]p-value[/C][C]6.54887524531578e-06[/C][/ROW]
[ROW][C]Multiple Linear Regression - Residual Statistics[/C][/ROW]
[ROW][C]Residual Standard Deviation[/C][C]14.3806170734493[/C][/ROW]
[ROW][C]Sum Squared Residuals[/C][C]17164.5782352941[/C][/ROW]
[/TABLE]
Source: https://freestatistics.org/blog/index.php?pk=25846&T=3

Globally Unique Identifier (entire table): ba.freestatistics.org/blog/index.php?pk=25846&T=3

As an alternative you can also use a QR Code:  

The GUIDs for individual cells are displayed in the table below:

Multiple Linear Regression - Regression Statistics
Multiple R0.467219128896478
R-squared0.218293714406784
Adjusted R-squared0.208875566387588
F-TEST (value)23.1779872180681
F-TEST (DF numerator)1
F-TEST (DF denominator)83
p-value6.54887524531578e-06
Multiple Linear Regression - Residual Statistics
Residual Standard Deviation14.3806170734493
Sum Squared Residuals17164.5782352941


Multiple Linear Regression - Actuals, Interpolation, and Residuals
Time or IndexActualsInterpolationForecastResidualsPrediction Error
1119.5106.53235294117712.9676470588229
2125106.53235294117618.4676470588235
3145106.53235294117638.4676470588235
4105.3106.532352941176-1.23235294117646
5116.9106.53235294117610.3676470588235
6120.1106.53235294117613.5676470588235
788.9106.532352941176-17.6323529411765
878.4106.532352941176-28.1323529411765
9114.6106.5323529411768.06764705882353
10113.3106.5323529411766.76764705882354
11117106.53235294117610.4676470588235
1299.6106.532352941176-6.93235294117647
1399.4106.532352941176-7.13235294117646
14101.9106.532352941176-4.63235294117646
15115.2106.5323529411768.66764705882354
16108.5106.5323529411761.96764705882354
17113.8106.5323529411767.26764705882354
18121106.53235294117614.4676470588235
1992.2106.532352941176-14.3323529411765
2090.2106.532352941176-16.3323529411765
21101.5106.532352941176-5.03235294117646
22126.6106.53235294117620.0676470588235
2393.9106.532352941176-12.6323529411765
2489.8106.532352941176-16.7323529411765
2593.4106.532352941176-13.1323529411765
26101.5106.532352941176-5.03235294117646
27110.4106.5323529411763.86764705882354
28105.9106.532352941176-0.632352941176456
29108.4106.5323529411761.86764705882354
30113.9106.5323529411767.36764705882354
3186.1106.532352941176-20.4323529411765
3269.4106.532352941176-37.1323529411765
33101.2106.532352941176-5.33235294117646
34100.5106.532352941176-6.03235294117646
3598106.532352941176-8.53235294117646
36106.6106.5323529411760.0676470588235327
3790.1106.532352941176-16.4323529411765
3896.9106.532352941176-9.63235294117646
39125.9106.53235294117619.3676470588235
40112106.5323529411765.46764705882354
41100106.532352941176-6.53235294117646
42123.9106.53235294117617.3676470588235
4379.8106.532352941176-26.7323529411765
4483.4106.532352941176-23.1323529411765
45113.6106.5323529411767.06764705882353
46112.9106.5323529411766.36764705882354
47104106.532352941176-2.53235294117646
48109.9106.5323529411763.36764705882354
4999106.532352941176-7.53235294117646
50106.3106.532352941176-0.232352941176464
51128.9106.53235294117622.3676470588235
52111.1106.5323529411764.56764705882353
53102.9106.532352941176-3.63235294117646
54130106.53235294117623.4676470588235
5587106.532352941176-19.5323529411765
5687.5106.532352941176-19.0323529411765
57117.6106.53235294117611.0676470588235
58103.4106.532352941176-3.13235294117646
59110.8106.5323529411764.26764705882354
60112.6106.5323529411766.06764705882353
61102.5106.532352941176-4.03235294117646
62112.4106.5323529411765.86764705882354
63135.6106.53235294117629.0676470588235
64105.1106.532352941176-1.43235294117647
65127.7106.53235294117621.1676470588235
66137106.53235294117630.4676470588235
6791106.532352941176-15.5323529411765
6890.5106.532352941176-16.0323529411765
69122.4125.305882352941-2.90588235294117
70123.3125.305882352941-2.00588235294118
71124.3125.305882352941-1.00588235294118
72120125.305882352941-5.30588235294117
73118.1125.305882352941-7.20588235294118
74119125.305882352941-6.30588235294117
75142.7125.30588235294117.3941176470588
76123.6125.305882352941-1.70588235294118
77129.6125.3058823529414.29411764705882
78151.6125.30588235294126.2941176470588
79110.4125.305882352941-14.9058823529412
8099.2125.305882352941-26.1058823529412
81130.5125.3058823529415.19411764705883
82136.2125.30588235294110.8941176470588
83129.7125.3058823529414.39411764705882
84128125.3058823529412.69411764705883
85121.6125.305882352941-3.70588235294118

\begin{tabular}{lllllllll}
\hline
Multiple Linear Regression - Actuals, Interpolation, and Residuals \tabularnewline
Time or Index & Actuals & InterpolationForecast & ResidualsPrediction Error \tabularnewline
1 & 119.5 & 106.532352941177 & 12.9676470588229 \tabularnewline
2 & 125 & 106.532352941176 & 18.4676470588235 \tabularnewline
3 & 145 & 106.532352941176 & 38.4676470588235 \tabularnewline
4 & 105.3 & 106.532352941176 & -1.23235294117646 \tabularnewline
5 & 116.9 & 106.532352941176 & 10.3676470588235 \tabularnewline
6 & 120.1 & 106.532352941176 & 13.5676470588235 \tabularnewline
7 & 88.9 & 106.532352941176 & -17.6323529411765 \tabularnewline
8 & 78.4 & 106.532352941176 & -28.1323529411765 \tabularnewline
9 & 114.6 & 106.532352941176 & 8.06764705882353 \tabularnewline
10 & 113.3 & 106.532352941176 & 6.76764705882354 \tabularnewline
11 & 117 & 106.532352941176 & 10.4676470588235 \tabularnewline
12 & 99.6 & 106.532352941176 & -6.93235294117647 \tabularnewline
13 & 99.4 & 106.532352941176 & -7.13235294117646 \tabularnewline
14 & 101.9 & 106.532352941176 & -4.63235294117646 \tabularnewline
15 & 115.2 & 106.532352941176 & 8.66764705882354 \tabularnewline
16 & 108.5 & 106.532352941176 & 1.96764705882354 \tabularnewline
17 & 113.8 & 106.532352941176 & 7.26764705882354 \tabularnewline
18 & 121 & 106.532352941176 & 14.4676470588235 \tabularnewline
19 & 92.2 & 106.532352941176 & -14.3323529411765 \tabularnewline
20 & 90.2 & 106.532352941176 & -16.3323529411765 \tabularnewline
21 & 101.5 & 106.532352941176 & -5.03235294117646 \tabularnewline
22 & 126.6 & 106.532352941176 & 20.0676470588235 \tabularnewline
23 & 93.9 & 106.532352941176 & -12.6323529411765 \tabularnewline
24 & 89.8 & 106.532352941176 & -16.7323529411765 \tabularnewline
25 & 93.4 & 106.532352941176 & -13.1323529411765 \tabularnewline
26 & 101.5 & 106.532352941176 & -5.03235294117646 \tabularnewline
27 & 110.4 & 106.532352941176 & 3.86764705882354 \tabularnewline
28 & 105.9 & 106.532352941176 & -0.632352941176456 \tabularnewline
29 & 108.4 & 106.532352941176 & 1.86764705882354 \tabularnewline
30 & 113.9 & 106.532352941176 & 7.36764705882354 \tabularnewline
31 & 86.1 & 106.532352941176 & -20.4323529411765 \tabularnewline
32 & 69.4 & 106.532352941176 & -37.1323529411765 \tabularnewline
33 & 101.2 & 106.532352941176 & -5.33235294117646 \tabularnewline
34 & 100.5 & 106.532352941176 & -6.03235294117646 \tabularnewline
35 & 98 & 106.532352941176 & -8.53235294117646 \tabularnewline
36 & 106.6 & 106.532352941176 & 0.0676470588235327 \tabularnewline
37 & 90.1 & 106.532352941176 & -16.4323529411765 \tabularnewline
38 & 96.9 & 106.532352941176 & -9.63235294117646 \tabularnewline
39 & 125.9 & 106.532352941176 & 19.3676470588235 \tabularnewline
40 & 112 & 106.532352941176 & 5.46764705882354 \tabularnewline
41 & 100 & 106.532352941176 & -6.53235294117646 \tabularnewline
42 & 123.9 & 106.532352941176 & 17.3676470588235 \tabularnewline
43 & 79.8 & 106.532352941176 & -26.7323529411765 \tabularnewline
44 & 83.4 & 106.532352941176 & -23.1323529411765 \tabularnewline
45 & 113.6 & 106.532352941176 & 7.06764705882353 \tabularnewline
46 & 112.9 & 106.532352941176 & 6.36764705882354 \tabularnewline
47 & 104 & 106.532352941176 & -2.53235294117646 \tabularnewline
48 & 109.9 & 106.532352941176 & 3.36764705882354 \tabularnewline
49 & 99 & 106.532352941176 & -7.53235294117646 \tabularnewline
50 & 106.3 & 106.532352941176 & -0.232352941176464 \tabularnewline
51 & 128.9 & 106.532352941176 & 22.3676470588235 \tabularnewline
52 & 111.1 & 106.532352941176 & 4.56764705882353 \tabularnewline
53 & 102.9 & 106.532352941176 & -3.63235294117646 \tabularnewline
54 & 130 & 106.532352941176 & 23.4676470588235 \tabularnewline
55 & 87 & 106.532352941176 & -19.5323529411765 \tabularnewline
56 & 87.5 & 106.532352941176 & -19.0323529411765 \tabularnewline
57 & 117.6 & 106.532352941176 & 11.0676470588235 \tabularnewline
58 & 103.4 & 106.532352941176 & -3.13235294117646 \tabularnewline
59 & 110.8 & 106.532352941176 & 4.26764705882354 \tabularnewline
60 & 112.6 & 106.532352941176 & 6.06764705882353 \tabularnewline
61 & 102.5 & 106.532352941176 & -4.03235294117646 \tabularnewline
62 & 112.4 & 106.532352941176 & 5.86764705882354 \tabularnewline
63 & 135.6 & 106.532352941176 & 29.0676470588235 \tabularnewline
64 & 105.1 & 106.532352941176 & -1.43235294117647 \tabularnewline
65 & 127.7 & 106.532352941176 & 21.1676470588235 \tabularnewline
66 & 137 & 106.532352941176 & 30.4676470588235 \tabularnewline
67 & 91 & 106.532352941176 & -15.5323529411765 \tabularnewline
68 & 90.5 & 106.532352941176 & -16.0323529411765 \tabularnewline
69 & 122.4 & 125.305882352941 & -2.90588235294117 \tabularnewline
70 & 123.3 & 125.305882352941 & -2.00588235294118 \tabularnewline
71 & 124.3 & 125.305882352941 & -1.00588235294118 \tabularnewline
72 & 120 & 125.305882352941 & -5.30588235294117 \tabularnewline
73 & 118.1 & 125.305882352941 & -7.20588235294118 \tabularnewline
74 & 119 & 125.305882352941 & -6.30588235294117 \tabularnewline
75 & 142.7 & 125.305882352941 & 17.3941176470588 \tabularnewline
76 & 123.6 & 125.305882352941 & -1.70588235294118 \tabularnewline
77 & 129.6 & 125.305882352941 & 4.29411764705882 \tabularnewline
78 & 151.6 & 125.305882352941 & 26.2941176470588 \tabularnewline
79 & 110.4 & 125.305882352941 & -14.9058823529412 \tabularnewline
80 & 99.2 & 125.305882352941 & -26.1058823529412 \tabularnewline
81 & 130.5 & 125.305882352941 & 5.19411764705883 \tabularnewline
82 & 136.2 & 125.305882352941 & 10.8941176470588 \tabularnewline
83 & 129.7 & 125.305882352941 & 4.39411764705882 \tabularnewline
84 & 128 & 125.305882352941 & 2.69411764705883 \tabularnewline
85 & 121.6 & 125.305882352941 & -3.70588235294118 \tabularnewline
\hline
\end{tabular}
%Source: https://freestatistics.org/blog/index.php?pk=25846&T=4

[TABLE]
[ROW][C]Multiple Linear Regression - Actuals, Interpolation, and Residuals[/C][/ROW]
[ROW][C]Time or Index[/C][C]Actuals[/C][C]InterpolationForecast[/C][C]ResidualsPrediction Error[/C][/ROW]
[ROW][C]1[/C][C]119.5[/C][C]106.532352941177[/C][C]12.9676470588229[/C][/ROW]
[ROW][C]2[/C][C]125[/C][C]106.532352941176[/C][C]18.4676470588235[/C][/ROW]
[ROW][C]3[/C][C]145[/C][C]106.532352941176[/C][C]38.4676470588235[/C][/ROW]
[ROW][C]4[/C][C]105.3[/C][C]106.532352941176[/C][C]-1.23235294117646[/C][/ROW]
[ROW][C]5[/C][C]116.9[/C][C]106.532352941176[/C][C]10.3676470588235[/C][/ROW]
[ROW][C]6[/C][C]120.1[/C][C]106.532352941176[/C][C]13.5676470588235[/C][/ROW]
[ROW][C]7[/C][C]88.9[/C][C]106.532352941176[/C][C]-17.6323529411765[/C][/ROW]
[ROW][C]8[/C][C]78.4[/C][C]106.532352941176[/C][C]-28.1323529411765[/C][/ROW]
[ROW][C]9[/C][C]114.6[/C][C]106.532352941176[/C][C]8.06764705882353[/C][/ROW]
[ROW][C]10[/C][C]113.3[/C][C]106.532352941176[/C][C]6.76764705882354[/C][/ROW]
[ROW][C]11[/C][C]117[/C][C]106.532352941176[/C][C]10.4676470588235[/C][/ROW]
[ROW][C]12[/C][C]99.6[/C][C]106.532352941176[/C][C]-6.93235294117647[/C][/ROW]
[ROW][C]13[/C][C]99.4[/C][C]106.532352941176[/C][C]-7.13235294117646[/C][/ROW]
[ROW][C]14[/C][C]101.9[/C][C]106.532352941176[/C][C]-4.63235294117646[/C][/ROW]
[ROW][C]15[/C][C]115.2[/C][C]106.532352941176[/C][C]8.66764705882354[/C][/ROW]
[ROW][C]16[/C][C]108.5[/C][C]106.532352941176[/C][C]1.96764705882354[/C][/ROW]
[ROW][C]17[/C][C]113.8[/C][C]106.532352941176[/C][C]7.26764705882354[/C][/ROW]
[ROW][C]18[/C][C]121[/C][C]106.532352941176[/C][C]14.4676470588235[/C][/ROW]
[ROW][C]19[/C][C]92.2[/C][C]106.532352941176[/C][C]-14.3323529411765[/C][/ROW]
[ROW][C]20[/C][C]90.2[/C][C]106.532352941176[/C][C]-16.3323529411765[/C][/ROW]
[ROW][C]21[/C][C]101.5[/C][C]106.532352941176[/C][C]-5.03235294117646[/C][/ROW]
[ROW][C]22[/C][C]126.6[/C][C]106.532352941176[/C][C]20.0676470588235[/C][/ROW]
[ROW][C]23[/C][C]93.9[/C][C]106.532352941176[/C][C]-12.6323529411765[/C][/ROW]
[ROW][C]24[/C][C]89.8[/C][C]106.532352941176[/C][C]-16.7323529411765[/C][/ROW]
[ROW][C]25[/C][C]93.4[/C][C]106.532352941176[/C][C]-13.1323529411765[/C][/ROW]
[ROW][C]26[/C][C]101.5[/C][C]106.532352941176[/C][C]-5.03235294117646[/C][/ROW]
[ROW][C]27[/C][C]110.4[/C][C]106.532352941176[/C][C]3.86764705882354[/C][/ROW]
[ROW][C]28[/C][C]105.9[/C][C]106.532352941176[/C][C]-0.632352941176456[/C][/ROW]
[ROW][C]29[/C][C]108.4[/C][C]106.532352941176[/C][C]1.86764705882354[/C][/ROW]
[ROW][C]30[/C][C]113.9[/C][C]106.532352941176[/C][C]7.36764705882354[/C][/ROW]
[ROW][C]31[/C][C]86.1[/C][C]106.532352941176[/C][C]-20.4323529411765[/C][/ROW]
[ROW][C]32[/C][C]69.4[/C][C]106.532352941176[/C][C]-37.1323529411765[/C][/ROW]
[ROW][C]33[/C][C]101.2[/C][C]106.532352941176[/C][C]-5.33235294117646[/C][/ROW]
[ROW][C]34[/C][C]100.5[/C][C]106.532352941176[/C][C]-6.03235294117646[/C][/ROW]
[ROW][C]35[/C][C]98[/C][C]106.532352941176[/C][C]-8.53235294117646[/C][/ROW]
[ROW][C]36[/C][C]106.6[/C][C]106.532352941176[/C][C]0.0676470588235327[/C][/ROW]
[ROW][C]37[/C][C]90.1[/C][C]106.532352941176[/C][C]-16.4323529411765[/C][/ROW]
[ROW][C]38[/C][C]96.9[/C][C]106.532352941176[/C][C]-9.63235294117646[/C][/ROW]
[ROW][C]39[/C][C]125.9[/C][C]106.532352941176[/C][C]19.3676470588235[/C][/ROW]
[ROW][C]40[/C][C]112[/C][C]106.532352941176[/C][C]5.46764705882354[/C][/ROW]
[ROW][C]41[/C][C]100[/C][C]106.532352941176[/C][C]-6.53235294117646[/C][/ROW]
[ROW][C]42[/C][C]123.9[/C][C]106.532352941176[/C][C]17.3676470588235[/C][/ROW]
[ROW][C]43[/C][C]79.8[/C][C]106.532352941176[/C][C]-26.7323529411765[/C][/ROW]
[ROW][C]44[/C][C]83.4[/C][C]106.532352941176[/C][C]-23.1323529411765[/C][/ROW]
[ROW][C]45[/C][C]113.6[/C][C]106.532352941176[/C][C]7.06764705882353[/C][/ROW]
[ROW][C]46[/C][C]112.9[/C][C]106.532352941176[/C][C]6.36764705882354[/C][/ROW]
[ROW][C]47[/C][C]104[/C][C]106.532352941176[/C][C]-2.53235294117646[/C][/ROW]
[ROW][C]48[/C][C]109.9[/C][C]106.532352941176[/C][C]3.36764705882354[/C][/ROW]
[ROW][C]49[/C][C]99[/C][C]106.532352941176[/C][C]-7.53235294117646[/C][/ROW]
[ROW][C]50[/C][C]106.3[/C][C]106.532352941176[/C][C]-0.232352941176464[/C][/ROW]
[ROW][C]51[/C][C]128.9[/C][C]106.532352941176[/C][C]22.3676470588235[/C][/ROW]
[ROW][C]52[/C][C]111.1[/C][C]106.532352941176[/C][C]4.56764705882353[/C][/ROW]
[ROW][C]53[/C][C]102.9[/C][C]106.532352941176[/C][C]-3.63235294117646[/C][/ROW]
[ROW][C]54[/C][C]130[/C][C]106.532352941176[/C][C]23.4676470588235[/C][/ROW]
[ROW][C]55[/C][C]87[/C][C]106.532352941176[/C][C]-19.5323529411765[/C][/ROW]
[ROW][C]56[/C][C]87.5[/C][C]106.532352941176[/C][C]-19.0323529411765[/C][/ROW]
[ROW][C]57[/C][C]117.6[/C][C]106.532352941176[/C][C]11.0676470588235[/C][/ROW]
[ROW][C]58[/C][C]103.4[/C][C]106.532352941176[/C][C]-3.13235294117646[/C][/ROW]
[ROW][C]59[/C][C]110.8[/C][C]106.532352941176[/C][C]4.26764705882354[/C][/ROW]
[ROW][C]60[/C][C]112.6[/C][C]106.532352941176[/C][C]6.06764705882353[/C][/ROW]
[ROW][C]61[/C][C]102.5[/C][C]106.532352941176[/C][C]-4.03235294117646[/C][/ROW]
[ROW][C]62[/C][C]112.4[/C][C]106.532352941176[/C][C]5.86764705882354[/C][/ROW]
[ROW][C]63[/C][C]135.6[/C][C]106.532352941176[/C][C]29.0676470588235[/C][/ROW]
[ROW][C]64[/C][C]105.1[/C][C]106.532352941176[/C][C]-1.43235294117647[/C][/ROW]
[ROW][C]65[/C][C]127.7[/C][C]106.532352941176[/C][C]21.1676470588235[/C][/ROW]
[ROW][C]66[/C][C]137[/C][C]106.532352941176[/C][C]30.4676470588235[/C][/ROW]
[ROW][C]67[/C][C]91[/C][C]106.532352941176[/C][C]-15.5323529411765[/C][/ROW]
[ROW][C]68[/C][C]90.5[/C][C]106.532352941176[/C][C]-16.0323529411765[/C][/ROW]
[ROW][C]69[/C][C]122.4[/C][C]125.305882352941[/C][C]-2.90588235294117[/C][/ROW]
[ROW][C]70[/C][C]123.3[/C][C]125.305882352941[/C][C]-2.00588235294118[/C][/ROW]
[ROW][C]71[/C][C]124.3[/C][C]125.305882352941[/C][C]-1.00588235294118[/C][/ROW]
[ROW][C]72[/C][C]120[/C][C]125.305882352941[/C][C]-5.30588235294117[/C][/ROW]
[ROW][C]73[/C][C]118.1[/C][C]125.305882352941[/C][C]-7.20588235294118[/C][/ROW]
[ROW][C]74[/C][C]119[/C][C]125.305882352941[/C][C]-6.30588235294117[/C][/ROW]
[ROW][C]75[/C][C]142.7[/C][C]125.305882352941[/C][C]17.3941176470588[/C][/ROW]
[ROW][C]76[/C][C]123.6[/C][C]125.305882352941[/C][C]-1.70588235294118[/C][/ROW]
[ROW][C]77[/C][C]129.6[/C][C]125.305882352941[/C][C]4.29411764705882[/C][/ROW]
[ROW][C]78[/C][C]151.6[/C][C]125.305882352941[/C][C]26.2941176470588[/C][/ROW]
[ROW][C]79[/C][C]110.4[/C][C]125.305882352941[/C][C]-14.9058823529412[/C][/ROW]
[ROW][C]80[/C][C]99.2[/C][C]125.305882352941[/C][C]-26.1058823529412[/C][/ROW]
[ROW][C]81[/C][C]130.5[/C][C]125.305882352941[/C][C]5.19411764705883[/C][/ROW]
[ROW][C]82[/C][C]136.2[/C][C]125.305882352941[/C][C]10.8941176470588[/C][/ROW]
[ROW][C]83[/C][C]129.7[/C][C]125.305882352941[/C][C]4.39411764705882[/C][/ROW]
[ROW][C]84[/C][C]128[/C][C]125.305882352941[/C][C]2.69411764705883[/C][/ROW]
[ROW][C]85[/C][C]121.6[/C][C]125.305882352941[/C][C]-3.70588235294118[/C][/ROW]
[/TABLE]
Source: https://freestatistics.org/blog/index.php?pk=25846&T=4

Globally Unique Identifier (entire table): ba.freestatistics.org/blog/index.php?pk=25846&T=4

As an alternative you can also use a QR Code:  

The GUIDs for individual cells are displayed in the table below:

Multiple Linear Regression - Actuals, Interpolation, and Residuals
Time or IndexActualsInterpolationForecastResidualsPrediction Error
1119.5106.53235294117712.9676470588229
2125106.53235294117618.4676470588235
3145106.53235294117638.4676470588235
4105.3106.532352941176-1.23235294117646
5116.9106.53235294117610.3676470588235
6120.1106.53235294117613.5676470588235
788.9106.532352941176-17.6323529411765
878.4106.532352941176-28.1323529411765
9114.6106.5323529411768.06764705882353
10113.3106.5323529411766.76764705882354
11117106.53235294117610.4676470588235
1299.6106.532352941176-6.93235294117647
1399.4106.532352941176-7.13235294117646
14101.9106.532352941176-4.63235294117646
15115.2106.5323529411768.66764705882354
16108.5106.5323529411761.96764705882354
17113.8106.5323529411767.26764705882354
18121106.53235294117614.4676470588235
1992.2106.532352941176-14.3323529411765
2090.2106.532352941176-16.3323529411765
21101.5106.532352941176-5.03235294117646
22126.6106.53235294117620.0676470588235
2393.9106.532352941176-12.6323529411765
2489.8106.532352941176-16.7323529411765
2593.4106.532352941176-13.1323529411765
26101.5106.532352941176-5.03235294117646
27110.4106.5323529411763.86764705882354
28105.9106.532352941176-0.632352941176456
29108.4106.5323529411761.86764705882354
30113.9106.5323529411767.36764705882354
3186.1106.532352941176-20.4323529411765
3269.4106.532352941176-37.1323529411765
33101.2106.532352941176-5.33235294117646
34100.5106.532352941176-6.03235294117646
3598106.532352941176-8.53235294117646
36106.6106.5323529411760.0676470588235327
3790.1106.532352941176-16.4323529411765
3896.9106.532352941176-9.63235294117646
39125.9106.53235294117619.3676470588235
40112106.5323529411765.46764705882354
41100106.532352941176-6.53235294117646
42123.9106.53235294117617.3676470588235
4379.8106.532352941176-26.7323529411765
4483.4106.532352941176-23.1323529411765
45113.6106.5323529411767.06764705882353
46112.9106.5323529411766.36764705882354
47104106.532352941176-2.53235294117646
48109.9106.5323529411763.36764705882354
4999106.532352941176-7.53235294117646
50106.3106.532352941176-0.232352941176464
51128.9106.53235294117622.3676470588235
52111.1106.5323529411764.56764705882353
53102.9106.532352941176-3.63235294117646
54130106.53235294117623.4676470588235
5587106.532352941176-19.5323529411765
5687.5106.532352941176-19.0323529411765
57117.6106.53235294117611.0676470588235
58103.4106.532352941176-3.13235294117646
59110.8106.5323529411764.26764705882354
60112.6106.5323529411766.06764705882353
61102.5106.532352941176-4.03235294117646
62112.4106.5323529411765.86764705882354
63135.6106.53235294117629.0676470588235
64105.1106.532352941176-1.43235294117647
65127.7106.53235294117621.1676470588235
66137106.53235294117630.4676470588235
6791106.532352941176-15.5323529411765
6890.5106.532352941176-16.0323529411765
69122.4125.305882352941-2.90588235294117
70123.3125.305882352941-2.00588235294118
71124.3125.305882352941-1.00588235294118
72120125.305882352941-5.30588235294117
73118.1125.305882352941-7.20588235294118
74119125.305882352941-6.30588235294117
75142.7125.30588235294117.3941176470588
76123.6125.305882352941-1.70588235294118
77129.6125.3058823529414.29411764705882
78151.6125.30588235294126.2941176470588
79110.4125.305882352941-14.9058823529412
8099.2125.305882352941-26.1058823529412
81130.5125.3058823529415.19411764705883
82136.2125.30588235294110.8941176470588
83129.7125.3058823529414.39411764705882
84128125.3058823529412.69411764705883
85121.6125.305882352941-3.70588235294118


Parameters (Session):
par1 = 1 ; par2 = Do not include Seasonal Dummies ; par3 = No Linear Trend ;
Parameters (R input):
par1 = 1 ; par2 = Do not include Seasonal Dummies ; par3 = No Linear Trend ;
R code (references can be found in the software module):
library(lattice)
par1 <- as.numeric(par1)
x <- t(y)
k <- length(x[1,])
n <- length(x[,1])
x1 <- cbind(x[,par1], x[,1:k!=par1])
mycolnames <- c(colnames(x)[par1], colnames(x)[1:k!=par1])
colnames(x1) <- mycolnames #colnames(x)[par1]
x <- x1
if (par3 == 'First Differences'){
x2 <- array(0, dim=c(n-1,k), dimnames=list(1:(n-1), paste('(1-B)',colnames(x),sep='')))
for (i in 1:n-1) {
for (j in 1:k) {
x2[i,j] <- x[i+1,j] - x[i,j]
}
}
x <- x2
}
if (par2 == 'Include Monthly Dummies'){
x2 <- array(0, dim=c(n,11), dimnames=list(1:n, paste('M', seq(1:11), sep ='')))
for (i in 1:11){
x2[seq(i,n,12),i] <- 1
}
x <- cbind(x, x2)
}
if (par2 == 'Include Quarterly Dummies'){
x2 <- array(0, dim=c(n,3), dimnames=list(1:n, paste('Q', seq(1:3), sep ='')))
for (i in 1:3){
x2[seq(i,n,4),i] <- 1
}
x <- cbind(x, x2)
}
k <- length(x[1,])
if (par3 == 'Linear Trend'){
x <- cbind(x, c(1:n))
colnames(x)[k+1] <- 't'
}
x
k <- length(x[1,])
df <- as.data.frame(x)
(mylm <- lm(df))
(mysum <- summary(mylm))
bitmap(file='test0.png')
plot(x[,1], type='l', main='Actuals and Interpolation', ylab='value of Actuals and Interpolation (dots)', xlab='time or index')
points(x[,1]-mysum$resid)
grid()
dev.off()
bitmap(file='test1.png')
plot(mysum$resid, type='b', pch=19, main='Residuals', ylab='value of Residuals', xlab='time or index')
grid()
dev.off()
bitmap(file='test2.png')
hist(mysum$resid, main='Residual Histogram', xlab='values of Residuals')
grid()
dev.off()
bitmap(file='test3.png')
densityplot(~mysum$resid,col='black',main='Residual Density Plot', xlab='values of Residuals')
dev.off()
bitmap(file='test4.png')
qqnorm(mysum$resid, main='Residual Normal Q-Q Plot')
grid()
dev.off()
(myerror <- as.ts(mysum$resid))
bitmap(file='test5.png')
dum <- cbind(lag(myerror,k=1),myerror)
dum
dum1 <- dum[2:length(myerror),]
dum1
z <- as.data.frame(dum1)
z
plot(z,main=paste('Residual Lag plot, lowess, and regression line'), ylab='values of Residuals', xlab='lagged values of Residuals')
lines(lowess(z))
abline(lm(z))
grid()
dev.off()
bitmap(file='test6.png')
acf(mysum$resid, lag.max=length(mysum$resid)/2, main='Residual Autocorrelation Function')
grid()
dev.off()
bitmap(file='test7.png')
pacf(mysum$resid, lag.max=length(mysum$resid)/2, main='Residual Partial Autocorrelation Function')
grid()
dev.off()
bitmap(file='test8.png')
opar <- par(mfrow = c(2,2), oma = c(0, 0, 1.1, 0))
plot(mylm, las = 1, sub='Residual Diagnostics')
par(opar)
dev.off()
load(file='createtable')
a<-table.start()
a<-table.row.start(a)
a<-table.element(a, 'Multiple Linear Regression - Estimated Regression Equation', 1, TRUE)
a<-table.row.end(a)
myeq <- colnames(x)[1]
myeq <- paste(myeq, '[t] = ', sep='')
for (i in 1:k){
if (mysum$coefficients[i,1] > 0) myeq <- paste(myeq, '+', '')
myeq <- paste(myeq, mysum$coefficients[i,1], sep=' ')
if (rownames(mysum$coefficients)[i] != '(Intercept)') {
myeq <- paste(myeq, rownames(mysum$coefficients)[i], sep='')
if (rownames(mysum$coefficients)[i] != 't') myeq <- paste(myeq, '[t]', sep='')
}
}
myeq <- paste(myeq, ' + e[t]')
a<-table.row.start(a)
a<-table.element(a, myeq)
a<-table.row.end(a)
a<-table.end(a)
table.save(a,file='mytable1.tab')
a<-table.start()
a<-table.row.start(a)
a<-table.element(a,hyperlink('ols1.htm','Multiple Linear Regression - Ordinary Least Squares',''), 6, TRUE)
a<-table.row.end(a)
a<-table.row.start(a)
a<-table.element(a,'Variable',header=TRUE)
a<-table.element(a,'Parameter',header=TRUE)
a<-table.element(a,'S.D.',header=TRUE)
a<-table.element(a,'T-STAT
H0: parameter = 0',header=TRUE)
a<-table.element(a,'2-tail p-value',header=TRUE)
a<-table.element(a,'1-tail p-value',header=TRUE)
a<-table.row.end(a)
for (i in 1:k){
a<-table.row.start(a)
a<-table.element(a,rownames(mysum$coefficients)[i],header=TRUE)
a<-table.element(a,mysum$coefficients[i,1])
a<-table.element(a, round(mysum$coefficients[i,2],6))
a<-table.element(a, round(mysum$coefficients[i,3],4))
a<-table.element(a, round(mysum$coefficients[i,4],6))
a<-table.element(a, round(mysum$coefficients[i,4]/2,6))
a<-table.row.end(a)
}
a<-table.end(a)
table.save(a,file='mytable2.tab')
a<-table.start()
a<-table.row.start(a)
a<-table.element(a, 'Multiple Linear Regression - Regression Statistics', 2, TRUE)
a<-table.row.end(a)
a<-table.row.start(a)
a<-table.element(a, 'Multiple R',1,TRUE)
a<-table.element(a, sqrt(mysum$r.squared))
a<-table.row.end(a)
a<-table.row.start(a)
a<-table.element(a, 'R-squared',1,TRUE)
a<-table.element(a, mysum$r.squared)
a<-table.row.end(a)
a<-table.row.start(a)
a<-table.element(a, 'Adjusted R-squared',1,TRUE)
a<-table.element(a, mysum$adj.r.squared)
a<-table.row.end(a)
a<-table.row.start(a)
a<-table.element(a, 'F-TEST (value)',1,TRUE)
a<-table.element(a, mysum$fstatistic[1])
a<-table.row.end(a)
a<-table.row.start(a)
a<-table.element(a, 'F-TEST (DF numerator)',1,TRUE)
a<-table.element(a, mysum$fstatistic[2])
a<-table.row.end(a)
a<-table.row.start(a)
a<-table.element(a, 'F-TEST (DF denominator)',1,TRUE)
a<-table.element(a, mysum$fstatistic[3])
a<-table.row.end(a)
a<-table.row.start(a)
a<-table.element(a, 'p-value',1,TRUE)
a<-table.element(a, 1-pf(mysum$fstatistic[1],mysum$fstatistic[2],mysum$fstatistic[3]))
a<-table.row.end(a)
a<-table.row.start(a)
a<-table.element(a, 'Multiple Linear Regression - Residual Statistics', 2, TRUE)
a<-table.row.end(a)
a<-table.row.start(a)
a<-table.element(a, 'Residual Standard Deviation',1,TRUE)
a<-table.element(a, mysum$sigma)
a<-table.row.end(a)
a<-table.row.start(a)
a<-table.element(a, 'Sum Squared Residuals',1,TRUE)
a<-table.element(a, sum(myerror*myerror))
a<-table.row.end(a)
a<-table.end(a)
table.save(a,file='mytable3.tab')
a<-table.start()
a<-table.row.start(a)
a<-table.element(a, 'Multiple Linear Regression - Actuals, Interpolation, and Residuals', 4, TRUE)
a<-table.row.end(a)
a<-table.row.start(a)
a<-table.element(a, 'Time or Index', 1, TRUE)
a<-table.element(a, 'Actuals', 1, TRUE)
a<-table.element(a, 'Interpolation
Forecast', 1, TRUE)
a<-table.element(a, 'Residuals
Prediction Error', 1, TRUE)
a<-table.row.end(a)
for (i in 1:n) {
a<-table.row.start(a)
a<-table.element(a,i, 1, TRUE)
a<-table.element(a,x[i])
a<-table.element(a,x[i]-mysum$resid[i])
a<-table.element(a,mysum$resid[i])
a<-table.row.end(a)
}
a<-table.end(a)
table.save(a,file='mytable4.tab')