Free Statistics

of Irreproducible Research!

Author's title

Author*The author of this computation has been verified*
R Software Modulerwasp_multipleregression.wasp
Title produced by softwareMultiple Regression
Date of computationThu, 27 Nov 2008 08:33:45 -0700
Cite this page as followsStatistical Computations at FreeStatistics.org, Office for Research Development and Education, URL https://freestatistics.org/blog/index.php?v=date/2008/Nov/27/t12278000894iuq2aisrr6jjjz.htm/, Retrieved Sun, 19 May 2024 12:19:29 +0000
Statistical Computations at FreeStatistics.org, Office for Research Development and Education, URL https://freestatistics.org/blog/index.php?pk=25841, Retrieved Sun, 19 May 2024 12:19:29 +0000
QR Codes:

Original text written by user:
IsPrivate?No (this computation is public)
User-defined keywords
Estimated Impact142
Family? (F = Feedback message, R = changed R code, M = changed R Module, P = changed Parameters, D = changed Data)
-     [Multiple Regression] [Q1 The Seatbeltlaw] [2007-11-14 19:27:43] [8cd6641b921d30ebe00b648d1481bba0]
F R PD  [Multiple Regression] [11.3] [2008-11-26 19:36:19] [1eab65e90adf64584b8e6f0da23ff414]
F   PD      [Multiple Regression] [11.3.2] [2008-11-27 15:33:45] [0458bd763b171003ec052ce63099d477] [Current]
Feedback Forum
2008-11-29 12:29:19 [Aurélie Van Impe] [reply
Om te beginnen zou je al kunnen opmerken dat de parameters in sommige maanden positief zijn en in sommige maanden negatief. In sommige maanden is het resultaat dus beter dan in de referentiemaand, en in sommige maanden slechter. Maand 8 heeft het beste resultaat, want zij heeft het hoogste positieve resultaat. Maand 1 is de slechtste maand. Het gemiddelde van de voorspellingsfouten zou 0 moeten zijn, maar dat is hier dus niet het geval. Voor de rest is je uitleg bij de grafieken goed.
2008-11-30 13:20:52 [Steven Vercammen] [reply
Er wordt een goede analyse gemaakt van de gegevens. Het model is inderdaad wel verre van correct. Er is sprake van autocorrelatie,maw voorspelbaarheid op basis van het verleden. De uitleg zou iets uitgebreider mogen.
2008-12-01 17:45:16 [Toon Wouters] [reply
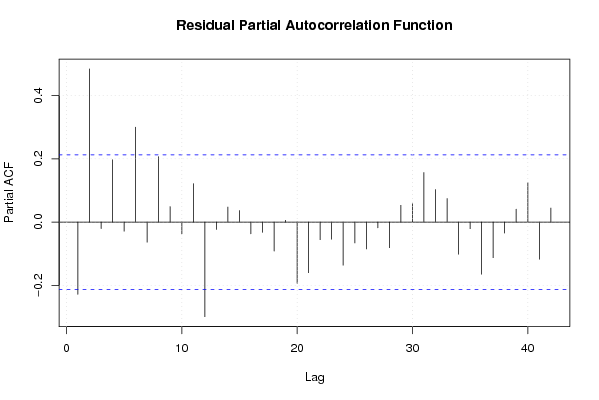
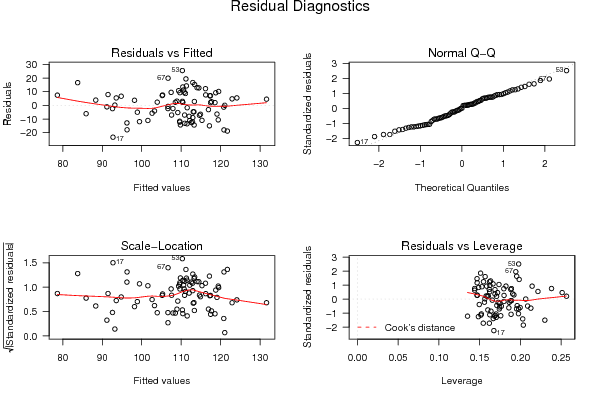
Goed berekend maar er missen enkele belangrijke interpretaties. Bij de 'Multiple Linear Regression - Ordinary Least Squares' tabel kon men nog zeggen dat men naar de 2zijde test moet zien omdat je niet weet welke gebeurtenis heeft plaatsgevonden dat een dummy 1 krijgt. En dus ook moeten zien naar de two-tailed p-value. Men kon hier uit concluderen dat een groot aantal maanden een grote p-waarde vertonen wat wil zeggen dat je bevindingen op toeval kunnen berusten. En als we naar de Adjusted R-square kijken, kunnen we niet echt zeggen dat dit een goed model is omdat we maar 39% van de schommelingen die zijn ontstaan door de gebeurtenis kunnen verklaren. Een perfecte verklaring wil zeggen dat de R-square gelijk is aan 1. Bij de voorspellingsfouten had men een horizontale rechte moeten trekken, vertrekkende vanuit 0. Hier kon men concluderen dat het gemiddelde van de voorspellingsfouten niet gelijke aan 0 en niet constant zijn. Als algemene conclusie kon je zeggen dat er aan de 2 assumpties niet voldaan is om een goed model te zijn: er is autocorrelatie aanwezig en de voorspellingsfouten zijn niet constant en niet gelijk aan 0

Post a new message
Dataseries X:
78.40	       97.80
114.60	107.40
113.30	117.50
117.00	105.60
99.60	        97.40
99.40	        99.50
101.90	98.00
115.20	104.30
108.50	100.60
113.80	101.10
121.00	103.90
92.20	        96.90
90.20	        95.50
101.50	108.40
126.60	117.00
93.90	        103.80
89.80	        100.80
93.40	        110.60
101.50	104.00
110.40	112.60
105.90	107.30
108.40	98.90
113.90	109.80
86.10	        104.90
69.40	        102.20
101.20	123.90
100.50	124.90
98.00	        112.70
106.60	121.90
90.10	        100.60
96.90	        104.30
125.90	120.40
112.00	107.50
100.00	102.90
123.90	125.60
79.80	        107.50
83.40	        108.80
113.60	128.40
112.90	121.10
104.00	119.50
109.90	128.70
99.00	        108.70
106.30	105.50
128.90	119.80
111.10	111.30
102.90	110.60
130.00	120.10
87.00	        97.50
87.50	        107.70
117.60	127.30
103.40	117.20
110.80	119.80
112.60	116.20
102.50	111.00
112.40	112.40
135.60	130.60
105.10	109.10
127.70	118.80
137.00	123.90
91.00	        101.60
90.50	        112.80
122.40	128.00
123.30	129.60
124.30	125.80
120.00	119.50
118.10	115.70
119.00	113.60
142.70	129.70
123.60	112.00
129.60	116.80
151.60	127.00
110.40	112.10
99.20	        114.20
130.50	121.10
136.20	131.60
129.70	125.00
128.00	120.40
121.60	117.70
135.80	117.50
143.80	120.60
147.50	127.50
136.20	112.30
156.60	124.50
123.30	115.20
100.40	105.40


Summary of computational transaction
Raw Inputview raw input (R code)
Raw Outputview raw output of R engine
Computing time3 seconds
R Server'Gwilym Jenkins' @ 72.249.127.135

\begin{tabular}{lllllllll}
\hline
Summary of computational transaction \tabularnewline
Raw Input & view raw input (R code)  \tabularnewline
Raw Output & view raw output of R engine  \tabularnewline
Computing time & 3 seconds \tabularnewline
R Server & 'Gwilym Jenkins' @ 72.249.127.135 \tabularnewline
\hline
\end{tabular}
%Source: https://freestatistics.org/blog/index.php?pk=25841&T=0

[TABLE]
[ROW][C]Summary of computational transaction[/C][/ROW]
[ROW][C]Raw Input[/C][C]view raw input (R code) [/C][/ROW]
[ROW][C]Raw Output[/C][C]view raw output of R engine [/C][/ROW]
[ROW][C]Computing time[/C][C]3 seconds[/C][/ROW]
[ROW][C]R Server[/C][C]'Gwilym Jenkins' @ 72.249.127.135[/C][/ROW]
[/TABLE]
Source: https://freestatistics.org/blog/index.php?pk=25841&T=0

Globally Unique Identifier (entire table): ba.freestatistics.org/blog/index.php?pk=25841&T=0

As an alternative you can also use a QR Code:  

The GUIDs for individual cells are displayed in the table below:

Summary of computational transaction
Raw Inputview raw input (R code)
Raw Outputview raw output of R engine
Computing time3 seconds
R Server'Gwilym Jenkins' @ 72.249.127.135


Multiple Linear Regression - Estimated Regression Equation
investerings[t] = + 66.1505894651654 + 0.025180716423023consumptie[t] + 0.400773220002877V3[t] -18.2608604869474M1[t] -1.45328247179579M2[t] -1.27651989429140M3[t] + 1.11405923780997M4[t] -16.6343188842857M5[t] -2.58000142953887M6[t] -0.294549633253951M7[t] + 1.80960814707014M8[t] -16.678029531183M9[t] -1.36461534589584M10[t] -5.89777655442444M11[t] + 0.00368835171866561t + e[t]

\begin{tabular}{lllllllll}
\hline
Multiple Linear Regression - Estimated Regression Equation \tabularnewline
investerings[t] =  +  66.1505894651654 +  0.025180716423023consumptie[t] +  0.400773220002877V3[t] -18.2608604869474M1[t] -1.45328247179579M2[t] -1.27651989429140M3[t] +  1.11405923780997M4[t] -16.6343188842857M5[t] -2.58000142953887M6[t] -0.294549633253951M7[t] +  1.80960814707014M8[t] -16.678029531183M9[t] -1.36461534589584M10[t] -5.89777655442444M11[t] +  0.00368835171866561t  + e[t] \tabularnewline
\hline
\end{tabular}
%Source: https://freestatistics.org/blog/index.php?pk=25841&T=1

[TABLE]
[ROW][C]Multiple Linear Regression - Estimated Regression Equation[/C][/ROW]
[ROW][C]investerings[t] =  +  66.1505894651654 +  0.025180716423023consumptie[t] +  0.400773220002877V3[t] -18.2608604869474M1[t] -1.45328247179579M2[t] -1.27651989429140M3[t] +  1.11405923780997M4[t] -16.6343188842857M5[t] -2.58000142953887M6[t] -0.294549633253951M7[t] +  1.80960814707014M8[t] -16.678029531183M9[t] -1.36461534589584M10[t] -5.89777655442444M11[t] +  0.00368835171866561t  + e[t][/C][/ROW]
[/TABLE]
Source: https://freestatistics.org/blog/index.php?pk=25841&T=1

Globally Unique Identifier (entire table): ba.freestatistics.org/blog/index.php?pk=25841&T=1

As an alternative you can also use a QR Code:  

The GUIDs for individual cells are displayed in the table below:

Multiple Linear Regression - Estimated Regression Equation
investerings[t] = + 66.1505894651654 + 0.025180716423023consumptie[t] + 0.400773220002877V3[t] -18.2608604869474M1[t] -1.45328247179579M2[t] -1.27651989429140M3[t] + 1.11405923780997M4[t] -16.6343188842857M5[t] -2.58000142953887M6[t] -0.294549633253951M7[t] + 1.80960814707014M8[t] -16.678029531183M9[t] -1.36461534589584M10[t] -5.89777655442444M11[t] + 0.00368835171866561t + e[t]


Multiple Linear Regression - Ordinary Least Squares
VariableParameterS.D.T-STATH0: parameter = 02-tail p-value1-tail p-value
(Intercept)66.150589465165414.1130094.68721.3e-057e-06
consumptie0.0251807164230230.1406320.17910.8584120.429206
V30.4007732200028770.0925344.33114.9e-052.4e-05
M1-18.26086048694745.927365-3.08080.002950.001475
M2-1.453282471795796.311027-0.23030.8185480.409274
M3-1.276519894291406.330316-0.20170.8407740.420387
M41.114059237809976.1012130.18260.8556430.427821
M5-16.63431888428576.093701-2.72980.0080110.004005
M6-2.580001429538876.435418-0.40090.689710.344855
M7-0.2945496332539516.252135-0.04710.9625580.481279
M81.809608147070146.088160.29720.7671680.383584
M9-16.6780295311836.132893-2.71940.008240.00412
M10-1.364615345895846.330505-0.21560.8299560.414978
M11-5.897776554424446.241581-0.94490.3479510.173976
t0.003688351718665610.0553550.06660.9470660.473533

\begin{tabular}{lllllllll}
\hline
Multiple Linear Regression - Ordinary Least Squares \tabularnewline
Variable & Parameter & S.D. & T-STATH0: parameter = 0 & 2-tail p-value & 1-tail p-value \tabularnewline
(Intercept) & 66.1505894651654 & 14.113009 & 4.6872 & 1.3e-05 & 7e-06 \tabularnewline
consumptie & 0.025180716423023 & 0.140632 & 0.1791 & 0.858412 & 0.429206 \tabularnewline
V3 & 0.400773220002877 & 0.092534 & 4.3311 & 4.9e-05 & 2.4e-05 \tabularnewline
M1 & -18.2608604869474 & 5.927365 & -3.0808 & 0.00295 & 0.001475 \tabularnewline
M2 & -1.45328247179579 & 6.311027 & -0.2303 & 0.818548 & 0.409274 \tabularnewline
M3 & -1.27651989429140 & 6.330316 & -0.2017 & 0.840774 & 0.420387 \tabularnewline
M4 & 1.11405923780997 & 6.101213 & 0.1826 & 0.855643 & 0.427821 \tabularnewline
M5 & -16.6343188842857 & 6.093701 & -2.7298 & 0.008011 & 0.004005 \tabularnewline
M6 & -2.58000142953887 & 6.435418 & -0.4009 & 0.68971 & 0.344855 \tabularnewline
M7 & -0.294549633253951 & 6.252135 & -0.0471 & 0.962558 & 0.481279 \tabularnewline
M8 & 1.80960814707014 & 6.08816 & 0.2972 & 0.767168 & 0.383584 \tabularnewline
M9 & -16.678029531183 & 6.132893 & -2.7194 & 0.00824 & 0.00412 \tabularnewline
M10 & -1.36461534589584 & 6.330505 & -0.2156 & 0.829956 & 0.414978 \tabularnewline
M11 & -5.89777655442444 & 6.241581 & -0.9449 & 0.347951 & 0.173976 \tabularnewline
t & 0.00368835171866561 & 0.055355 & 0.0666 & 0.947066 & 0.473533 \tabularnewline
\hline
\end{tabular}
%Source: https://freestatistics.org/blog/index.php?pk=25841&T=2

[TABLE]
[ROW][C]Multiple Linear Regression - Ordinary Least Squares[/C][/ROW]
[ROW][C]Variable[/C][C]Parameter[/C][C]S.D.[/C][C]T-STATH0: parameter = 0[/C][C]2-tail p-value[/C][C]1-tail p-value[/C][/ROW]
[ROW][C](Intercept)[/C][C]66.1505894651654[/C][C]14.113009[/C][C]4.6872[/C][C]1.3e-05[/C][C]7e-06[/C][/ROW]
[ROW][C]consumptie[/C][C]0.025180716423023[/C][C]0.140632[/C][C]0.1791[/C][C]0.858412[/C][C]0.429206[/C][/ROW]
[ROW][C]V3[/C][C]0.400773220002877[/C][C]0.092534[/C][C]4.3311[/C][C]4.9e-05[/C][C]2.4e-05[/C][/ROW]
[ROW][C]M1[/C][C]-18.2608604869474[/C][C]5.927365[/C][C]-3.0808[/C][C]0.00295[/C][C]0.001475[/C][/ROW]
[ROW][C]M2[/C][C]-1.45328247179579[/C][C]6.311027[/C][C]-0.2303[/C][C]0.818548[/C][C]0.409274[/C][/ROW]
[ROW][C]M3[/C][C]-1.27651989429140[/C][C]6.330316[/C][C]-0.2017[/C][C]0.840774[/C][C]0.420387[/C][/ROW]
[ROW][C]M4[/C][C]1.11405923780997[/C][C]6.101213[/C][C]0.1826[/C][C]0.855643[/C][C]0.427821[/C][/ROW]
[ROW][C]M5[/C][C]-16.6343188842857[/C][C]6.093701[/C][C]-2.7298[/C][C]0.008011[/C][C]0.004005[/C][/ROW]
[ROW][C]M6[/C][C]-2.58000142953887[/C][C]6.435418[/C][C]-0.4009[/C][C]0.68971[/C][C]0.344855[/C][/ROW]
[ROW][C]M7[/C][C]-0.294549633253951[/C][C]6.252135[/C][C]-0.0471[/C][C]0.962558[/C][C]0.481279[/C][/ROW]
[ROW][C]M8[/C][C]1.80960814707014[/C][C]6.08816[/C][C]0.2972[/C][C]0.767168[/C][C]0.383584[/C][/ROW]
[ROW][C]M9[/C][C]-16.678029531183[/C][C]6.132893[/C][C]-2.7194[/C][C]0.00824[/C][C]0.00412[/C][/ROW]
[ROW][C]M10[/C][C]-1.36461534589584[/C][C]6.330505[/C][C]-0.2156[/C][C]0.829956[/C][C]0.414978[/C][/ROW]
[ROW][C]M11[/C][C]-5.89777655442444[/C][C]6.241581[/C][C]-0.9449[/C][C]0.347951[/C][C]0.173976[/C][/ROW]
[ROW][C]t[/C][C]0.00368835171866561[/C][C]0.055355[/C][C]0.0666[/C][C]0.947066[/C][C]0.473533[/C][/ROW]
[/TABLE]
Source: https://freestatistics.org/blog/index.php?pk=25841&T=2

Globally Unique Identifier (entire table): ba.freestatistics.org/blog/index.php?pk=25841&T=2

As an alternative you can also use a QR Code:  

The GUIDs for individual cells are displayed in the table below:

Multiple Linear Regression - Ordinary Least Squares
VariableParameterS.D.T-STATH0: parameter = 02-tail p-value1-tail p-value
(Intercept)66.150589465165414.1130094.68721.3e-057e-06
consumptie0.0251807164230230.1406320.17910.8584120.429206
V30.4007732200028770.0925344.33114.9e-052.4e-05
M1-18.26086048694745.927365-3.08080.002950.001475
M2-1.453282471795796.311027-0.23030.8185480.409274
M3-1.276519894291406.330316-0.20170.8407740.420387
M41.114059237809976.1012130.18260.8556430.427821
M5-16.63431888428576.093701-2.72980.0080110.004005
M6-2.580001429538876.435418-0.40090.689710.344855
M7-0.2945496332539516.252135-0.04710.9625580.481279
M81.809608147070146.088160.29720.7671680.383584
M9-16.6780295311836.132893-2.71940.008240.00412
M10-1.364615345895846.330505-0.21560.8299560.414978
M11-5.897776554424446.241581-0.94490.3479510.173976
t0.003688351718665610.0553550.06660.9470660.473533


Multiple Linear Regression - Regression Statistics
Multiple R0.68955263982766
R-squared0.475482843093295
Adjusted R-squared0.370579411711954
F-TEST (value)4.53257664532286
F-TEST (DF numerator)14
F-TEST (DF denominator)70
p-value9.81164605140528e-06
Multiple Linear Regression - Residual Statistics
Residual Standard Deviation11.3278128582093
Sum Squared Residuals8982.3540905429

\begin{tabular}{lllllllll}
\hline
Multiple Linear Regression - Regression Statistics \tabularnewline
Multiple R & 0.68955263982766 \tabularnewline
R-squared & 0.475482843093295 \tabularnewline
Adjusted R-squared & 0.370579411711954 \tabularnewline
F-TEST (value) & 4.53257664532286 \tabularnewline
F-TEST (DF numerator) & 14 \tabularnewline
F-TEST (DF denominator) & 70 \tabularnewline
p-value & 9.81164605140528e-06 \tabularnewline
Multiple Linear Regression - Residual Statistics \tabularnewline
Residual Standard Deviation & 11.3278128582093 \tabularnewline
Sum Squared Residuals & 8982.3540905429 \tabularnewline
\hline
\end{tabular}
%Source: https://freestatistics.org/blog/index.php?pk=25841&T=3

[TABLE]
[ROW][C]Multiple Linear Regression - Regression Statistics[/C][/ROW]
[ROW][C]Multiple R[/C][C]0.68955263982766[/C][/ROW]
[ROW][C]R-squared[/C][C]0.475482843093295[/C][/ROW]
[ROW][C]Adjusted R-squared[/C][C]0.370579411711954[/C][/ROW]
[ROW][C]F-TEST (value)[/C][C]4.53257664532286[/C][/ROW]
[ROW][C]F-TEST (DF numerator)[/C][C]14[/C][/ROW]
[ROW][C]F-TEST (DF denominator)[/C][C]70[/C][/ROW]
[ROW][C]p-value[/C][C]9.81164605140528e-06[/C][/ROW]
[ROW][C]Multiple Linear Regression - Residual Statistics[/C][/ROW]
[ROW][C]Residual Standard Deviation[/C][C]11.3278128582093[/C][/ROW]
[ROW][C]Sum Squared Residuals[/C][C]8982.3540905429[/C][/ROW]
[/TABLE]
Source: https://freestatistics.org/blog/index.php?pk=25841&T=3

Globally Unique Identifier (entire table): ba.freestatistics.org/blog/index.php?pk=25841&T=3

As an alternative you can also use a QR Code:  

The GUIDs for individual cells are displayed in the table below:

Multiple Linear Regression - Regression Statistics
Multiple R0.68955263982766
R-squared0.475482843093295
Adjusted R-squared0.370579411711954
F-TEST (value)4.53257664532286
F-TEST (DF numerator)14
F-TEST (DF denominator)70
p-value9.81164605140528e-06
Multiple Linear Regression - Residual Statistics
Residual Standard Deviation11.3278128582093
Sum Squared Residuals8982.3540905429


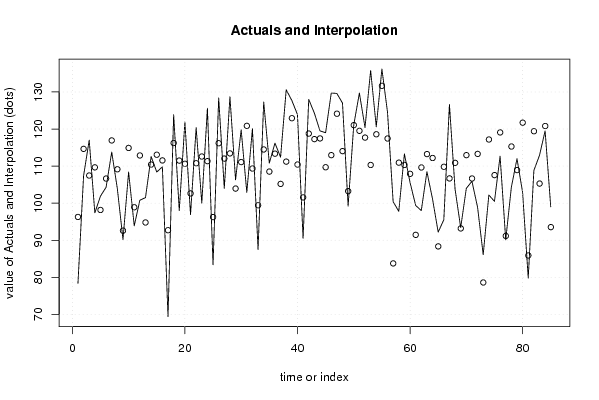
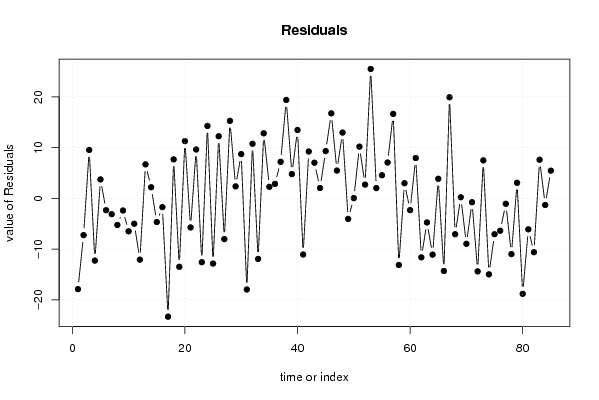
Multiple Linear Regression - Actuals, Interpolation, and Residuals
Time or IndexActualsInterpolationForecastResidualsPrediction Error
178.496.2847024084382-17.8847024084382
2107.4114.648512217873-7.24851221787348
3117107.4612309925889.53876900741221
497.4109.659300712585-12.2593007125848
5101.998.17149749326073.72850250673928
6104.3106.642611810126-2.34261181012595
7113.8116.921188344658-3.12118834465784
8103.9109.146291498466-5.24629149846637
990.292.5889953481411-2.38899534814111
10108.4114.901203075948-6.50120307594754
1193.998.8965783006144-4.99657830061442
12100.8112.872246732018-12.0722467320179
13101.594.80183554687276.69816445312733
14112.6110.4185482929382.18145170706224
15108.4113.067837459219-4.66783745921864
16109.8111.532832792798-1.73283279279809
1769.492.7106916428211-23.3106916428211
18123.9116.2242155454367.67578445456435
1998111.486410507747-13.4864105077475
20121.9110.62053312861311.2794668713874
2196.9102.633712441358-5.73371244135788
22120.4110.7704792467689.62952075323195
23100112.584542678556-12.5845426785558
24125.6111.33165222728014.2683477727201
2583.496.2494375103364-12.8494375103364
26128.4116.16974396456312.2302560354374
27104112.027727558145-8.0277275581454
28128.7113.4248624912915.2751375087100
29106.3103.9394664217212.36053357827921
30119.8111.0848755681058.71512443189544
31102.9120.855884571950-17.9558845719504
32120.1109.34433614631610.7556638536836
3387.599.4371693717963-11.9371693717963
34127.3114.48568554018212.8143144598180
35110.8108.5256196206962.27438037930364
36116.2113.3502209807172.84977901928344
37112.4105.2013591501477.19864084985348
38130.6111.20831595705219.3916840429475
39127.7122.9153155393514.78468446064877
40123.9110.42218711850913.4778128814906
4190.5101.562519942214-11.0625199422142
42128118.7704904551429.22950954485792
43124.3117.2751594821767.0248405178244
44119.5117.4657892517492.03421074825129
45119109.6894036413889.3105963586117
46129.7112.95457548853616.7454245114639
47129.6124.1244932721635.47550672783653
48127114.03425940308612.9657405969144
4999.2103.247001238317-4.04700123831729
50121.1121.0530939084970.0469060915027699
51129.7119.50873722177210.1912627782279
52120.4117.6894261037242.71057389627581
53135.8110.30167643808825.4983235619121
54120.6118.5825002511972.01749974880282
55136.2131.6477798831944.55222011680593
56124.5117.4406025877717.05939741222901
57100.483.757463941158516.6425360588415
5897.8110.928652449340-13.1286524493396
59113.3110.3196265821842.98037341781596
60105.6107.915201552299-2.31520155229865
6199.491.45899083544067.94100916455944
6298109.627450178159-11.6274501781592
63108.5113.247608237633-4.74760823763344
64101.1112.187907458455-11.0879074584547
6592.288.34576930824343.85423069175658
6695.5109.813679014307-14.3136790143072
67126.6106.68190857682619.9180914231741
68103.8110.870174440182-7.07017444018227
6993.493.19052526924870.209474730751319
70104112.951174405002-8.95117440500184
71105.9106.660393803268-0.760393803268446
7298.9113.289133945808-14.3891339458075
7386.178.61409727465547.48590272534461
74102.2117.174335480917-14.9743354809172
75100.5107.571542991291-7.07154299129144
76112.7119.083483322639-6.3834833226389
7790.191.1683787536519-1.06837875365188
78104.3115.281627355687-10.9816273556874
79112108.9316686334493.0683313665513
80102.9121.712272946903-18.8122729469027
8179.885.9027299869092-6.10272998690924
82108.8119.408229794225-10.6082297942250
83112.9105.2887457425177.6112542574825
84119.5120.807285158794-1.30728515879380
859993.5425760357935.457423964207

\begin{tabular}{lllllllll}
\hline
Multiple Linear Regression - Actuals, Interpolation, and Residuals \tabularnewline
Time or Index & Actuals & InterpolationForecast & ResidualsPrediction Error \tabularnewline
1 & 78.4 & 96.2847024084382 & -17.8847024084382 \tabularnewline
2 & 107.4 & 114.648512217873 & -7.24851221787348 \tabularnewline
3 & 117 & 107.461230992588 & 9.53876900741221 \tabularnewline
4 & 97.4 & 109.659300712585 & -12.2593007125848 \tabularnewline
5 & 101.9 & 98.1714974932607 & 3.72850250673928 \tabularnewline
6 & 104.3 & 106.642611810126 & -2.34261181012595 \tabularnewline
7 & 113.8 & 116.921188344658 & -3.12118834465784 \tabularnewline
8 & 103.9 & 109.146291498466 & -5.24629149846637 \tabularnewline
9 & 90.2 & 92.5889953481411 & -2.38899534814111 \tabularnewline
10 & 108.4 & 114.901203075948 & -6.50120307594754 \tabularnewline
11 & 93.9 & 98.8965783006144 & -4.99657830061442 \tabularnewline
12 & 100.8 & 112.872246732018 & -12.0722467320179 \tabularnewline
13 & 101.5 & 94.8018355468727 & 6.69816445312733 \tabularnewline
14 & 112.6 & 110.418548292938 & 2.18145170706224 \tabularnewline
15 & 108.4 & 113.067837459219 & -4.66783745921864 \tabularnewline
16 & 109.8 & 111.532832792798 & -1.73283279279809 \tabularnewline
17 & 69.4 & 92.7106916428211 & -23.3106916428211 \tabularnewline
18 & 123.9 & 116.224215545436 & 7.67578445456435 \tabularnewline
19 & 98 & 111.486410507747 & -13.4864105077475 \tabularnewline
20 & 121.9 & 110.620533128613 & 11.2794668713874 \tabularnewline
21 & 96.9 & 102.633712441358 & -5.73371244135788 \tabularnewline
22 & 120.4 & 110.770479246768 & 9.62952075323195 \tabularnewline
23 & 100 & 112.584542678556 & -12.5845426785558 \tabularnewline
24 & 125.6 & 111.331652227280 & 14.2683477727201 \tabularnewline
25 & 83.4 & 96.2494375103364 & -12.8494375103364 \tabularnewline
26 & 128.4 & 116.169743964563 & 12.2302560354374 \tabularnewline
27 & 104 & 112.027727558145 & -8.0277275581454 \tabularnewline
28 & 128.7 & 113.42486249129 & 15.2751375087100 \tabularnewline
29 & 106.3 & 103.939466421721 & 2.36053357827921 \tabularnewline
30 & 119.8 & 111.084875568105 & 8.71512443189544 \tabularnewline
31 & 102.9 & 120.855884571950 & -17.9558845719504 \tabularnewline
32 & 120.1 & 109.344336146316 & 10.7556638536836 \tabularnewline
33 & 87.5 & 99.4371693717963 & -11.9371693717963 \tabularnewline
34 & 127.3 & 114.485685540182 & 12.8143144598180 \tabularnewline
35 & 110.8 & 108.525619620696 & 2.27438037930364 \tabularnewline
36 & 116.2 & 113.350220980717 & 2.84977901928344 \tabularnewline
37 & 112.4 & 105.201359150147 & 7.19864084985348 \tabularnewline
38 & 130.6 & 111.208315957052 & 19.3916840429475 \tabularnewline
39 & 127.7 & 122.915315539351 & 4.78468446064877 \tabularnewline
40 & 123.9 & 110.422187118509 & 13.4778128814906 \tabularnewline
41 & 90.5 & 101.562519942214 & -11.0625199422142 \tabularnewline
42 & 128 & 118.770490455142 & 9.22950954485792 \tabularnewline
43 & 124.3 & 117.275159482176 & 7.0248405178244 \tabularnewline
44 & 119.5 & 117.465789251749 & 2.03421074825129 \tabularnewline
45 & 119 & 109.689403641388 & 9.3105963586117 \tabularnewline
46 & 129.7 & 112.954575488536 & 16.7454245114639 \tabularnewline
47 & 129.6 & 124.124493272163 & 5.47550672783653 \tabularnewline
48 & 127 & 114.034259403086 & 12.9657405969144 \tabularnewline
49 & 99.2 & 103.247001238317 & -4.04700123831729 \tabularnewline
50 & 121.1 & 121.053093908497 & 0.0469060915027699 \tabularnewline
51 & 129.7 & 119.508737221772 & 10.1912627782279 \tabularnewline
52 & 120.4 & 117.689426103724 & 2.71057389627581 \tabularnewline
53 & 135.8 & 110.301676438088 & 25.4983235619121 \tabularnewline
54 & 120.6 & 118.582500251197 & 2.01749974880282 \tabularnewline
55 & 136.2 & 131.647779883194 & 4.55222011680593 \tabularnewline
56 & 124.5 & 117.440602587771 & 7.05939741222901 \tabularnewline
57 & 100.4 & 83.7574639411585 & 16.6425360588415 \tabularnewline
58 & 97.8 & 110.928652449340 & -13.1286524493396 \tabularnewline
59 & 113.3 & 110.319626582184 & 2.98037341781596 \tabularnewline
60 & 105.6 & 107.915201552299 & -2.31520155229865 \tabularnewline
61 & 99.4 & 91.4589908354406 & 7.94100916455944 \tabularnewline
62 & 98 & 109.627450178159 & -11.6274501781592 \tabularnewline
63 & 108.5 & 113.247608237633 & -4.74760823763344 \tabularnewline
64 & 101.1 & 112.187907458455 & -11.0879074584547 \tabularnewline
65 & 92.2 & 88.3457693082434 & 3.85423069175658 \tabularnewline
66 & 95.5 & 109.813679014307 & -14.3136790143072 \tabularnewline
67 & 126.6 & 106.681908576826 & 19.9180914231741 \tabularnewline
68 & 103.8 & 110.870174440182 & -7.07017444018227 \tabularnewline
69 & 93.4 & 93.1905252692487 & 0.209474730751319 \tabularnewline
70 & 104 & 112.951174405002 & -8.95117440500184 \tabularnewline
71 & 105.9 & 106.660393803268 & -0.760393803268446 \tabularnewline
72 & 98.9 & 113.289133945808 & -14.3891339458075 \tabularnewline
73 & 86.1 & 78.6140972746554 & 7.48590272534461 \tabularnewline
74 & 102.2 & 117.174335480917 & -14.9743354809172 \tabularnewline
75 & 100.5 & 107.571542991291 & -7.07154299129144 \tabularnewline
76 & 112.7 & 119.083483322639 & -6.3834833226389 \tabularnewline
77 & 90.1 & 91.1683787536519 & -1.06837875365188 \tabularnewline
78 & 104.3 & 115.281627355687 & -10.9816273556874 \tabularnewline
79 & 112 & 108.931668633449 & 3.0683313665513 \tabularnewline
80 & 102.9 & 121.712272946903 & -18.8122729469027 \tabularnewline
81 & 79.8 & 85.9027299869092 & -6.10272998690924 \tabularnewline
82 & 108.8 & 119.408229794225 & -10.6082297942250 \tabularnewline
83 & 112.9 & 105.288745742517 & 7.6112542574825 \tabularnewline
84 & 119.5 & 120.807285158794 & -1.30728515879380 \tabularnewline
85 & 99 & 93.542576035793 & 5.457423964207 \tabularnewline
\hline
\end{tabular}
%Source: https://freestatistics.org/blog/index.php?pk=25841&T=4

[TABLE]
[ROW][C]Multiple Linear Regression - Actuals, Interpolation, and Residuals[/C][/ROW]
[ROW][C]Time or Index[/C][C]Actuals[/C][C]InterpolationForecast[/C][C]ResidualsPrediction Error[/C][/ROW]
[ROW][C]1[/C][C]78.4[/C][C]96.2847024084382[/C][C]-17.8847024084382[/C][/ROW]
[ROW][C]2[/C][C]107.4[/C][C]114.648512217873[/C][C]-7.24851221787348[/C][/ROW]
[ROW][C]3[/C][C]117[/C][C]107.461230992588[/C][C]9.53876900741221[/C][/ROW]
[ROW][C]4[/C][C]97.4[/C][C]109.659300712585[/C][C]-12.2593007125848[/C][/ROW]
[ROW][C]5[/C][C]101.9[/C][C]98.1714974932607[/C][C]3.72850250673928[/C][/ROW]
[ROW][C]6[/C][C]104.3[/C][C]106.642611810126[/C][C]-2.34261181012595[/C][/ROW]
[ROW][C]7[/C][C]113.8[/C][C]116.921188344658[/C][C]-3.12118834465784[/C][/ROW]
[ROW][C]8[/C][C]103.9[/C][C]109.146291498466[/C][C]-5.24629149846637[/C][/ROW]
[ROW][C]9[/C][C]90.2[/C][C]92.5889953481411[/C][C]-2.38899534814111[/C][/ROW]
[ROW][C]10[/C][C]108.4[/C][C]114.901203075948[/C][C]-6.50120307594754[/C][/ROW]
[ROW][C]11[/C][C]93.9[/C][C]98.8965783006144[/C][C]-4.99657830061442[/C][/ROW]
[ROW][C]12[/C][C]100.8[/C][C]112.872246732018[/C][C]-12.0722467320179[/C][/ROW]
[ROW][C]13[/C][C]101.5[/C][C]94.8018355468727[/C][C]6.69816445312733[/C][/ROW]
[ROW][C]14[/C][C]112.6[/C][C]110.418548292938[/C][C]2.18145170706224[/C][/ROW]
[ROW][C]15[/C][C]108.4[/C][C]113.067837459219[/C][C]-4.66783745921864[/C][/ROW]
[ROW][C]16[/C][C]109.8[/C][C]111.532832792798[/C][C]-1.73283279279809[/C][/ROW]
[ROW][C]17[/C][C]69.4[/C][C]92.7106916428211[/C][C]-23.3106916428211[/C][/ROW]
[ROW][C]18[/C][C]123.9[/C][C]116.224215545436[/C][C]7.67578445456435[/C][/ROW]
[ROW][C]19[/C][C]98[/C][C]111.486410507747[/C][C]-13.4864105077475[/C][/ROW]
[ROW][C]20[/C][C]121.9[/C][C]110.620533128613[/C][C]11.2794668713874[/C][/ROW]
[ROW][C]21[/C][C]96.9[/C][C]102.633712441358[/C][C]-5.73371244135788[/C][/ROW]
[ROW][C]22[/C][C]120.4[/C][C]110.770479246768[/C][C]9.62952075323195[/C][/ROW]
[ROW][C]23[/C][C]100[/C][C]112.584542678556[/C][C]-12.5845426785558[/C][/ROW]
[ROW][C]24[/C][C]125.6[/C][C]111.331652227280[/C][C]14.2683477727201[/C][/ROW]
[ROW][C]25[/C][C]83.4[/C][C]96.2494375103364[/C][C]-12.8494375103364[/C][/ROW]
[ROW][C]26[/C][C]128.4[/C][C]116.169743964563[/C][C]12.2302560354374[/C][/ROW]
[ROW][C]27[/C][C]104[/C][C]112.027727558145[/C][C]-8.0277275581454[/C][/ROW]
[ROW][C]28[/C][C]128.7[/C][C]113.42486249129[/C][C]15.2751375087100[/C][/ROW]
[ROW][C]29[/C][C]106.3[/C][C]103.939466421721[/C][C]2.36053357827921[/C][/ROW]
[ROW][C]30[/C][C]119.8[/C][C]111.084875568105[/C][C]8.71512443189544[/C][/ROW]
[ROW][C]31[/C][C]102.9[/C][C]120.855884571950[/C][C]-17.9558845719504[/C][/ROW]
[ROW][C]32[/C][C]120.1[/C][C]109.344336146316[/C][C]10.7556638536836[/C][/ROW]
[ROW][C]33[/C][C]87.5[/C][C]99.4371693717963[/C][C]-11.9371693717963[/C][/ROW]
[ROW][C]34[/C][C]127.3[/C][C]114.485685540182[/C][C]12.8143144598180[/C][/ROW]
[ROW][C]35[/C][C]110.8[/C][C]108.525619620696[/C][C]2.27438037930364[/C][/ROW]
[ROW][C]36[/C][C]116.2[/C][C]113.350220980717[/C][C]2.84977901928344[/C][/ROW]
[ROW][C]37[/C][C]112.4[/C][C]105.201359150147[/C][C]7.19864084985348[/C][/ROW]
[ROW][C]38[/C][C]130.6[/C][C]111.208315957052[/C][C]19.3916840429475[/C][/ROW]
[ROW][C]39[/C][C]127.7[/C][C]122.915315539351[/C][C]4.78468446064877[/C][/ROW]
[ROW][C]40[/C][C]123.9[/C][C]110.422187118509[/C][C]13.4778128814906[/C][/ROW]
[ROW][C]41[/C][C]90.5[/C][C]101.562519942214[/C][C]-11.0625199422142[/C][/ROW]
[ROW][C]42[/C][C]128[/C][C]118.770490455142[/C][C]9.22950954485792[/C][/ROW]
[ROW][C]43[/C][C]124.3[/C][C]117.275159482176[/C][C]7.0248405178244[/C][/ROW]
[ROW][C]44[/C][C]119.5[/C][C]117.465789251749[/C][C]2.03421074825129[/C][/ROW]
[ROW][C]45[/C][C]119[/C][C]109.689403641388[/C][C]9.3105963586117[/C][/ROW]
[ROW][C]46[/C][C]129.7[/C][C]112.954575488536[/C][C]16.7454245114639[/C][/ROW]
[ROW][C]47[/C][C]129.6[/C][C]124.124493272163[/C][C]5.47550672783653[/C][/ROW]
[ROW][C]48[/C][C]127[/C][C]114.034259403086[/C][C]12.9657405969144[/C][/ROW]
[ROW][C]49[/C][C]99.2[/C][C]103.247001238317[/C][C]-4.04700123831729[/C][/ROW]
[ROW][C]50[/C][C]121.1[/C][C]121.053093908497[/C][C]0.0469060915027699[/C][/ROW]
[ROW][C]51[/C][C]129.7[/C][C]119.508737221772[/C][C]10.1912627782279[/C][/ROW]
[ROW][C]52[/C][C]120.4[/C][C]117.689426103724[/C][C]2.71057389627581[/C][/ROW]
[ROW][C]53[/C][C]135.8[/C][C]110.301676438088[/C][C]25.4983235619121[/C][/ROW]
[ROW][C]54[/C][C]120.6[/C][C]118.582500251197[/C][C]2.01749974880282[/C][/ROW]
[ROW][C]55[/C][C]136.2[/C][C]131.647779883194[/C][C]4.55222011680593[/C][/ROW]
[ROW][C]56[/C][C]124.5[/C][C]117.440602587771[/C][C]7.05939741222901[/C][/ROW]
[ROW][C]57[/C][C]100.4[/C][C]83.7574639411585[/C][C]16.6425360588415[/C][/ROW]
[ROW][C]58[/C][C]97.8[/C][C]110.928652449340[/C][C]-13.1286524493396[/C][/ROW]
[ROW][C]59[/C][C]113.3[/C][C]110.319626582184[/C][C]2.98037341781596[/C][/ROW]
[ROW][C]60[/C][C]105.6[/C][C]107.915201552299[/C][C]-2.31520155229865[/C][/ROW]
[ROW][C]61[/C][C]99.4[/C][C]91.4589908354406[/C][C]7.94100916455944[/C][/ROW]
[ROW][C]62[/C][C]98[/C][C]109.627450178159[/C][C]-11.6274501781592[/C][/ROW]
[ROW][C]63[/C][C]108.5[/C][C]113.247608237633[/C][C]-4.74760823763344[/C][/ROW]
[ROW][C]64[/C][C]101.1[/C][C]112.187907458455[/C][C]-11.0879074584547[/C][/ROW]
[ROW][C]65[/C][C]92.2[/C][C]88.3457693082434[/C][C]3.85423069175658[/C][/ROW]
[ROW][C]66[/C][C]95.5[/C][C]109.813679014307[/C][C]-14.3136790143072[/C][/ROW]
[ROW][C]67[/C][C]126.6[/C][C]106.681908576826[/C][C]19.9180914231741[/C][/ROW]
[ROW][C]68[/C][C]103.8[/C][C]110.870174440182[/C][C]-7.07017444018227[/C][/ROW]
[ROW][C]69[/C][C]93.4[/C][C]93.1905252692487[/C][C]0.209474730751319[/C][/ROW]
[ROW][C]70[/C][C]104[/C][C]112.951174405002[/C][C]-8.95117440500184[/C][/ROW]
[ROW][C]71[/C][C]105.9[/C][C]106.660393803268[/C][C]-0.760393803268446[/C][/ROW]
[ROW][C]72[/C][C]98.9[/C][C]113.289133945808[/C][C]-14.3891339458075[/C][/ROW]
[ROW][C]73[/C][C]86.1[/C][C]78.6140972746554[/C][C]7.48590272534461[/C][/ROW]
[ROW][C]74[/C][C]102.2[/C][C]117.174335480917[/C][C]-14.9743354809172[/C][/ROW]
[ROW][C]75[/C][C]100.5[/C][C]107.571542991291[/C][C]-7.07154299129144[/C][/ROW]
[ROW][C]76[/C][C]112.7[/C][C]119.083483322639[/C][C]-6.3834833226389[/C][/ROW]
[ROW][C]77[/C][C]90.1[/C][C]91.1683787536519[/C][C]-1.06837875365188[/C][/ROW]
[ROW][C]78[/C][C]104.3[/C][C]115.281627355687[/C][C]-10.9816273556874[/C][/ROW]
[ROW][C]79[/C][C]112[/C][C]108.931668633449[/C][C]3.0683313665513[/C][/ROW]
[ROW][C]80[/C][C]102.9[/C][C]121.712272946903[/C][C]-18.8122729469027[/C][/ROW]
[ROW][C]81[/C][C]79.8[/C][C]85.9027299869092[/C][C]-6.10272998690924[/C][/ROW]
[ROW][C]82[/C][C]108.8[/C][C]119.408229794225[/C][C]-10.6082297942250[/C][/ROW]
[ROW][C]83[/C][C]112.9[/C][C]105.288745742517[/C][C]7.6112542574825[/C][/ROW]
[ROW][C]84[/C][C]119.5[/C][C]120.807285158794[/C][C]-1.30728515879380[/C][/ROW]
[ROW][C]85[/C][C]99[/C][C]93.542576035793[/C][C]5.457423964207[/C][/ROW]
[/TABLE]
Source: https://freestatistics.org/blog/index.php?pk=25841&T=4

Globally Unique Identifier (entire table): ba.freestatistics.org/blog/index.php?pk=25841&T=4

As an alternative you can also use a QR Code:  

The GUIDs for individual cells are displayed in the table below:

Multiple Linear Regression - Actuals, Interpolation, and Residuals
Time or IndexActualsInterpolationForecastResidualsPrediction Error
178.496.2847024084382-17.8847024084382
2107.4114.648512217873-7.24851221787348
3117107.4612309925889.53876900741221
497.4109.659300712585-12.2593007125848
5101.998.17149749326073.72850250673928
6104.3106.642611810126-2.34261181012595
7113.8116.921188344658-3.12118834465784
8103.9109.146291498466-5.24629149846637
990.292.5889953481411-2.38899534814111
10108.4114.901203075948-6.50120307594754
1193.998.8965783006144-4.99657830061442
12100.8112.872246732018-12.0722467320179
13101.594.80183554687276.69816445312733
14112.6110.4185482929382.18145170706224
15108.4113.067837459219-4.66783745921864
16109.8111.532832792798-1.73283279279809
1769.492.7106916428211-23.3106916428211
18123.9116.2242155454367.67578445456435
1998111.486410507747-13.4864105077475
20121.9110.62053312861311.2794668713874
2196.9102.633712441358-5.73371244135788
22120.4110.7704792467689.62952075323195
23100112.584542678556-12.5845426785558
24125.6111.33165222728014.2683477727201
2583.496.2494375103364-12.8494375103364
26128.4116.16974396456312.2302560354374
27104112.027727558145-8.0277275581454
28128.7113.4248624912915.2751375087100
29106.3103.9394664217212.36053357827921
30119.8111.0848755681058.71512443189544
31102.9120.855884571950-17.9558845719504
32120.1109.34433614631610.7556638536836
3387.599.4371693717963-11.9371693717963
34127.3114.48568554018212.8143144598180
35110.8108.5256196206962.27438037930364
36116.2113.3502209807172.84977901928344
37112.4105.2013591501477.19864084985348
38130.6111.20831595705219.3916840429475
39127.7122.9153155393514.78468446064877
40123.9110.42218711850913.4778128814906
4190.5101.562519942214-11.0625199422142
42128118.7704904551429.22950954485792
43124.3117.2751594821767.0248405178244
44119.5117.4657892517492.03421074825129
45119109.6894036413889.3105963586117
46129.7112.95457548853616.7454245114639
47129.6124.1244932721635.47550672783653
48127114.03425940308612.9657405969144
4999.2103.247001238317-4.04700123831729
50121.1121.0530939084970.0469060915027699
51129.7119.50873722177210.1912627782279
52120.4117.6894261037242.71057389627581
53135.8110.30167643808825.4983235619121
54120.6118.5825002511972.01749974880282
55136.2131.6477798831944.55222011680593
56124.5117.4406025877717.05939741222901
57100.483.757463941158516.6425360588415
5897.8110.928652449340-13.1286524493396
59113.3110.3196265821842.98037341781596
60105.6107.915201552299-2.31520155229865
6199.491.45899083544067.94100916455944
6298109.627450178159-11.6274501781592
63108.5113.247608237633-4.74760823763344
64101.1112.187907458455-11.0879074584547
6592.288.34576930824343.85423069175658
6695.5109.813679014307-14.3136790143072
67126.6106.68190857682619.9180914231741
68103.8110.870174440182-7.07017444018227
6993.493.19052526924870.209474730751319
70104112.951174405002-8.95117440500184
71105.9106.660393803268-0.760393803268446
7298.9113.289133945808-14.3891339458075
7386.178.61409727465547.48590272534461
74102.2117.174335480917-14.9743354809172
75100.5107.571542991291-7.07154299129144
76112.7119.083483322639-6.3834833226389
7790.191.1683787536519-1.06837875365188
78104.3115.281627355687-10.9816273556874
79112108.9316686334493.0683313665513
80102.9121.712272946903-18.8122729469027
8179.885.9027299869092-6.10272998690924
82108.8119.408229794225-10.6082297942250
83112.9105.2887457425177.6112542574825
84119.5120.807285158794-1.30728515879380
859993.5425760357935.457423964207


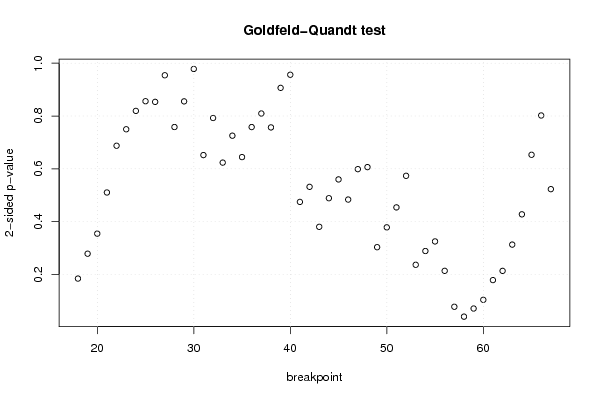
Goldfeld-Quandt test for Heteroskedasticity
p-valuesAlternative Hypothesis
breakpoint indexgreater2-sidedless
180.9079507447594770.1840985104810460.0920492552405229
190.8608622016546270.2782755966907450.139137798345373
200.8228582761941730.3542834476116540.177141723805827
210.7448697371551350.5102605256897310.255130262844865
220.6563287062853050.687342587429390.343671293714695
230.6250872767187850.7498254465624290.374912723281215
240.590308236845840.819383526308320.40969176315416
250.5719800458941230.8560399082117540.428019954105877
260.5732077674084290.8535844651831430.426792232591571
270.5227882825917450.954423434816510.477211717408255
280.6208948989243620.7582102021512770.379105101075638
290.5722646902704680.8554706194590640.427735309729532
300.4891571019896240.978314203979250.510842898010376
310.6740260453515870.6519479092968260.325973954648413
320.603764605253780.7924707894924390.396235394746219
330.6882731008698830.6234537982602340.311726899130117
340.6372597946921040.7254804106157920.362740205307896
350.6778005336216720.6443989327566560.322199466378328
360.6209303236189780.7581393527620440.379069676381022
370.5952243616483540.8095512767032920.404775638351646
380.6215966656915580.7568066686168840.378403334308442
390.546666452995890.906667094008220.45333354700411
400.5218290718628210.9563418562743580.478170928137179
410.76275345468510.4744930906297990.237246545314900
420.7341834132282740.5316331735434520.265816586771726
430.8099169421104980.3801661157790050.190083057889502
440.7557268447692350.488546310461530.244273155230765
450.7201307830805580.5597384338388840.279869216919442
460.7582854135810840.4834291728378320.241714586418916
470.7006695758187860.5986608483624290.299330424181214
480.6968023648815960.6063952702368080.303197635118404
490.8485197215062550.3029605569874900.151480278493745
500.81091882975110.3781623404978010.189081170248900
510.7731028859402050.4537942281195910.226897114059795
520.7132940739377140.5734118521245720.286705926062286
530.8818672930808420.2362654138383160.118132706919158
540.8558009745499180.2883980509001650.144199025450082
550.8376228997919390.3247542004161230.162377100208061
560.8933304294788150.2133391410423700.106669570521185
570.9614014543301340.07719709133973280.0385985456698664
580.9801253682368360.03974926352632820.0198746317631641
590.9647310532950540.07053789340989150.0352689467049457
600.948227314318680.1035453713626400.0517726856813199
610.9108320534070350.1783358931859300.0891679465929648
620.893386644697580.2132267106048400.106613355302420
630.8436176749585010.3127646500829980.156382325041499
640.7862485834821260.4275028330357490.213751416517874
650.6734548290697720.6530903418604560.326545170930228
660.5990059256274250.801988148745150.400994074372575
670.7385941444487630.5228117111024730.261405855551237

\begin{tabular}{lllllllll}
\hline
Goldfeld-Quandt test for Heteroskedasticity \tabularnewline
p-values & Alternative Hypothesis \tabularnewline
breakpoint index & greater & 2-sided & less \tabularnewline
18 & 0.907950744759477 & 0.184098510481046 & 0.0920492552405229 \tabularnewline
19 & 0.860862201654627 & 0.278275596690745 & 0.139137798345373 \tabularnewline
20 & 0.822858276194173 & 0.354283447611654 & 0.177141723805827 \tabularnewline
21 & 0.744869737155135 & 0.510260525689731 & 0.255130262844865 \tabularnewline
22 & 0.656328706285305 & 0.68734258742939 & 0.343671293714695 \tabularnewline
23 & 0.625087276718785 & 0.749825446562429 & 0.374912723281215 \tabularnewline
24 & 0.59030823684584 & 0.81938352630832 & 0.40969176315416 \tabularnewline
25 & 0.571980045894123 & 0.856039908211754 & 0.428019954105877 \tabularnewline
26 & 0.573207767408429 & 0.853584465183143 & 0.426792232591571 \tabularnewline
27 & 0.522788282591745 & 0.95442343481651 & 0.477211717408255 \tabularnewline
28 & 0.620894898924362 & 0.758210202151277 & 0.379105101075638 \tabularnewline
29 & 0.572264690270468 & 0.855470619459064 & 0.427735309729532 \tabularnewline
30 & 0.489157101989624 & 0.97831420397925 & 0.510842898010376 \tabularnewline
31 & 0.674026045351587 & 0.651947909296826 & 0.325973954648413 \tabularnewline
32 & 0.60376460525378 & 0.792470789492439 & 0.396235394746219 \tabularnewline
33 & 0.688273100869883 & 0.623453798260234 & 0.311726899130117 \tabularnewline
34 & 0.637259794692104 & 0.725480410615792 & 0.362740205307896 \tabularnewline
35 & 0.677800533621672 & 0.644398932756656 & 0.322199466378328 \tabularnewline
36 & 0.620930323618978 & 0.758139352762044 & 0.379069676381022 \tabularnewline
37 & 0.595224361648354 & 0.809551276703292 & 0.404775638351646 \tabularnewline
38 & 0.621596665691558 & 0.756806668616884 & 0.378403334308442 \tabularnewline
39 & 0.54666645299589 & 0.90666709400822 & 0.45333354700411 \tabularnewline
40 & 0.521829071862821 & 0.956341856274358 & 0.478170928137179 \tabularnewline
41 & 0.7627534546851 & 0.474493090629799 & 0.237246545314900 \tabularnewline
42 & 0.734183413228274 & 0.531633173543452 & 0.265816586771726 \tabularnewline
43 & 0.809916942110498 & 0.380166115779005 & 0.190083057889502 \tabularnewline
44 & 0.755726844769235 & 0.48854631046153 & 0.244273155230765 \tabularnewline
45 & 0.720130783080558 & 0.559738433838884 & 0.279869216919442 \tabularnewline
46 & 0.758285413581084 & 0.483429172837832 & 0.241714586418916 \tabularnewline
47 & 0.700669575818786 & 0.598660848362429 & 0.299330424181214 \tabularnewline
48 & 0.696802364881596 & 0.606395270236808 & 0.303197635118404 \tabularnewline
49 & 0.848519721506255 & 0.302960556987490 & 0.151480278493745 \tabularnewline
50 & 0.8109188297511 & 0.378162340497801 & 0.189081170248900 \tabularnewline
51 & 0.773102885940205 & 0.453794228119591 & 0.226897114059795 \tabularnewline
52 & 0.713294073937714 & 0.573411852124572 & 0.286705926062286 \tabularnewline
53 & 0.881867293080842 & 0.236265413838316 & 0.118132706919158 \tabularnewline
54 & 0.855800974549918 & 0.288398050900165 & 0.144199025450082 \tabularnewline
55 & 0.837622899791939 & 0.324754200416123 & 0.162377100208061 \tabularnewline
56 & 0.893330429478815 & 0.213339141042370 & 0.106669570521185 \tabularnewline
57 & 0.961401454330134 & 0.0771970913397328 & 0.0385985456698664 \tabularnewline
58 & 0.980125368236836 & 0.0397492635263282 & 0.0198746317631641 \tabularnewline
59 & 0.964731053295054 & 0.0705378934098915 & 0.0352689467049457 \tabularnewline
60 & 0.94822731431868 & 0.103545371362640 & 0.0517726856813199 \tabularnewline
61 & 0.910832053407035 & 0.178335893185930 & 0.0891679465929648 \tabularnewline
62 & 0.89338664469758 & 0.213226710604840 & 0.106613355302420 \tabularnewline
63 & 0.843617674958501 & 0.312764650082998 & 0.156382325041499 \tabularnewline
64 & 0.786248583482126 & 0.427502833035749 & 0.213751416517874 \tabularnewline
65 & 0.673454829069772 & 0.653090341860456 & 0.326545170930228 \tabularnewline
66 & 0.599005925627425 & 0.80198814874515 & 0.400994074372575 \tabularnewline
67 & 0.738594144448763 & 0.522811711102473 & 0.261405855551237 \tabularnewline
\hline
\end{tabular}
%Source: https://freestatistics.org/blog/index.php?pk=25841&T=5

[TABLE]
[ROW][C]Goldfeld-Quandt test for Heteroskedasticity[/C][/ROW]
[ROW][C]p-values[/C][C]Alternative Hypothesis[/C][/ROW]
[ROW][C]breakpoint index[/C][C]greater[/C][C]2-sided[/C][C]less[/C][/ROW]
[ROW][C]18[/C][C]0.907950744759477[/C][C]0.184098510481046[/C][C]0.0920492552405229[/C][/ROW]
[ROW][C]19[/C][C]0.860862201654627[/C][C]0.278275596690745[/C][C]0.139137798345373[/C][/ROW]
[ROW][C]20[/C][C]0.822858276194173[/C][C]0.354283447611654[/C][C]0.177141723805827[/C][/ROW]
[ROW][C]21[/C][C]0.744869737155135[/C][C]0.510260525689731[/C][C]0.255130262844865[/C][/ROW]
[ROW][C]22[/C][C]0.656328706285305[/C][C]0.68734258742939[/C][C]0.343671293714695[/C][/ROW]
[ROW][C]23[/C][C]0.625087276718785[/C][C]0.749825446562429[/C][C]0.374912723281215[/C][/ROW]
[ROW][C]24[/C][C]0.59030823684584[/C][C]0.81938352630832[/C][C]0.40969176315416[/C][/ROW]
[ROW][C]25[/C][C]0.571980045894123[/C][C]0.856039908211754[/C][C]0.428019954105877[/C][/ROW]
[ROW][C]26[/C][C]0.573207767408429[/C][C]0.853584465183143[/C][C]0.426792232591571[/C][/ROW]
[ROW][C]27[/C][C]0.522788282591745[/C][C]0.95442343481651[/C][C]0.477211717408255[/C][/ROW]
[ROW][C]28[/C][C]0.620894898924362[/C][C]0.758210202151277[/C][C]0.379105101075638[/C][/ROW]
[ROW][C]29[/C][C]0.572264690270468[/C][C]0.855470619459064[/C][C]0.427735309729532[/C][/ROW]
[ROW][C]30[/C][C]0.489157101989624[/C][C]0.97831420397925[/C][C]0.510842898010376[/C][/ROW]
[ROW][C]31[/C][C]0.674026045351587[/C][C]0.651947909296826[/C][C]0.325973954648413[/C][/ROW]
[ROW][C]32[/C][C]0.60376460525378[/C][C]0.792470789492439[/C][C]0.396235394746219[/C][/ROW]
[ROW][C]33[/C][C]0.688273100869883[/C][C]0.623453798260234[/C][C]0.311726899130117[/C][/ROW]
[ROW][C]34[/C][C]0.637259794692104[/C][C]0.725480410615792[/C][C]0.362740205307896[/C][/ROW]
[ROW][C]35[/C][C]0.677800533621672[/C][C]0.644398932756656[/C][C]0.322199466378328[/C][/ROW]
[ROW][C]36[/C][C]0.620930323618978[/C][C]0.758139352762044[/C][C]0.379069676381022[/C][/ROW]
[ROW][C]37[/C][C]0.595224361648354[/C][C]0.809551276703292[/C][C]0.404775638351646[/C][/ROW]
[ROW][C]38[/C][C]0.621596665691558[/C][C]0.756806668616884[/C][C]0.378403334308442[/C][/ROW]
[ROW][C]39[/C][C]0.54666645299589[/C][C]0.90666709400822[/C][C]0.45333354700411[/C][/ROW]
[ROW][C]40[/C][C]0.521829071862821[/C][C]0.956341856274358[/C][C]0.478170928137179[/C][/ROW]
[ROW][C]41[/C][C]0.7627534546851[/C][C]0.474493090629799[/C][C]0.237246545314900[/C][/ROW]
[ROW][C]42[/C][C]0.734183413228274[/C][C]0.531633173543452[/C][C]0.265816586771726[/C][/ROW]
[ROW][C]43[/C][C]0.809916942110498[/C][C]0.380166115779005[/C][C]0.190083057889502[/C][/ROW]
[ROW][C]44[/C][C]0.755726844769235[/C][C]0.48854631046153[/C][C]0.244273155230765[/C][/ROW]
[ROW][C]45[/C][C]0.720130783080558[/C][C]0.559738433838884[/C][C]0.279869216919442[/C][/ROW]
[ROW][C]46[/C][C]0.758285413581084[/C][C]0.483429172837832[/C][C]0.241714586418916[/C][/ROW]
[ROW][C]47[/C][C]0.700669575818786[/C][C]0.598660848362429[/C][C]0.299330424181214[/C][/ROW]
[ROW][C]48[/C][C]0.696802364881596[/C][C]0.606395270236808[/C][C]0.303197635118404[/C][/ROW]
[ROW][C]49[/C][C]0.848519721506255[/C][C]0.302960556987490[/C][C]0.151480278493745[/C][/ROW]
[ROW][C]50[/C][C]0.8109188297511[/C][C]0.378162340497801[/C][C]0.189081170248900[/C][/ROW]
[ROW][C]51[/C][C]0.773102885940205[/C][C]0.453794228119591[/C][C]0.226897114059795[/C][/ROW]
[ROW][C]52[/C][C]0.713294073937714[/C][C]0.573411852124572[/C][C]0.286705926062286[/C][/ROW]
[ROW][C]53[/C][C]0.881867293080842[/C][C]0.236265413838316[/C][C]0.118132706919158[/C][/ROW]
[ROW][C]54[/C][C]0.855800974549918[/C][C]0.288398050900165[/C][C]0.144199025450082[/C][/ROW]
[ROW][C]55[/C][C]0.837622899791939[/C][C]0.324754200416123[/C][C]0.162377100208061[/C][/ROW]
[ROW][C]56[/C][C]0.893330429478815[/C][C]0.213339141042370[/C][C]0.106669570521185[/C][/ROW]
[ROW][C]57[/C][C]0.961401454330134[/C][C]0.0771970913397328[/C][C]0.0385985456698664[/C][/ROW]
[ROW][C]58[/C][C]0.980125368236836[/C][C]0.0397492635263282[/C][C]0.0198746317631641[/C][/ROW]
[ROW][C]59[/C][C]0.964731053295054[/C][C]0.0705378934098915[/C][C]0.0352689467049457[/C][/ROW]
[ROW][C]60[/C][C]0.94822731431868[/C][C]0.103545371362640[/C][C]0.0517726856813199[/C][/ROW]
[ROW][C]61[/C][C]0.910832053407035[/C][C]0.178335893185930[/C][C]0.0891679465929648[/C][/ROW]
[ROW][C]62[/C][C]0.89338664469758[/C][C]0.213226710604840[/C][C]0.106613355302420[/C][/ROW]
[ROW][C]63[/C][C]0.843617674958501[/C][C]0.312764650082998[/C][C]0.156382325041499[/C][/ROW]
[ROW][C]64[/C][C]0.786248583482126[/C][C]0.427502833035749[/C][C]0.213751416517874[/C][/ROW]
[ROW][C]65[/C][C]0.673454829069772[/C][C]0.653090341860456[/C][C]0.326545170930228[/C][/ROW]
[ROW][C]66[/C][C]0.599005925627425[/C][C]0.80198814874515[/C][C]0.400994074372575[/C][/ROW]
[ROW][C]67[/C][C]0.738594144448763[/C][C]0.522811711102473[/C][C]0.261405855551237[/C][/ROW]
[/TABLE]
Source: https://freestatistics.org/blog/index.php?pk=25841&T=5

Globally Unique Identifier (entire table): ba.freestatistics.org/blog/index.php?pk=25841&T=5

As an alternative you can also use a QR Code:  

The GUIDs for individual cells are displayed in the table below:

Goldfeld-Quandt test for Heteroskedasticity
p-valuesAlternative Hypothesis
breakpoint indexgreater2-sidedless
180.9079507447594770.1840985104810460.0920492552405229
190.8608622016546270.2782755966907450.139137798345373
200.8228582761941730.3542834476116540.177141723805827
210.7448697371551350.5102605256897310.255130262844865
220.6563287062853050.687342587429390.343671293714695
230.6250872767187850.7498254465624290.374912723281215
240.590308236845840.819383526308320.40969176315416
250.5719800458941230.8560399082117540.428019954105877
260.5732077674084290.8535844651831430.426792232591571
270.5227882825917450.954423434816510.477211717408255
280.6208948989243620.7582102021512770.379105101075638
290.5722646902704680.8554706194590640.427735309729532
300.4891571019896240.978314203979250.510842898010376
310.6740260453515870.6519479092968260.325973954648413
320.603764605253780.7924707894924390.396235394746219
330.6882731008698830.6234537982602340.311726899130117
340.6372597946921040.7254804106157920.362740205307896
350.6778005336216720.6443989327566560.322199466378328
360.6209303236189780.7581393527620440.379069676381022
370.5952243616483540.8095512767032920.404775638351646
380.6215966656915580.7568066686168840.378403334308442
390.546666452995890.906667094008220.45333354700411
400.5218290718628210.9563418562743580.478170928137179
410.76275345468510.4744930906297990.237246545314900
420.7341834132282740.5316331735434520.265816586771726
430.8099169421104980.3801661157790050.190083057889502
440.7557268447692350.488546310461530.244273155230765
450.7201307830805580.5597384338388840.279869216919442
460.7582854135810840.4834291728378320.241714586418916
470.7006695758187860.5986608483624290.299330424181214
480.6968023648815960.6063952702368080.303197635118404
490.8485197215062550.3029605569874900.151480278493745
500.81091882975110.3781623404978010.189081170248900
510.7731028859402050.4537942281195910.226897114059795
520.7132940739377140.5734118521245720.286705926062286
530.8818672930808420.2362654138383160.118132706919158
540.8558009745499180.2883980509001650.144199025450082
550.8376228997919390.3247542004161230.162377100208061
560.8933304294788150.2133391410423700.106669570521185
570.9614014543301340.07719709133973280.0385985456698664
580.9801253682368360.03974926352632820.0198746317631641
590.9647310532950540.07053789340989150.0352689467049457
600.948227314318680.1035453713626400.0517726856813199
610.9108320534070350.1783358931859300.0891679465929648
620.893386644697580.2132267106048400.106613355302420
630.8436176749585010.3127646500829980.156382325041499
640.7862485834821260.4275028330357490.213751416517874
650.6734548290697720.6530903418604560.326545170930228
660.5990059256274250.801988148745150.400994074372575
670.7385941444487630.5228117111024730.261405855551237


Meta Analysis of Goldfeld-Quandt test for Heteroskedasticity
Description# significant tests% significant testsOK/NOK
1% type I error level00OK
5% type I error level10.02OK
10% type I error level30.06OK

\begin{tabular}{lllllllll}
\hline
Meta Analysis of Goldfeld-Quandt test for Heteroskedasticity \tabularnewline
Description & # significant tests & % significant tests & OK/NOK \tabularnewline
1% type I error level & 0 & 0 & OK \tabularnewline
5% type I error level & 1 & 0.02 & OK \tabularnewline
10% type I error level & 3 & 0.06 & OK \tabularnewline
\hline
\end{tabular}
%Source: https://freestatistics.org/blog/index.php?pk=25841&T=6

[TABLE]
[ROW][C]Meta Analysis of Goldfeld-Quandt test for Heteroskedasticity[/C][/ROW]
[ROW][C]Description[/C][C]# significant tests[/C][C]% significant tests[/C][C]OK/NOK[/C][/ROW]
[ROW][C]1% type I error level[/C][C]0[/C][C]0[/C][C]OK[/C][/ROW]
[ROW][C]5% type I error level[/C][C]1[/C][C]0.02[/C][C]OK[/C][/ROW]
[ROW][C]10% type I error level[/C][C]3[/C][C]0.06[/C][C]OK[/C][/ROW]
[/TABLE]
Source: https://freestatistics.org/blog/index.php?pk=25841&T=6

Globally Unique Identifier (entire table): ba.freestatistics.org/blog/index.php?pk=25841&T=6

As an alternative you can also use a QR Code:  

The GUIDs for individual cells are displayed in the table below:

Meta Analysis of Goldfeld-Quandt test for Heteroskedasticity
Description# significant tests% significant testsOK/NOK
1% type I error level00OK
5% type I error level10.02OK
10% type I error level30.06OK


Parameters (Session):
par1 = 1 ; par2 = Include Monthly Dummies ; par3 = Linear Trend ;
Parameters (R input):
par1 = 1 ; par2 = Include Monthly Dummies ; par3 = Linear Trend ;
R code (references can be found in the software module):
library(lattice)
library(lmtest)
n25 <- 25 #minimum number of obs. for Goldfeld-Quandt test
par1 <- as.numeric(par1)
x <- t(y)
k <- length(x[1,])
n <- length(x[,1])
x1 <- cbind(x[,par1], x[,1:k!=par1])
mycolnames <- c(colnames(x)[par1], colnames(x)[1:k!=par1])
colnames(x1) <- mycolnames #colnames(x)[par1]
x <- x1
if (par3 == 'First Differences'){
x2 <- array(0, dim=c(n-1,k), dimnames=list(1:(n-1), paste('(1-B)',colnames(x),sep='')))
for (i in 1:n-1) {
for (j in 1:k) {
x2[i,j] <- x[i+1,j] - x[i,j]
}
}
x <- x2
}
if (par2 == 'Include Monthly Dummies'){
x2 <- array(0, dim=c(n,11), dimnames=list(1:n, paste('M', seq(1:11), sep ='')))
for (i in 1:11){
x2[seq(i,n,12),i] <- 1
}
x <- cbind(x, x2)
}
if (par2 == 'Include Quarterly Dummies'){
x2 <- array(0, dim=c(n,3), dimnames=list(1:n, paste('Q', seq(1:3), sep ='')))
for (i in 1:3){
x2[seq(i,n,4),i] <- 1
}
x <- cbind(x, x2)
}
k <- length(x[1,])
if (par3 == 'Linear Trend'){
x <- cbind(x, c(1:n))
colnames(x)[k+1] <- 't'
}
x
k <- length(x[1,])
df <- as.data.frame(x)
(mylm <- lm(df))
(mysum <- summary(mylm))
if (n > n25) {
kp3 <- k + 3
nmkm3 <- n - k - 3
gqarr <- array(NA, dim=c(nmkm3-kp3+1,3))
numgqtests <- 0
numsignificant1 <- 0
numsignificant5 <- 0
numsignificant10 <- 0
for (mypoint in kp3:nmkm3) {
j <- 0
numgqtests <- numgqtests + 1
for (myalt in c('greater', 'two.sided', 'less')) {
j <- j + 1
gqarr[mypoint-kp3+1,j] <- gqtest(mylm, point=mypoint, alternative=myalt)$p.value
}
if (gqarr[mypoint-kp3+1,2] < 0.01) numsignificant1 <- numsignificant1 + 1
if (gqarr[mypoint-kp3+1,2] < 0.05) numsignificant5 <- numsignificant5 + 1
if (gqarr[mypoint-kp3+1,2] < 0.10) numsignificant10 <- numsignificant10 + 1
}
gqarr
}
bitmap(file='test0.png')
plot(x[,1], type='l', main='Actuals and Interpolation', ylab='value of Actuals and Interpolation (dots)', xlab='time or index')
points(x[,1]-mysum$resid)
grid()
dev.off()
bitmap(file='test1.png')
plot(mysum$resid, type='b', pch=19, main='Residuals', ylab='value of Residuals', xlab='time or index')
grid()
dev.off()
bitmap(file='test2.png')
hist(mysum$resid, main='Residual Histogram', xlab='values of Residuals')
grid()
dev.off()
bitmap(file='test3.png')
densityplot(~mysum$resid,col='black',main='Residual Density Plot', xlab='values of Residuals')
dev.off()
bitmap(file='test4.png')
qqnorm(mysum$resid, main='Residual Normal Q-Q Plot')
qqline(mysum$resid)
grid()
dev.off()
(myerror <- as.ts(mysum$resid))
bitmap(file='test5.png')
dum <- cbind(lag(myerror,k=1),myerror)
dum
dum1 <- dum[2:length(myerror),]
dum1
z <- as.data.frame(dum1)
z
plot(z,main=paste('Residual Lag plot, lowess, and regression line'), ylab='values of Residuals', xlab='lagged values of Residuals')
lines(lowess(z))
abline(lm(z))
grid()
dev.off()
bitmap(file='test6.png')
acf(mysum$resid, lag.max=length(mysum$resid)/2, main='Residual Autocorrelation Function')
grid()
dev.off()
bitmap(file='test7.png')
pacf(mysum$resid, lag.max=length(mysum$resid)/2, main='Residual Partial Autocorrelation Function')
grid()
dev.off()
bitmap(file='test8.png')
opar <- par(mfrow = c(2,2), oma = c(0, 0, 1.1, 0))
plot(mylm, las = 1, sub='Residual Diagnostics')
par(opar)
dev.off()
if (n > n25) {
bitmap(file='test9.png')
plot(kp3:nmkm3,gqarr[,2], main='Goldfeld-Quandt test',ylab='2-sided p-value',xlab='breakpoint')
grid()
dev.off()
}
load(file='createtable')
a<-table.start()
a<-table.row.start(a)
a<-table.element(a, 'Multiple Linear Regression - Estimated Regression Equation', 1, TRUE)
a<-table.row.end(a)
myeq <- colnames(x)[1]
myeq <- paste(myeq, '[t] = ', sep='')
for (i in 1:k){
if (mysum$coefficients[i,1] > 0) myeq <- paste(myeq, '+', '')
myeq <- paste(myeq, mysum$coefficients[i,1], sep=' ')
if (rownames(mysum$coefficients)[i] != '(Intercept)') {
myeq <- paste(myeq, rownames(mysum$coefficients)[i], sep='')
if (rownames(mysum$coefficients)[i] != 't') myeq <- paste(myeq, '[t]', sep='')
}
}
myeq <- paste(myeq, ' + e[t]')
a<-table.row.start(a)
a<-table.element(a, myeq)
a<-table.row.end(a)
a<-table.end(a)
table.save(a,file='mytable1.tab')
a<-table.start()
a<-table.row.start(a)
a<-table.element(a,hyperlink('ols1.htm','Multiple Linear Regression - Ordinary Least Squares',''), 6, TRUE)
a<-table.row.end(a)
a<-table.row.start(a)
a<-table.element(a,'Variable',header=TRUE)
a<-table.element(a,'Parameter',header=TRUE)
a<-table.element(a,'S.D.',header=TRUE)
a<-table.element(a,'T-STAT
H0: parameter = 0',header=TRUE)
a<-table.element(a,'2-tail p-value',header=TRUE)
a<-table.element(a,'1-tail p-value',header=TRUE)
a<-table.row.end(a)
for (i in 1:k){
a<-table.row.start(a)
a<-table.element(a,rownames(mysum$coefficients)[i],header=TRUE)
a<-table.element(a,mysum$coefficients[i,1])
a<-table.element(a, round(mysum$coefficients[i,2],6))
a<-table.element(a, round(mysum$coefficients[i,3],4))
a<-table.element(a, round(mysum$coefficients[i,4],6))
a<-table.element(a, round(mysum$coefficients[i,4]/2,6))
a<-table.row.end(a)
}
a<-table.end(a)
table.save(a,file='mytable2.tab')
a<-table.start()
a<-table.row.start(a)
a<-table.element(a, 'Multiple Linear Regression - Regression Statistics', 2, TRUE)
a<-table.row.end(a)
a<-table.row.start(a)
a<-table.element(a, 'Multiple R',1,TRUE)
a<-table.element(a, sqrt(mysum$r.squared))
a<-table.row.end(a)
a<-table.row.start(a)
a<-table.element(a, 'R-squared',1,TRUE)
a<-table.element(a, mysum$r.squared)
a<-table.row.end(a)
a<-table.row.start(a)
a<-table.element(a, 'Adjusted R-squared',1,TRUE)
a<-table.element(a, mysum$adj.r.squared)
a<-table.row.end(a)
a<-table.row.start(a)
a<-table.element(a, 'F-TEST (value)',1,TRUE)
a<-table.element(a, mysum$fstatistic[1])
a<-table.row.end(a)
a<-table.row.start(a)
a<-table.element(a, 'F-TEST (DF numerator)',1,TRUE)
a<-table.element(a, mysum$fstatistic[2])
a<-table.row.end(a)
a<-table.row.start(a)
a<-table.element(a, 'F-TEST (DF denominator)',1,TRUE)
a<-table.element(a, mysum$fstatistic[3])
a<-table.row.end(a)
a<-table.row.start(a)
a<-table.element(a, 'p-value',1,TRUE)
a<-table.element(a, 1-pf(mysum$fstatistic[1],mysum$fstatistic[2],mysum$fstatistic[3]))
a<-table.row.end(a)
a<-table.row.start(a)
a<-table.element(a, 'Multiple Linear Regression - Residual Statistics', 2, TRUE)
a<-table.row.end(a)
a<-table.row.start(a)
a<-table.element(a, 'Residual Standard Deviation',1,TRUE)
a<-table.element(a, mysum$sigma)
a<-table.row.end(a)
a<-table.row.start(a)
a<-table.element(a, 'Sum Squared Residuals',1,TRUE)
a<-table.element(a, sum(myerror*myerror))
a<-table.row.end(a)
a<-table.end(a)
table.save(a,file='mytable3.tab')
a<-table.start()
a<-table.row.start(a)
a<-table.element(a, 'Multiple Linear Regression - Actuals, Interpolation, and Residuals', 4, TRUE)
a<-table.row.end(a)
a<-table.row.start(a)
a<-table.element(a, 'Time or Index', 1, TRUE)
a<-table.element(a, 'Actuals', 1, TRUE)
a<-table.element(a, 'Interpolation
Forecast', 1, TRUE)
a<-table.element(a, 'Residuals
Prediction Error', 1, TRUE)
a<-table.row.end(a)
for (i in 1:n) {
a<-table.row.start(a)
a<-table.element(a,i, 1, TRUE)
a<-table.element(a,x[i])
a<-table.element(a,x[i]-mysum$resid[i])
a<-table.element(a,mysum$resid[i])
a<-table.row.end(a)
}
a<-table.end(a)
table.save(a,file='mytable4.tab')
if (n > n25) {
a<-table.start()
a<-table.row.start(a)
a<-table.element(a,'Goldfeld-Quandt test for Heteroskedasticity',4,TRUE)
a<-table.row.end(a)
a<-table.row.start(a)
a<-table.element(a,'p-values',header=TRUE)
a<-table.element(a,'Alternative Hypothesis',3,header=TRUE)
a<-table.row.end(a)
a<-table.row.start(a)
a<-table.element(a,'breakpoint index',header=TRUE)
a<-table.element(a,'greater',header=TRUE)
a<-table.element(a,'2-sided',header=TRUE)
a<-table.element(a,'less',header=TRUE)
a<-table.row.end(a)
for (mypoint in kp3:nmkm3) {
a<-table.row.start(a)
a<-table.element(a,mypoint,header=TRUE)
a<-table.element(a,gqarr[mypoint-kp3+1,1])
a<-table.element(a,gqarr[mypoint-kp3+1,2])
a<-table.element(a,gqarr[mypoint-kp3+1,3])
a<-table.row.end(a)
}
a<-table.end(a)
table.save(a,file='mytable5.tab')
a<-table.start()
a<-table.row.start(a)
a<-table.element(a,'Meta Analysis of Goldfeld-Quandt test for Heteroskedasticity',4,TRUE)
a<-table.row.end(a)
a<-table.row.start(a)
a<-table.element(a,'Description',header=TRUE)
a<-table.element(a,'# significant tests',header=TRUE)
a<-table.element(a,'% significant tests',header=TRUE)
a<-table.element(a,'OK/NOK',header=TRUE)
a<-table.row.end(a)
a<-table.row.start(a)
a<-table.element(a,'1% type I error level',header=TRUE)
a<-table.element(a,numsignificant1)
a<-table.element(a,numsignificant1/numgqtests)
if (numsignificant1/numgqtests < 0.01) dum <- 'OK' else dum <- 'NOK'
a<-table.element(a,dum)
a<-table.row.end(a)
a<-table.row.start(a)
a<-table.element(a,'5% type I error level',header=TRUE)
a<-table.element(a,numsignificant5)
a<-table.element(a,numsignificant5/numgqtests)
if (numsignificant5/numgqtests < 0.05) dum <- 'OK' else dum <- 'NOK'
a<-table.element(a,dum)
a<-table.row.end(a)
a<-table.row.start(a)
a<-table.element(a,'10% type I error level',header=TRUE)
a<-table.element(a,numsignificant10)
a<-table.element(a,numsignificant10/numgqtests)
if (numsignificant10/numgqtests < 0.1) dum <- 'OK' else dum <- 'NOK'
a<-table.element(a,dum)
a<-table.row.end(a)
a<-table.end(a)
table.save(a,file='mytable6.tab')
}