Free Statistics

of Irreproducible Research!

Author's title

Author*The author of this computation has been verified*
R Software Modulerwasp_multipleregression.wasp
Title produced by softwareMultiple Regression
Date of computationThu, 27 Nov 2008 07:12:02 -0700
Cite this page as followsStatistical Computations at FreeStatistics.org, Office for Research Development and Education, URL https://freestatistics.org/blog/index.php?v=date/2008/Nov/27/t122779519232ko1i1llor7jdv.htm/, Retrieved Sun, 19 May 2024 08:53:02 +0000
Statistical Computations at FreeStatistics.org, Office for Research Development and Education, URL https://freestatistics.org/blog/index.php?pk=25814, Retrieved Sun, 19 May 2024 08:53:02 +0000
QR Codes:

Original text written by user:
IsPrivate?No (this computation is public)
User-defined keywordsJonas Scheltjens
Estimated Impact126
Family? (F = Feedback message, R = changed R code, M = changed R Module, P = changed Parameters, D = changed Data)
F       [Multiple Regression] [Seatbelt Law Q3 m...] [2008-11-27 14:12:02] [f4960a11bac8b7f1cb71c83b5826d5bd] [Current]
Feedback Forum
2008-11-29 20:21:43 [006ad2c49b6a7c2ad6ab685cfc1dae56] [reply
goede uitleg, hier heb ik niets op aan te merken.
2008-11-30 10:04:22 [Carole Thielens] [reply
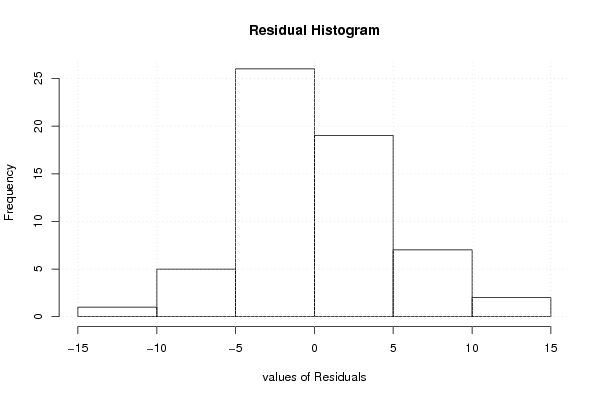
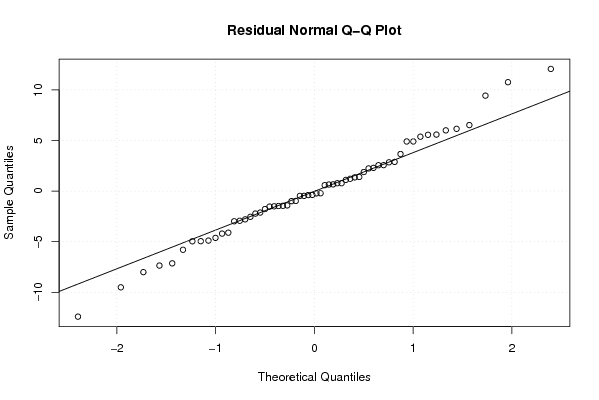
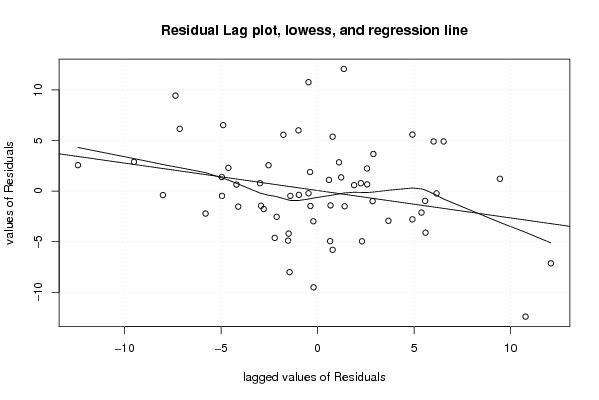
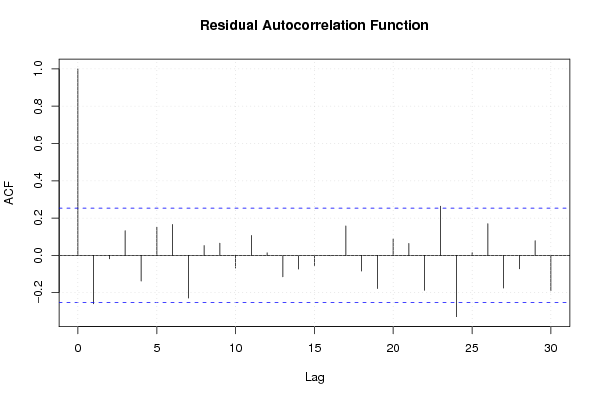
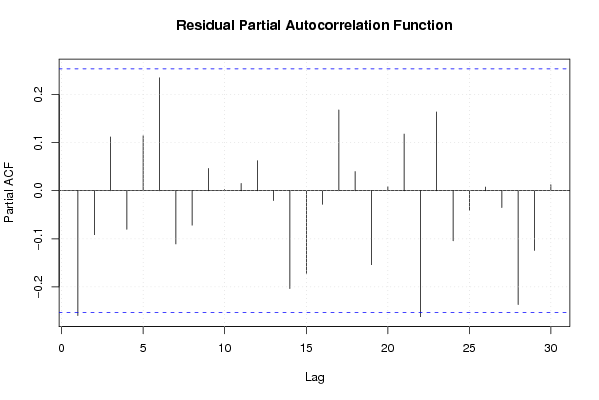
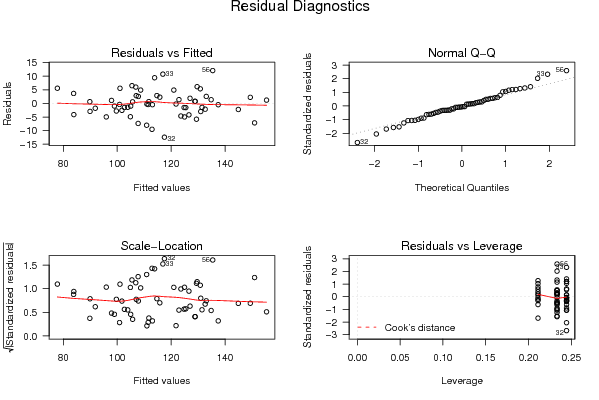
Dit was een perfecte analyse. De student maakte alle tabellen op en verklaarde deze gedetailleerd, waarna hij alle grafieken ook besprak. De algemene conclusie, dat er ten eerste geen patroon merkbaar zou mogen zijn bij de autocorrelatie en dat ten tweede het gemiddelde van de storingstermen gelijk zou moeten zijn aan nul, werd ook vermeld.

Post a new message
Dataseries X:
101,2	0
100,5	0
98	0
106,6	0
90,1	0
96,9	0
125,9	0
112	0
100	0
123,9	0
79,8	0
83,4	0
113,6	0
112,9	0
104	0
109,9	0
99	0
106,3	0
128,9	0
111,1	0
102,9	0
130	0
87	0
87,5	0
117,6	0
103,4	0
110,8	0
112,6	0
102,5	0
112,4	0
135,6	0
105,1	0
127,7	0
137	0
91	0
90,5	0
122,4	1
123,3	1
124,3	1
120	1
118,1	1
119	1
142,7	1
123,6	1
129,6	1
151,6	1
110,4	1
99,2	1
130,5	1
136,2	1
129,7	1
128	1
121,6	1
135,8	1
143,8	1
147,5	1
136,2	1
156,6	1
123,3	1
100,4	1


Summary of computational transaction
Raw Inputview raw input (R code)
Raw Outputview raw output of R engine
Computing time6 seconds
R Server'Sir Ronald Aylmer Fisher' @ 193.190.124.24

\begin{tabular}{lllllllll}
\hline
Summary of computational transaction \tabularnewline
Raw Input & view raw input (R code)  \tabularnewline
Raw Output & view raw output of R engine  \tabularnewline
Computing time & 6 seconds \tabularnewline
R Server & 'Sir Ronald Aylmer Fisher' @ 193.190.124.24 \tabularnewline
\hline
\end{tabular}
%Source: https://freestatistics.org/blog/index.php?pk=25814&T=0

[TABLE]
[ROW][C]Summary of computational transaction[/C][/ROW]
[ROW][C]Raw Input[/C][C]view raw input (R code) [/C][/ROW]
[ROW][C]Raw Output[/C][C]view raw output of R engine [/C][/ROW]
[ROW][C]Computing time[/C][C]6 seconds[/C][/ROW]
[ROW][C]R Server[/C][C]'Sir Ronald Aylmer Fisher' @ 193.190.124.24[/C][/ROW]
[/TABLE]
Source: https://freestatistics.org/blog/index.php?pk=25814&T=0

Globally Unique Identifier (entire table): ba.freestatistics.org/blog/index.php?pk=25814&T=0

As an alternative you can also use a QR Code:  

The GUIDs for individual cells are displayed in the table below:

Summary of computational transaction
Raw Inputview raw input (R code)
Raw Outputview raw output of R engine
Computing time6 seconds
R Server'Sir Ronald Aylmer Fisher' @ 193.190.124.24


Multiple Linear Regression - Estimated Regression Equation
y[t] = + 71.7922222222222 + 5.86944444444444x[t] + 30.3783333333333M1[t] + 28.0766666666667M2[t] + 25.675M3[t] + 27.2333333333333M4[t] + 17.5716666666667M5[t] + 24.89M6[t] + 45.6883333333333M7[t] + 29.6666666666667M8[t] + 28.585M9[t] + 48.6233333333333M10[t] + 6.60166666666666M11[t] + 0.501666666666667t + e[t]

\begin{tabular}{lllllllll}
\hline
Multiple Linear Regression - Estimated Regression Equation \tabularnewline
y[t] =  +  71.7922222222222 +  5.86944444444444x[t] +  30.3783333333333M1[t] +  28.0766666666667M2[t] +  25.675M3[t] +  27.2333333333333M4[t] +  17.5716666666667M5[t] +  24.89M6[t] +  45.6883333333333M7[t] +  29.6666666666667M8[t] +  28.585M9[t] +  48.6233333333333M10[t] +  6.60166666666666M11[t] +  0.501666666666667t  + e[t] \tabularnewline
\hline
\end{tabular}
%Source: https://freestatistics.org/blog/index.php?pk=25814&T=1

[TABLE]
[ROW][C]Multiple Linear Regression - Estimated Regression Equation[/C][/ROW]
[ROW][C]y[t] =  +  71.7922222222222 +  5.86944444444444x[t] +  30.3783333333333M1[t] +  28.0766666666667M2[t] +  25.675M3[t] +  27.2333333333333M4[t] +  17.5716666666667M5[t] +  24.89M6[t] +  45.6883333333333M7[t] +  29.6666666666667M8[t] +  28.585M9[t] +  48.6233333333333M10[t] +  6.60166666666666M11[t] +  0.501666666666667t  + e[t][/C][/ROW]
[/TABLE]
Source: https://freestatistics.org/blog/index.php?pk=25814&T=1

Globally Unique Identifier (entire table): ba.freestatistics.org/blog/index.php?pk=25814&T=1

As an alternative you can also use a QR Code:  

The GUIDs for individual cells are displayed in the table below:

Multiple Linear Regression - Estimated Regression Equation
y[t] = + 71.7922222222222 + 5.86944444444444x[t] + 30.3783333333333M1[t] + 28.0766666666667M2[t] + 25.675M3[t] + 27.2333333333333M4[t] + 17.5716666666667M5[t] + 24.89M6[t] + 45.6883333333333M7[t] + 29.6666666666667M8[t] + 28.585M9[t] + 48.6233333333333M10[t] + 6.60166666666666M11[t] + 0.501666666666667t + e[t]


Multiple Linear Regression - Ordinary Least Squares
VariableParameterS.D.T-STATH0: parameter = 02-tail p-value1-tail p-value
(Intercept)71.79222222222223.12867722.946500
x5.869444444444442.8096352.0890.0422650.021132
M130.37833333333333.4876098.710400
M228.07666666666673.4677478.096500
M325.6753.4496787.442700
M427.23333333333333.4334317.931800
M517.57166666666673.4190315.13945e-063e-06
M624.893.4065017.306600
M745.68833333333333.39586413.454100
M829.66666666666673.3871358.758600
M928.5853.3803318.456300
M1048.62333333333333.37546214.404900
M116.601666666666663.3725381.95750.0563750.028187
t0.5016666666666670.0811076.185200

\begin{tabular}{lllllllll}
\hline
Multiple Linear Regression - Ordinary Least Squares \tabularnewline
Variable & Parameter & S.D. & T-STATH0: parameter = 0 & 2-tail p-value & 1-tail p-value \tabularnewline
(Intercept) & 71.7922222222222 & 3.128677 & 22.9465 & 0 & 0 \tabularnewline
x & 5.86944444444444 & 2.809635 & 2.089 & 0.042265 & 0.021132 \tabularnewline
M1 & 30.3783333333333 & 3.487609 & 8.7104 & 0 & 0 \tabularnewline
M2 & 28.0766666666667 & 3.467747 & 8.0965 & 0 & 0 \tabularnewline
M3 & 25.675 & 3.449678 & 7.4427 & 0 & 0 \tabularnewline
M4 & 27.2333333333333 & 3.433431 & 7.9318 & 0 & 0 \tabularnewline
M5 & 17.5716666666667 & 3.419031 & 5.1394 & 5e-06 & 3e-06 \tabularnewline
M6 & 24.89 & 3.406501 & 7.3066 & 0 & 0 \tabularnewline
M7 & 45.6883333333333 & 3.395864 & 13.4541 & 0 & 0 \tabularnewline
M8 & 29.6666666666667 & 3.387135 & 8.7586 & 0 & 0 \tabularnewline
M9 & 28.585 & 3.380331 & 8.4563 & 0 & 0 \tabularnewline
M10 & 48.6233333333333 & 3.375462 & 14.4049 & 0 & 0 \tabularnewline
M11 & 6.60166666666666 & 3.372538 & 1.9575 & 0.056375 & 0.028187 \tabularnewline
t & 0.501666666666667 & 0.081107 & 6.1852 & 0 & 0 \tabularnewline
\hline
\end{tabular}
%Source: https://freestatistics.org/blog/index.php?pk=25814&T=2

[TABLE]
[ROW][C]Multiple Linear Regression - Ordinary Least Squares[/C][/ROW]
[ROW][C]Variable[/C][C]Parameter[/C][C]S.D.[/C][C]T-STATH0: parameter = 0[/C][C]2-tail p-value[/C][C]1-tail p-value[/C][/ROW]
[ROW][C](Intercept)[/C][C]71.7922222222222[/C][C]3.128677[/C][C]22.9465[/C][C]0[/C][C]0[/C][/ROW]
[ROW][C]x[/C][C]5.86944444444444[/C][C]2.809635[/C][C]2.089[/C][C]0.042265[/C][C]0.021132[/C][/ROW]
[ROW][C]M1[/C][C]30.3783333333333[/C][C]3.487609[/C][C]8.7104[/C][C]0[/C][C]0[/C][/ROW]
[ROW][C]M2[/C][C]28.0766666666667[/C][C]3.467747[/C][C]8.0965[/C][C]0[/C][C]0[/C][/ROW]
[ROW][C]M3[/C][C]25.675[/C][C]3.449678[/C][C]7.4427[/C][C]0[/C][C]0[/C][/ROW]
[ROW][C]M4[/C][C]27.2333333333333[/C][C]3.433431[/C][C]7.9318[/C][C]0[/C][C]0[/C][/ROW]
[ROW][C]M5[/C][C]17.5716666666667[/C][C]3.419031[/C][C]5.1394[/C][C]5e-06[/C][C]3e-06[/C][/ROW]
[ROW][C]M6[/C][C]24.89[/C][C]3.406501[/C][C]7.3066[/C][C]0[/C][C]0[/C][/ROW]
[ROW][C]M7[/C][C]45.6883333333333[/C][C]3.395864[/C][C]13.4541[/C][C]0[/C][C]0[/C][/ROW]
[ROW][C]M8[/C][C]29.6666666666667[/C][C]3.387135[/C][C]8.7586[/C][C]0[/C][C]0[/C][/ROW]
[ROW][C]M9[/C][C]28.585[/C][C]3.380331[/C][C]8.4563[/C][C]0[/C][C]0[/C][/ROW]
[ROW][C]M10[/C][C]48.6233333333333[/C][C]3.375462[/C][C]14.4049[/C][C]0[/C][C]0[/C][/ROW]
[ROW][C]M11[/C][C]6.60166666666666[/C][C]3.372538[/C][C]1.9575[/C][C]0.056375[/C][C]0.028187[/C][/ROW]
[ROW][C]t[/C][C]0.501666666666667[/C][C]0.081107[/C][C]6.1852[/C][C]0[/C][C]0[/C][/ROW]
[/TABLE]
Source: https://freestatistics.org/blog/index.php?pk=25814&T=2

Globally Unique Identifier (entire table): ba.freestatistics.org/blog/index.php?pk=25814&T=2

As an alternative you can also use a QR Code:  

The GUIDs for individual cells are displayed in the table below:

Multiple Linear Regression - Ordinary Least Squares
VariableParameterS.D.T-STATH0: parameter = 02-tail p-value1-tail p-value
(Intercept)71.79222222222223.12867722.946500
x5.869444444444442.8096352.0890.0422650.021132
M130.37833333333333.4876098.710400
M228.07666666666673.4677478.096500
M325.6753.4496787.442700
M427.23333333333333.4334317.931800
M517.57166666666673.4190315.13945e-063e-06
M624.893.4065017.306600
M745.68833333333333.39586413.454100
M829.66666666666673.3871358.758600
M928.5853.3803318.456300
M1048.62333333333333.37546214.404900
M116.601666666666663.3725381.95750.0563750.028187
t0.5016666666666670.0811076.185200


Multiple Linear Regression - Regression Statistics
Multiple R0.963946307315686
R-squared0.929192483387547
Adjusted R-squared0.909181663475332
F-TEST (value)46.4345033069011
F-TEST (DF numerator)13
F-TEST (DF denominator)46
p-value0
Multiple Linear Regression - Residual Statistics
Residual Standard Deviation5.33090773646346
Sum Squared Residuals1307.25455555556

\begin{tabular}{lllllllll}
\hline
Multiple Linear Regression - Regression Statistics \tabularnewline
Multiple R & 0.963946307315686 \tabularnewline
R-squared & 0.929192483387547 \tabularnewline
Adjusted R-squared & 0.909181663475332 \tabularnewline
F-TEST (value) & 46.4345033069011 \tabularnewline
F-TEST (DF numerator) & 13 \tabularnewline
F-TEST (DF denominator) & 46 \tabularnewline
p-value & 0 \tabularnewline
Multiple Linear Regression - Residual Statistics \tabularnewline
Residual Standard Deviation & 5.33090773646346 \tabularnewline
Sum Squared Residuals & 1307.25455555556 \tabularnewline
\hline
\end{tabular}
%Source: https://freestatistics.org/blog/index.php?pk=25814&T=3

[TABLE]
[ROW][C]Multiple Linear Regression - Regression Statistics[/C][/ROW]
[ROW][C]Multiple R[/C][C]0.963946307315686[/C][/ROW]
[ROW][C]R-squared[/C][C]0.929192483387547[/C][/ROW]
[ROW][C]Adjusted R-squared[/C][C]0.909181663475332[/C][/ROW]
[ROW][C]F-TEST (value)[/C][C]46.4345033069011[/C][/ROW]
[ROW][C]F-TEST (DF numerator)[/C][C]13[/C][/ROW]
[ROW][C]F-TEST (DF denominator)[/C][C]46[/C][/ROW]
[ROW][C]p-value[/C][C]0[/C][/ROW]
[ROW][C]Multiple Linear Regression - Residual Statistics[/C][/ROW]
[ROW][C]Residual Standard Deviation[/C][C]5.33090773646346[/C][/ROW]
[ROW][C]Sum Squared Residuals[/C][C]1307.25455555556[/C][/ROW]
[/TABLE]
Source: https://freestatistics.org/blog/index.php?pk=25814&T=3

Globally Unique Identifier (entire table): ba.freestatistics.org/blog/index.php?pk=25814&T=3

As an alternative you can also use a QR Code:  

The GUIDs for individual cells are displayed in the table below:

Multiple Linear Regression - Regression Statistics
Multiple R0.963946307315686
R-squared0.929192483387547
Adjusted R-squared0.909181663475332
F-TEST (value)46.4345033069011
F-TEST (DF numerator)13
F-TEST (DF denominator)46
p-value0
Multiple Linear Regression - Residual Statistics
Residual Standard Deviation5.33090773646346
Sum Squared Residuals1307.25455555556


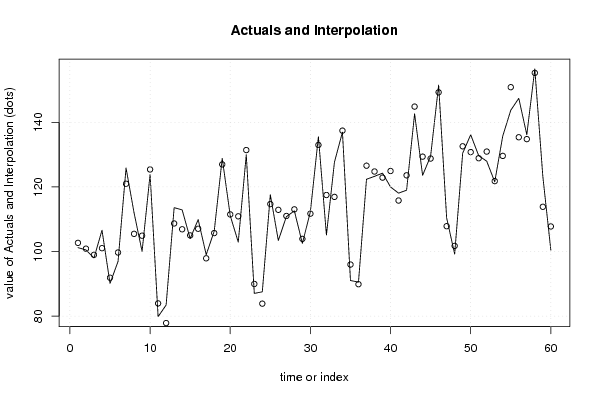
Multiple Linear Regression - Actuals, Interpolation, and Residuals
Time or IndexActualsInterpolationForecastResidualsPrediction Error
1101.2102.672222222222-1.47222222222230
2100.5100.872222222222-0.372222222222224
39898.9722222222222-0.972222222222216
4106.6101.0322222222225.56777777777778
590.191.8722222222222-1.77222222222224
696.999.6922222222222-2.79222222222221
7125.9120.9922222222224.90777777777779
8112105.4722222222226.5277777777778
9100104.892222222222-4.89222222222221
10123.9125.432222222222-1.53222222222221
1179.883.9122222222222-4.11222222222223
1283.477.81222222222225.58777777777778
13113.6108.6922222222224.90777777777779
14112.9106.8922222222226.00777777777779
15104104.992222222222-0.992222222222218
16109.9107.0522222222222.84777777777778
179997.89222222222221.10777777777778
18106.3105.7122222222220.58777777777777
19128.9127.0122222222221.88777777777779
20111.1111.492222222222-0.392222222222227
21102.9110.912222222222-8.01222222222222
22130131.452222222222-1.45222222222221
238789.9322222222222-2.93222222222222
2487.583.83222222222223.66777777777777
25117.6114.7122222222222.88777777777779
26103.4112.912222222222-9.51222222222222
27110.8111.012222222222-0.212222222222229
28112.6113.072222222222-0.472222222222233
29102.5103.912222222222-1.41222222222222
30112.4111.7322222222220.667777777777774
31135.6133.0322222222222.56777777777777
32105.1117.512222222222-12.4122222222222
33127.7116.93222222222210.7677777777778
34137137.472222222222-0.472222222222223
359195.9522222222222-4.95222222222222
3690.589.85222222222220.647777777777775
37122.4126.601666666667-4.20166666666664
38123.3124.801666666667-1.50166666666666
39124.3122.9016666666671.39833333333334
40120124.961666666667-4.96166666666666
41118.1115.8016666666672.29833333333334
42119123.621666666667-4.62166666666667
43142.7144.921666666667-2.22166666666668
44123.6129.401666666667-5.80166666666667
45129.6128.8216666666670.77833333333333
46151.6149.3616666666672.23833333333332
47110.4107.8416666666672.55833333333334
4899.2101.741666666667-2.54166666666666
49130.5132.621666666667-2.12166666666665
50136.2130.8216666666675.37833333333332
51129.7128.9216666666670.778333333333327
52128130.981666666667-2.98166666666666
53121.6121.821666666667-0.221666666666668
54135.8129.6416666666676.15833333333334
55143.8150.941666666667-7.14166666666666
56147.5135.42166666666712.0783333333333
57136.2134.8416666666671.35833333333332
58156.6155.3816666666671.21833333333332
59123.3113.8616666666679.43833333333333
60100.4107.761666666667-7.36166666666667

\begin{tabular}{lllllllll}
\hline
Multiple Linear Regression - Actuals, Interpolation, and Residuals \tabularnewline
Time or Index & Actuals & InterpolationForecast & ResidualsPrediction Error \tabularnewline
1 & 101.2 & 102.672222222222 & -1.47222222222230 \tabularnewline
2 & 100.5 & 100.872222222222 & -0.372222222222224 \tabularnewline
3 & 98 & 98.9722222222222 & -0.972222222222216 \tabularnewline
4 & 106.6 & 101.032222222222 & 5.56777777777778 \tabularnewline
5 & 90.1 & 91.8722222222222 & -1.77222222222224 \tabularnewline
6 & 96.9 & 99.6922222222222 & -2.79222222222221 \tabularnewline
7 & 125.9 & 120.992222222222 & 4.90777777777779 \tabularnewline
8 & 112 & 105.472222222222 & 6.5277777777778 \tabularnewline
9 & 100 & 104.892222222222 & -4.89222222222221 \tabularnewline
10 & 123.9 & 125.432222222222 & -1.53222222222221 \tabularnewline
11 & 79.8 & 83.9122222222222 & -4.11222222222223 \tabularnewline
12 & 83.4 & 77.8122222222222 & 5.58777777777778 \tabularnewline
13 & 113.6 & 108.692222222222 & 4.90777777777779 \tabularnewline
14 & 112.9 & 106.892222222222 & 6.00777777777779 \tabularnewline
15 & 104 & 104.992222222222 & -0.992222222222218 \tabularnewline
16 & 109.9 & 107.052222222222 & 2.84777777777778 \tabularnewline
17 & 99 & 97.8922222222222 & 1.10777777777778 \tabularnewline
18 & 106.3 & 105.712222222222 & 0.58777777777777 \tabularnewline
19 & 128.9 & 127.012222222222 & 1.88777777777779 \tabularnewline
20 & 111.1 & 111.492222222222 & -0.392222222222227 \tabularnewline
21 & 102.9 & 110.912222222222 & -8.01222222222222 \tabularnewline
22 & 130 & 131.452222222222 & -1.45222222222221 \tabularnewline
23 & 87 & 89.9322222222222 & -2.93222222222222 \tabularnewline
24 & 87.5 & 83.8322222222222 & 3.66777777777777 \tabularnewline
25 & 117.6 & 114.712222222222 & 2.88777777777779 \tabularnewline
26 & 103.4 & 112.912222222222 & -9.51222222222222 \tabularnewline
27 & 110.8 & 111.012222222222 & -0.212222222222229 \tabularnewline
28 & 112.6 & 113.072222222222 & -0.472222222222233 \tabularnewline
29 & 102.5 & 103.912222222222 & -1.41222222222222 \tabularnewline
30 & 112.4 & 111.732222222222 & 0.667777777777774 \tabularnewline
31 & 135.6 & 133.032222222222 & 2.56777777777777 \tabularnewline
32 & 105.1 & 117.512222222222 & -12.4122222222222 \tabularnewline
33 & 127.7 & 116.932222222222 & 10.7677777777778 \tabularnewline
34 & 137 & 137.472222222222 & -0.472222222222223 \tabularnewline
35 & 91 & 95.9522222222222 & -4.95222222222222 \tabularnewline
36 & 90.5 & 89.8522222222222 & 0.647777777777775 \tabularnewline
37 & 122.4 & 126.601666666667 & -4.20166666666664 \tabularnewline
38 & 123.3 & 124.801666666667 & -1.50166666666666 \tabularnewline
39 & 124.3 & 122.901666666667 & 1.39833333333334 \tabularnewline
40 & 120 & 124.961666666667 & -4.96166666666666 \tabularnewline
41 & 118.1 & 115.801666666667 & 2.29833333333334 \tabularnewline
42 & 119 & 123.621666666667 & -4.62166666666667 \tabularnewline
43 & 142.7 & 144.921666666667 & -2.22166666666668 \tabularnewline
44 & 123.6 & 129.401666666667 & -5.80166666666667 \tabularnewline
45 & 129.6 & 128.821666666667 & 0.77833333333333 \tabularnewline
46 & 151.6 & 149.361666666667 & 2.23833333333332 \tabularnewline
47 & 110.4 & 107.841666666667 & 2.55833333333334 \tabularnewline
48 & 99.2 & 101.741666666667 & -2.54166666666666 \tabularnewline
49 & 130.5 & 132.621666666667 & -2.12166666666665 \tabularnewline
50 & 136.2 & 130.821666666667 & 5.37833333333332 \tabularnewline
51 & 129.7 & 128.921666666667 & 0.778333333333327 \tabularnewline
52 & 128 & 130.981666666667 & -2.98166666666666 \tabularnewline
53 & 121.6 & 121.821666666667 & -0.221666666666668 \tabularnewline
54 & 135.8 & 129.641666666667 & 6.15833333333334 \tabularnewline
55 & 143.8 & 150.941666666667 & -7.14166666666666 \tabularnewline
56 & 147.5 & 135.421666666667 & 12.0783333333333 \tabularnewline
57 & 136.2 & 134.841666666667 & 1.35833333333332 \tabularnewline
58 & 156.6 & 155.381666666667 & 1.21833333333332 \tabularnewline
59 & 123.3 & 113.861666666667 & 9.43833333333333 \tabularnewline
60 & 100.4 & 107.761666666667 & -7.36166666666667 \tabularnewline
\hline
\end{tabular}
%Source: https://freestatistics.org/blog/index.php?pk=25814&T=4

[TABLE]
[ROW][C]Multiple Linear Regression - Actuals, Interpolation, and Residuals[/C][/ROW]
[ROW][C]Time or Index[/C][C]Actuals[/C][C]InterpolationForecast[/C][C]ResidualsPrediction Error[/C][/ROW]
[ROW][C]1[/C][C]101.2[/C][C]102.672222222222[/C][C]-1.47222222222230[/C][/ROW]
[ROW][C]2[/C][C]100.5[/C][C]100.872222222222[/C][C]-0.372222222222224[/C][/ROW]
[ROW][C]3[/C][C]98[/C][C]98.9722222222222[/C][C]-0.972222222222216[/C][/ROW]
[ROW][C]4[/C][C]106.6[/C][C]101.032222222222[/C][C]5.56777777777778[/C][/ROW]
[ROW][C]5[/C][C]90.1[/C][C]91.8722222222222[/C][C]-1.77222222222224[/C][/ROW]
[ROW][C]6[/C][C]96.9[/C][C]99.6922222222222[/C][C]-2.79222222222221[/C][/ROW]
[ROW][C]7[/C][C]125.9[/C][C]120.992222222222[/C][C]4.90777777777779[/C][/ROW]
[ROW][C]8[/C][C]112[/C][C]105.472222222222[/C][C]6.5277777777778[/C][/ROW]
[ROW][C]9[/C][C]100[/C][C]104.892222222222[/C][C]-4.89222222222221[/C][/ROW]
[ROW][C]10[/C][C]123.9[/C][C]125.432222222222[/C][C]-1.53222222222221[/C][/ROW]
[ROW][C]11[/C][C]79.8[/C][C]83.9122222222222[/C][C]-4.11222222222223[/C][/ROW]
[ROW][C]12[/C][C]83.4[/C][C]77.8122222222222[/C][C]5.58777777777778[/C][/ROW]
[ROW][C]13[/C][C]113.6[/C][C]108.692222222222[/C][C]4.90777777777779[/C][/ROW]
[ROW][C]14[/C][C]112.9[/C][C]106.892222222222[/C][C]6.00777777777779[/C][/ROW]
[ROW][C]15[/C][C]104[/C][C]104.992222222222[/C][C]-0.992222222222218[/C][/ROW]
[ROW][C]16[/C][C]109.9[/C][C]107.052222222222[/C][C]2.84777777777778[/C][/ROW]
[ROW][C]17[/C][C]99[/C][C]97.8922222222222[/C][C]1.10777777777778[/C][/ROW]
[ROW][C]18[/C][C]106.3[/C][C]105.712222222222[/C][C]0.58777777777777[/C][/ROW]
[ROW][C]19[/C][C]128.9[/C][C]127.012222222222[/C][C]1.88777777777779[/C][/ROW]
[ROW][C]20[/C][C]111.1[/C][C]111.492222222222[/C][C]-0.392222222222227[/C][/ROW]
[ROW][C]21[/C][C]102.9[/C][C]110.912222222222[/C][C]-8.01222222222222[/C][/ROW]
[ROW][C]22[/C][C]130[/C][C]131.452222222222[/C][C]-1.45222222222221[/C][/ROW]
[ROW][C]23[/C][C]87[/C][C]89.9322222222222[/C][C]-2.93222222222222[/C][/ROW]
[ROW][C]24[/C][C]87.5[/C][C]83.8322222222222[/C][C]3.66777777777777[/C][/ROW]
[ROW][C]25[/C][C]117.6[/C][C]114.712222222222[/C][C]2.88777777777779[/C][/ROW]
[ROW][C]26[/C][C]103.4[/C][C]112.912222222222[/C][C]-9.51222222222222[/C][/ROW]
[ROW][C]27[/C][C]110.8[/C][C]111.012222222222[/C][C]-0.212222222222229[/C][/ROW]
[ROW][C]28[/C][C]112.6[/C][C]113.072222222222[/C][C]-0.472222222222233[/C][/ROW]
[ROW][C]29[/C][C]102.5[/C][C]103.912222222222[/C][C]-1.41222222222222[/C][/ROW]
[ROW][C]30[/C][C]112.4[/C][C]111.732222222222[/C][C]0.667777777777774[/C][/ROW]
[ROW][C]31[/C][C]135.6[/C][C]133.032222222222[/C][C]2.56777777777777[/C][/ROW]
[ROW][C]32[/C][C]105.1[/C][C]117.512222222222[/C][C]-12.4122222222222[/C][/ROW]
[ROW][C]33[/C][C]127.7[/C][C]116.932222222222[/C][C]10.7677777777778[/C][/ROW]
[ROW][C]34[/C][C]137[/C][C]137.472222222222[/C][C]-0.472222222222223[/C][/ROW]
[ROW][C]35[/C][C]91[/C][C]95.9522222222222[/C][C]-4.95222222222222[/C][/ROW]
[ROW][C]36[/C][C]90.5[/C][C]89.8522222222222[/C][C]0.647777777777775[/C][/ROW]
[ROW][C]37[/C][C]122.4[/C][C]126.601666666667[/C][C]-4.20166666666664[/C][/ROW]
[ROW][C]38[/C][C]123.3[/C][C]124.801666666667[/C][C]-1.50166666666666[/C][/ROW]
[ROW][C]39[/C][C]124.3[/C][C]122.901666666667[/C][C]1.39833333333334[/C][/ROW]
[ROW][C]40[/C][C]120[/C][C]124.961666666667[/C][C]-4.96166666666666[/C][/ROW]
[ROW][C]41[/C][C]118.1[/C][C]115.801666666667[/C][C]2.29833333333334[/C][/ROW]
[ROW][C]42[/C][C]119[/C][C]123.621666666667[/C][C]-4.62166666666667[/C][/ROW]
[ROW][C]43[/C][C]142.7[/C][C]144.921666666667[/C][C]-2.22166666666668[/C][/ROW]
[ROW][C]44[/C][C]123.6[/C][C]129.401666666667[/C][C]-5.80166666666667[/C][/ROW]
[ROW][C]45[/C][C]129.6[/C][C]128.821666666667[/C][C]0.77833333333333[/C][/ROW]
[ROW][C]46[/C][C]151.6[/C][C]149.361666666667[/C][C]2.23833333333332[/C][/ROW]
[ROW][C]47[/C][C]110.4[/C][C]107.841666666667[/C][C]2.55833333333334[/C][/ROW]
[ROW][C]48[/C][C]99.2[/C][C]101.741666666667[/C][C]-2.54166666666666[/C][/ROW]
[ROW][C]49[/C][C]130.5[/C][C]132.621666666667[/C][C]-2.12166666666665[/C][/ROW]
[ROW][C]50[/C][C]136.2[/C][C]130.821666666667[/C][C]5.37833333333332[/C][/ROW]
[ROW][C]51[/C][C]129.7[/C][C]128.921666666667[/C][C]0.778333333333327[/C][/ROW]
[ROW][C]52[/C][C]128[/C][C]130.981666666667[/C][C]-2.98166666666666[/C][/ROW]
[ROW][C]53[/C][C]121.6[/C][C]121.821666666667[/C][C]-0.221666666666668[/C][/ROW]
[ROW][C]54[/C][C]135.8[/C][C]129.641666666667[/C][C]6.15833333333334[/C][/ROW]
[ROW][C]55[/C][C]143.8[/C][C]150.941666666667[/C][C]-7.14166666666666[/C][/ROW]
[ROW][C]56[/C][C]147.5[/C][C]135.421666666667[/C][C]12.0783333333333[/C][/ROW]
[ROW][C]57[/C][C]136.2[/C][C]134.841666666667[/C][C]1.35833333333332[/C][/ROW]
[ROW][C]58[/C][C]156.6[/C][C]155.381666666667[/C][C]1.21833333333332[/C][/ROW]
[ROW][C]59[/C][C]123.3[/C][C]113.861666666667[/C][C]9.43833333333333[/C][/ROW]
[ROW][C]60[/C][C]100.4[/C][C]107.761666666667[/C][C]-7.36166666666667[/C][/ROW]
[/TABLE]
Source: https://freestatistics.org/blog/index.php?pk=25814&T=4

Globally Unique Identifier (entire table): ba.freestatistics.org/blog/index.php?pk=25814&T=4

As an alternative you can also use a QR Code:  

The GUIDs for individual cells are displayed in the table below:

Multiple Linear Regression - Actuals, Interpolation, and Residuals
Time or IndexActualsInterpolationForecastResidualsPrediction Error
1101.2102.672222222222-1.47222222222230
2100.5100.872222222222-0.372222222222224
39898.9722222222222-0.972222222222216
4106.6101.0322222222225.56777777777778
590.191.8722222222222-1.77222222222224
696.999.6922222222222-2.79222222222221
7125.9120.9922222222224.90777777777779
8112105.4722222222226.5277777777778
9100104.892222222222-4.89222222222221
10123.9125.432222222222-1.53222222222221
1179.883.9122222222222-4.11222222222223
1283.477.81222222222225.58777777777778
13113.6108.6922222222224.90777777777779
14112.9106.8922222222226.00777777777779
15104104.992222222222-0.992222222222218
16109.9107.0522222222222.84777777777778
179997.89222222222221.10777777777778
18106.3105.7122222222220.58777777777777
19128.9127.0122222222221.88777777777779
20111.1111.492222222222-0.392222222222227
21102.9110.912222222222-8.01222222222222
22130131.452222222222-1.45222222222221
238789.9322222222222-2.93222222222222
2487.583.83222222222223.66777777777777
25117.6114.7122222222222.88777777777779
26103.4112.912222222222-9.51222222222222
27110.8111.012222222222-0.212222222222229
28112.6113.072222222222-0.472222222222233
29102.5103.912222222222-1.41222222222222
30112.4111.7322222222220.667777777777774
31135.6133.0322222222222.56777777777777
32105.1117.512222222222-12.4122222222222
33127.7116.93222222222210.7677777777778
34137137.472222222222-0.472222222222223
359195.9522222222222-4.95222222222222
3690.589.85222222222220.647777777777775
37122.4126.601666666667-4.20166666666664
38123.3124.801666666667-1.50166666666666
39124.3122.9016666666671.39833333333334
40120124.961666666667-4.96166666666666
41118.1115.8016666666672.29833333333334
42119123.621666666667-4.62166666666667
43142.7144.921666666667-2.22166666666668
44123.6129.401666666667-5.80166666666667
45129.6128.8216666666670.77833333333333
46151.6149.3616666666672.23833333333332
47110.4107.8416666666672.55833333333334
4899.2101.741666666667-2.54166666666666
49130.5132.621666666667-2.12166666666665
50136.2130.8216666666675.37833333333332
51129.7128.9216666666670.778333333333327
52128130.981666666667-2.98166666666666
53121.6121.821666666667-0.221666666666668
54135.8129.6416666666676.15833333333334
55143.8150.941666666667-7.14166666666666
56147.5135.42166666666712.0783333333333
57136.2134.8416666666671.35833333333332
58156.6155.3816666666671.21833333333332
59123.3113.8616666666679.43833333333333
60100.4107.761666666667-7.36166666666667


Goldfeld-Quandt test for Heteroskedasticity
p-valuesAlternative Hypothesis
breakpoint indexgreater2-sidedless
170.1983028784581380.3966057569162760.801697121541862
180.08905283850524010.1781056770104800.91094716149476
190.08052589056546840.1610517811309370.919474109434532
200.1270859817324300.2541719634648590.87291401826757
210.09828074481820650.1965614896364130.901719255181794
220.05149970799641850.1029994159928370.948500292003582
230.02622370698334750.05244741396669490.973776293016653
240.01836127120616190.03672254241232390.981638728793838
250.01041661863460440.02083323726920880.989583381365396
260.0992587061952910.1985174123905820.900741293804709
270.06339997632734310.1267999526546860.936600023672657
280.04480419021744840.08960838043489690.955195809782552
290.02514803857857840.05029607715715680.974851961421422
300.01560380415127400.03120760830254790.984396195848726
310.01250961859753380.02501923719506770.987490381402466
320.1535385809823680.3070771619647370.846461419017632
330.5731865738165510.8536268523668990.426813426183449
340.4717557059926370.9435114119852740.528244294007363
350.5953410182586780.8093179634826430.404658981741322
360.4940155640198380.9880311280396770.505984435980162
370.3839246414654490.7678492829308970.616075358534551
380.3168252295368330.6336504590736660.683174770463167
390.2431044176171300.4862088352342610.75689558238287
400.1718977463117780.3437954926235570.828102253688222
410.1356697497133520.2713394994267040.864330250286648
420.1119042183385910.2238084366771820.888095781661409
430.0934813268970280.1869626537940560.906518673102972

\begin{tabular}{lllllllll}
\hline
Goldfeld-Quandt test for Heteroskedasticity \tabularnewline
p-values & Alternative Hypothesis \tabularnewline
breakpoint index & greater & 2-sided & less \tabularnewline
17 & 0.198302878458138 & 0.396605756916276 & 0.801697121541862 \tabularnewline
18 & 0.0890528385052401 & 0.178105677010480 & 0.91094716149476 \tabularnewline
19 & 0.0805258905654684 & 0.161051781130937 & 0.919474109434532 \tabularnewline
20 & 0.127085981732430 & 0.254171963464859 & 0.87291401826757 \tabularnewline
21 & 0.0982807448182065 & 0.196561489636413 & 0.901719255181794 \tabularnewline
22 & 0.0514997079964185 & 0.102999415992837 & 0.948500292003582 \tabularnewline
23 & 0.0262237069833475 & 0.0524474139666949 & 0.973776293016653 \tabularnewline
24 & 0.0183612712061619 & 0.0367225424123239 & 0.981638728793838 \tabularnewline
25 & 0.0104166186346044 & 0.0208332372692088 & 0.989583381365396 \tabularnewline
26 & 0.099258706195291 & 0.198517412390582 & 0.900741293804709 \tabularnewline
27 & 0.0633999763273431 & 0.126799952654686 & 0.936600023672657 \tabularnewline
28 & 0.0448041902174484 & 0.0896083804348969 & 0.955195809782552 \tabularnewline
29 & 0.0251480385785784 & 0.0502960771571568 & 0.974851961421422 \tabularnewline
30 & 0.0156038041512740 & 0.0312076083025479 & 0.984396195848726 \tabularnewline
31 & 0.0125096185975338 & 0.0250192371950677 & 0.987490381402466 \tabularnewline
32 & 0.153538580982368 & 0.307077161964737 & 0.846461419017632 \tabularnewline
33 & 0.573186573816551 & 0.853626852366899 & 0.426813426183449 \tabularnewline
34 & 0.471755705992637 & 0.943511411985274 & 0.528244294007363 \tabularnewline
35 & 0.595341018258678 & 0.809317963482643 & 0.404658981741322 \tabularnewline
36 & 0.494015564019838 & 0.988031128039677 & 0.505984435980162 \tabularnewline
37 & 0.383924641465449 & 0.767849282930897 & 0.616075358534551 \tabularnewline
38 & 0.316825229536833 & 0.633650459073666 & 0.683174770463167 \tabularnewline
39 & 0.243104417617130 & 0.486208835234261 & 0.75689558238287 \tabularnewline
40 & 0.171897746311778 & 0.343795492623557 & 0.828102253688222 \tabularnewline
41 & 0.135669749713352 & 0.271339499426704 & 0.864330250286648 \tabularnewline
42 & 0.111904218338591 & 0.223808436677182 & 0.888095781661409 \tabularnewline
43 & 0.093481326897028 & 0.186962653794056 & 0.906518673102972 \tabularnewline
\hline
\end{tabular}
%Source: https://freestatistics.org/blog/index.php?pk=25814&T=5

[TABLE]
[ROW][C]Goldfeld-Quandt test for Heteroskedasticity[/C][/ROW]
[ROW][C]p-values[/C][C]Alternative Hypothesis[/C][/ROW]
[ROW][C]breakpoint index[/C][C]greater[/C][C]2-sided[/C][C]less[/C][/ROW]
[ROW][C]17[/C][C]0.198302878458138[/C][C]0.396605756916276[/C][C]0.801697121541862[/C][/ROW]
[ROW][C]18[/C][C]0.0890528385052401[/C][C]0.178105677010480[/C][C]0.91094716149476[/C][/ROW]
[ROW][C]19[/C][C]0.0805258905654684[/C][C]0.161051781130937[/C][C]0.919474109434532[/C][/ROW]
[ROW][C]20[/C][C]0.127085981732430[/C][C]0.254171963464859[/C][C]0.87291401826757[/C][/ROW]
[ROW][C]21[/C][C]0.0982807448182065[/C][C]0.196561489636413[/C][C]0.901719255181794[/C][/ROW]
[ROW][C]22[/C][C]0.0514997079964185[/C][C]0.102999415992837[/C][C]0.948500292003582[/C][/ROW]
[ROW][C]23[/C][C]0.0262237069833475[/C][C]0.0524474139666949[/C][C]0.973776293016653[/C][/ROW]
[ROW][C]24[/C][C]0.0183612712061619[/C][C]0.0367225424123239[/C][C]0.981638728793838[/C][/ROW]
[ROW][C]25[/C][C]0.0104166186346044[/C][C]0.0208332372692088[/C][C]0.989583381365396[/C][/ROW]
[ROW][C]26[/C][C]0.099258706195291[/C][C]0.198517412390582[/C][C]0.900741293804709[/C][/ROW]
[ROW][C]27[/C][C]0.0633999763273431[/C][C]0.126799952654686[/C][C]0.936600023672657[/C][/ROW]
[ROW][C]28[/C][C]0.0448041902174484[/C][C]0.0896083804348969[/C][C]0.955195809782552[/C][/ROW]
[ROW][C]29[/C][C]0.0251480385785784[/C][C]0.0502960771571568[/C][C]0.974851961421422[/C][/ROW]
[ROW][C]30[/C][C]0.0156038041512740[/C][C]0.0312076083025479[/C][C]0.984396195848726[/C][/ROW]
[ROW][C]31[/C][C]0.0125096185975338[/C][C]0.0250192371950677[/C][C]0.987490381402466[/C][/ROW]
[ROW][C]32[/C][C]0.153538580982368[/C][C]0.307077161964737[/C][C]0.846461419017632[/C][/ROW]
[ROW][C]33[/C][C]0.573186573816551[/C][C]0.853626852366899[/C][C]0.426813426183449[/C][/ROW]
[ROW][C]34[/C][C]0.471755705992637[/C][C]0.943511411985274[/C][C]0.528244294007363[/C][/ROW]
[ROW][C]35[/C][C]0.595341018258678[/C][C]0.809317963482643[/C][C]0.404658981741322[/C][/ROW]
[ROW][C]36[/C][C]0.494015564019838[/C][C]0.988031128039677[/C][C]0.505984435980162[/C][/ROW]
[ROW][C]37[/C][C]0.383924641465449[/C][C]0.767849282930897[/C][C]0.616075358534551[/C][/ROW]
[ROW][C]38[/C][C]0.316825229536833[/C][C]0.633650459073666[/C][C]0.683174770463167[/C][/ROW]
[ROW][C]39[/C][C]0.243104417617130[/C][C]0.486208835234261[/C][C]0.75689558238287[/C][/ROW]
[ROW][C]40[/C][C]0.171897746311778[/C][C]0.343795492623557[/C][C]0.828102253688222[/C][/ROW]
[ROW][C]41[/C][C]0.135669749713352[/C][C]0.271339499426704[/C][C]0.864330250286648[/C][/ROW]
[ROW][C]42[/C][C]0.111904218338591[/C][C]0.223808436677182[/C][C]0.888095781661409[/C][/ROW]
[ROW][C]43[/C][C]0.093481326897028[/C][C]0.186962653794056[/C][C]0.906518673102972[/C][/ROW]
[/TABLE]
Source: https://freestatistics.org/blog/index.php?pk=25814&T=5

Globally Unique Identifier (entire table): ba.freestatistics.org/blog/index.php?pk=25814&T=5

As an alternative you can also use a QR Code:  

The GUIDs for individual cells are displayed in the table below:

Goldfeld-Quandt test for Heteroskedasticity
p-valuesAlternative Hypothesis
breakpoint indexgreater2-sidedless
170.1983028784581380.3966057569162760.801697121541862
180.08905283850524010.1781056770104800.91094716149476
190.08052589056546840.1610517811309370.919474109434532
200.1270859817324300.2541719634648590.87291401826757
210.09828074481820650.1965614896364130.901719255181794
220.05149970799641850.1029994159928370.948500292003582
230.02622370698334750.05244741396669490.973776293016653
240.01836127120616190.03672254241232390.981638728793838
250.01041661863460440.02083323726920880.989583381365396
260.0992587061952910.1985174123905820.900741293804709
270.06339997632734310.1267999526546860.936600023672657
280.04480419021744840.08960838043489690.955195809782552
290.02514803857857840.05029607715715680.974851961421422
300.01560380415127400.03120760830254790.984396195848726
310.01250961859753380.02501923719506770.987490381402466
320.1535385809823680.3070771619647370.846461419017632
330.5731865738165510.8536268523668990.426813426183449
340.4717557059926370.9435114119852740.528244294007363
350.5953410182586780.8093179634826430.404658981741322
360.4940155640198380.9880311280396770.505984435980162
370.3839246414654490.7678492829308970.616075358534551
380.3168252295368330.6336504590736660.683174770463167
390.2431044176171300.4862088352342610.75689558238287
400.1718977463117780.3437954926235570.828102253688222
410.1356697497133520.2713394994267040.864330250286648
420.1119042183385910.2238084366771820.888095781661409
430.0934813268970280.1869626537940560.906518673102972


Meta Analysis of Goldfeld-Quandt test for Heteroskedasticity
Description# significant tests% significant testsOK/NOK
1% type I error level00OK
5% type I error level40.148148148148148NOK
10% type I error level70.259259259259259NOK

\begin{tabular}{lllllllll}
\hline
Meta Analysis of Goldfeld-Quandt test for Heteroskedasticity \tabularnewline
Description & # significant tests & % significant tests & OK/NOK \tabularnewline
1% type I error level & 0 & 0 & OK \tabularnewline
5% type I error level & 4 & 0.148148148148148 & NOK \tabularnewline
10% type I error level & 7 & 0.259259259259259 & NOK \tabularnewline
\hline
\end{tabular}
%Source: https://freestatistics.org/blog/index.php?pk=25814&T=6

[TABLE]
[ROW][C]Meta Analysis of Goldfeld-Quandt test for Heteroskedasticity[/C][/ROW]
[ROW][C]Description[/C][C]# significant tests[/C][C]% significant tests[/C][C]OK/NOK[/C][/ROW]
[ROW][C]1% type I error level[/C][C]0[/C][C]0[/C][C]OK[/C][/ROW]
[ROW][C]5% type I error level[/C][C]4[/C][C]0.148148148148148[/C][C]NOK[/C][/ROW]
[ROW][C]10% type I error level[/C][C]7[/C][C]0.259259259259259[/C][C]NOK[/C][/ROW]
[/TABLE]
Source: https://freestatistics.org/blog/index.php?pk=25814&T=6

Globally Unique Identifier (entire table): ba.freestatistics.org/blog/index.php?pk=25814&T=6

As an alternative you can also use a QR Code:  

The GUIDs for individual cells are displayed in the table below:

Meta Analysis of Goldfeld-Quandt test for Heteroskedasticity
Description# significant tests% significant testsOK/NOK
1% type I error level00OK
5% type I error level40.148148148148148NOK
10% type I error level70.259259259259259NOK


Parameters (Session):
par1 = 1 ; par2 = Include Monthly Dummies ; par3 = Linear Trend ;
Parameters (R input):
par1 = 1 ; par2 = Include Monthly Dummies ; par3 = Linear Trend ;
R code (references can be found in the software module):
library(lattice)
library(lmtest)
n25 <- 25 #minimum number of obs. for Goldfeld-Quandt test
par1 <- as.numeric(par1)
x <- t(y)
k <- length(x[1,])
n <- length(x[,1])
x1 <- cbind(x[,par1], x[,1:k!=par1])
mycolnames <- c(colnames(x)[par1], colnames(x)[1:k!=par1])
colnames(x1) <- mycolnames #colnames(x)[par1]
x <- x1
if (par3 == 'First Differences'){
x2 <- array(0, dim=c(n-1,k), dimnames=list(1:(n-1), paste('(1-B)',colnames(x),sep='')))
for (i in 1:n-1) {
for (j in 1:k) {
x2[i,j] <- x[i+1,j] - x[i,j]
}
}
x <- x2
}
if (par2 == 'Include Monthly Dummies'){
x2 <- array(0, dim=c(n,11), dimnames=list(1:n, paste('M', seq(1:11), sep ='')))
for (i in 1:11){
x2[seq(i,n,12),i] <- 1
}
x <- cbind(x, x2)
}
if (par2 == 'Include Quarterly Dummies'){
x2 <- array(0, dim=c(n,3), dimnames=list(1:n, paste('Q', seq(1:3), sep ='')))
for (i in 1:3){
x2[seq(i,n,4),i] <- 1
}
x <- cbind(x, x2)
}
k <- length(x[1,])
if (par3 == 'Linear Trend'){
x <- cbind(x, c(1:n))
colnames(x)[k+1] <- 't'
}
x
k <- length(x[1,])
df <- as.data.frame(x)
(mylm <- lm(df))
(mysum <- summary(mylm))
if (n > n25) {
kp3 <- k + 3
nmkm3 <- n - k - 3
gqarr <- array(NA, dim=c(nmkm3-kp3+1,3))
numgqtests <- 0
numsignificant1 <- 0
numsignificant5 <- 0
numsignificant10 <- 0
for (mypoint in kp3:nmkm3) {
j <- 0
numgqtests <- numgqtests + 1
for (myalt in c('greater', 'two.sided', 'less')) {
j <- j + 1
gqarr[mypoint-kp3+1,j] <- gqtest(mylm, point=mypoint, alternative=myalt)$p.value
}
if (gqarr[mypoint-kp3+1,2] < 0.01) numsignificant1 <- numsignificant1 + 1
if (gqarr[mypoint-kp3+1,2] < 0.05) numsignificant5 <- numsignificant5 + 1
if (gqarr[mypoint-kp3+1,2] < 0.10) numsignificant10 <- numsignificant10 + 1
}
gqarr
}
bitmap(file='test0.png')
plot(x[,1], type='l', main='Actuals and Interpolation', ylab='value of Actuals and Interpolation (dots)', xlab='time or index')
points(x[,1]-mysum$resid)
grid()
dev.off()
bitmap(file='test1.png')
plot(mysum$resid, type='b', pch=19, main='Residuals', ylab='value of Residuals', xlab='time or index')
grid()
dev.off()
bitmap(file='test2.png')
hist(mysum$resid, main='Residual Histogram', xlab='values of Residuals')
grid()
dev.off()
bitmap(file='test3.png')
densityplot(~mysum$resid,col='black',main='Residual Density Plot', xlab='values of Residuals')
dev.off()
bitmap(file='test4.png')
qqnorm(mysum$resid, main='Residual Normal Q-Q Plot')
qqline(mysum$resid)
grid()
dev.off()
(myerror <- as.ts(mysum$resid))
bitmap(file='test5.png')
dum <- cbind(lag(myerror,k=1),myerror)
dum
dum1 <- dum[2:length(myerror),]
dum1
z <- as.data.frame(dum1)
z
plot(z,main=paste('Residual Lag plot, lowess, and regression line'), ylab='values of Residuals', xlab='lagged values of Residuals')
lines(lowess(z))
abline(lm(z))
grid()
dev.off()
bitmap(file='test6.png')
acf(mysum$resid, lag.max=length(mysum$resid)/2, main='Residual Autocorrelation Function')
grid()
dev.off()
bitmap(file='test7.png')
pacf(mysum$resid, lag.max=length(mysum$resid)/2, main='Residual Partial Autocorrelation Function')
grid()
dev.off()
bitmap(file='test8.png')
opar <- par(mfrow = c(2,2), oma = c(0, 0, 1.1, 0))
plot(mylm, las = 1, sub='Residual Diagnostics')
par(opar)
dev.off()
if (n > n25) {
bitmap(file='test9.png')
plot(kp3:nmkm3,gqarr[,2], main='Goldfeld-Quandt test',ylab='2-sided p-value',xlab='breakpoint')
grid()
dev.off()
}
load(file='createtable')
a<-table.start()
a<-table.row.start(a)
a<-table.element(a, 'Multiple Linear Regression - Estimated Regression Equation', 1, TRUE)
a<-table.row.end(a)
myeq <- colnames(x)[1]
myeq <- paste(myeq, '[t] = ', sep='')
for (i in 1:k){
if (mysum$coefficients[i,1] > 0) myeq <- paste(myeq, '+', '')
myeq <- paste(myeq, mysum$coefficients[i,1], sep=' ')
if (rownames(mysum$coefficients)[i] != '(Intercept)') {
myeq <- paste(myeq, rownames(mysum$coefficients)[i], sep='')
if (rownames(mysum$coefficients)[i] != 't') myeq <- paste(myeq, '[t]', sep='')
}
}
myeq <- paste(myeq, ' + e[t]')
a<-table.row.start(a)
a<-table.element(a, myeq)
a<-table.row.end(a)
a<-table.end(a)
table.save(a,file='mytable1.tab')
a<-table.start()
a<-table.row.start(a)
a<-table.element(a,hyperlink('ols1.htm','Multiple Linear Regression - Ordinary Least Squares',''), 6, TRUE)
a<-table.row.end(a)
a<-table.row.start(a)
a<-table.element(a,'Variable',header=TRUE)
a<-table.element(a,'Parameter',header=TRUE)
a<-table.element(a,'S.D.',header=TRUE)
a<-table.element(a,'T-STAT
H0: parameter = 0',header=TRUE)
a<-table.element(a,'2-tail p-value',header=TRUE)
a<-table.element(a,'1-tail p-value',header=TRUE)
a<-table.row.end(a)
for (i in 1:k){
a<-table.row.start(a)
a<-table.element(a,rownames(mysum$coefficients)[i],header=TRUE)
a<-table.element(a,mysum$coefficients[i,1])
a<-table.element(a, round(mysum$coefficients[i,2],6))
a<-table.element(a, round(mysum$coefficients[i,3],4))
a<-table.element(a, round(mysum$coefficients[i,4],6))
a<-table.element(a, round(mysum$coefficients[i,4]/2,6))
a<-table.row.end(a)
}
a<-table.end(a)
table.save(a,file='mytable2.tab')
a<-table.start()
a<-table.row.start(a)
a<-table.element(a, 'Multiple Linear Regression - Regression Statistics', 2, TRUE)
a<-table.row.end(a)
a<-table.row.start(a)
a<-table.element(a, 'Multiple R',1,TRUE)
a<-table.element(a, sqrt(mysum$r.squared))
a<-table.row.end(a)
a<-table.row.start(a)
a<-table.element(a, 'R-squared',1,TRUE)
a<-table.element(a, mysum$r.squared)
a<-table.row.end(a)
a<-table.row.start(a)
a<-table.element(a, 'Adjusted R-squared',1,TRUE)
a<-table.element(a, mysum$adj.r.squared)
a<-table.row.end(a)
a<-table.row.start(a)
a<-table.element(a, 'F-TEST (value)',1,TRUE)
a<-table.element(a, mysum$fstatistic[1])
a<-table.row.end(a)
a<-table.row.start(a)
a<-table.element(a, 'F-TEST (DF numerator)',1,TRUE)
a<-table.element(a, mysum$fstatistic[2])
a<-table.row.end(a)
a<-table.row.start(a)
a<-table.element(a, 'F-TEST (DF denominator)',1,TRUE)
a<-table.element(a, mysum$fstatistic[3])
a<-table.row.end(a)
a<-table.row.start(a)
a<-table.element(a, 'p-value',1,TRUE)
a<-table.element(a, 1-pf(mysum$fstatistic[1],mysum$fstatistic[2],mysum$fstatistic[3]))
a<-table.row.end(a)
a<-table.row.start(a)
a<-table.element(a, 'Multiple Linear Regression - Residual Statistics', 2, TRUE)
a<-table.row.end(a)
a<-table.row.start(a)
a<-table.element(a, 'Residual Standard Deviation',1,TRUE)
a<-table.element(a, mysum$sigma)
a<-table.row.end(a)
a<-table.row.start(a)
a<-table.element(a, 'Sum Squared Residuals',1,TRUE)
a<-table.element(a, sum(myerror*myerror))
a<-table.row.end(a)
a<-table.end(a)
table.save(a,file='mytable3.tab')
a<-table.start()
a<-table.row.start(a)
a<-table.element(a, 'Multiple Linear Regression - Actuals, Interpolation, and Residuals', 4, TRUE)
a<-table.row.end(a)
a<-table.row.start(a)
a<-table.element(a, 'Time or Index', 1, TRUE)
a<-table.element(a, 'Actuals', 1, TRUE)
a<-table.element(a, 'Interpolation
Forecast', 1, TRUE)
a<-table.element(a, 'Residuals
Prediction Error', 1, TRUE)
a<-table.row.end(a)
for (i in 1:n) {
a<-table.row.start(a)
a<-table.element(a,i, 1, TRUE)
a<-table.element(a,x[i])
a<-table.element(a,x[i]-mysum$resid[i])
a<-table.element(a,mysum$resid[i])
a<-table.row.end(a)
}
a<-table.end(a)
table.save(a,file='mytable4.tab')
if (n > n25) {
a<-table.start()
a<-table.row.start(a)
a<-table.element(a,'Goldfeld-Quandt test for Heteroskedasticity',4,TRUE)
a<-table.row.end(a)
a<-table.row.start(a)
a<-table.element(a,'p-values',header=TRUE)
a<-table.element(a,'Alternative Hypothesis',3,header=TRUE)
a<-table.row.end(a)
a<-table.row.start(a)
a<-table.element(a,'breakpoint index',header=TRUE)
a<-table.element(a,'greater',header=TRUE)
a<-table.element(a,'2-sided',header=TRUE)
a<-table.element(a,'less',header=TRUE)
a<-table.row.end(a)
for (mypoint in kp3:nmkm3) {
a<-table.row.start(a)
a<-table.element(a,mypoint,header=TRUE)
a<-table.element(a,gqarr[mypoint-kp3+1,1])
a<-table.element(a,gqarr[mypoint-kp3+1,2])
a<-table.element(a,gqarr[mypoint-kp3+1,3])
a<-table.row.end(a)
}
a<-table.end(a)
table.save(a,file='mytable5.tab')
a<-table.start()
a<-table.row.start(a)
a<-table.element(a,'Meta Analysis of Goldfeld-Quandt test for Heteroskedasticity',4,TRUE)
a<-table.row.end(a)
a<-table.row.start(a)
a<-table.element(a,'Description',header=TRUE)
a<-table.element(a,'# significant tests',header=TRUE)
a<-table.element(a,'% significant tests',header=TRUE)
a<-table.element(a,'OK/NOK',header=TRUE)
a<-table.row.end(a)
a<-table.row.start(a)
a<-table.element(a,'1% type I error level',header=TRUE)
a<-table.element(a,numsignificant1)
a<-table.element(a,numsignificant1/numgqtests)
if (numsignificant1/numgqtests < 0.01) dum <- 'OK' else dum <- 'NOK'
a<-table.element(a,dum)
a<-table.row.end(a)
a<-table.row.start(a)
a<-table.element(a,'5% type I error level',header=TRUE)
a<-table.element(a,numsignificant5)
a<-table.element(a,numsignificant5/numgqtests)
if (numsignificant5/numgqtests < 0.05) dum <- 'OK' else dum <- 'NOK'
a<-table.element(a,dum)
a<-table.row.end(a)
a<-table.row.start(a)
a<-table.element(a,'10% type I error level',header=TRUE)
a<-table.element(a,numsignificant10)
a<-table.element(a,numsignificant10/numgqtests)
if (numsignificant10/numgqtests < 0.1) dum <- 'OK' else dum <- 'NOK'
a<-table.element(a,dum)
a<-table.row.end(a)
a<-table.end(a)
table.save(a,file='mytable6.tab')
}