Free Statistics

of Irreproducible Research!

Author's title

Author*Unverified author*
R Software Modulerwasp_multipleregression.wasp
Title produced by softwareMultiple Regression
Date of computationThu, 27 Nov 2008 07:07:44 -0700
Cite this page as followsStatistical Computations at FreeStatistics.org, Office for Research Development and Education, URL https://freestatistics.org/blog/index.php?v=date/2008/Nov/27/t1227795053smd8igim4w3sq3e.htm/, Retrieved Sun, 19 May 2024 10:20:18 +0000
Statistical Computations at FreeStatistics.org, Office for Research Development and Education, URL https://freestatistics.org/blog/index.php?pk=25813, Retrieved Sun, 19 May 2024 10:20:18 +0000
QR Codes:

Original text written by user:
IsPrivate?No (this computation is public)
User-defined keywords
Estimated Impact128
Family? (F = Feedback message, R = changed R code, M = changed R Module, P = changed Parameters, D = changed Data)
F       [Multiple Regression] [Case Seatbelt law Q3] [2008-11-27 14:07:44] [74a138e5b32af267311b5ad4cd13bf7e] [Current]
Feedback Forum
2008-12-01 17:54:06 [Kevin Vermeiren] [reply
Multiple Linear Regression - Ordinary Least Squares:
De verklaring van de gebruikte symbolen in de tabellen is correct. Toch ontbreekt er hier de variabele die door een 0 ofwel een 1 wordt voorgesteld cfr. Seatbelt law -226,39). Dus er ontbreekt een waarde die bij de omzet moet worden bijgeteld wanneer de financiële crisis zich voordoet.

Multiple Linear Regression - Regression Statistics:
We houden hier geen rekening met het feit dat er voorgaand een fout in de berekening zat. Hier kijken we best naar de “adjusted r-squared” waarde. Deze is ongeveer 91% dit wil zeggen dat er 91% van de schommelingen door het model worden verklaard. Aan de hand van de p-waarde kunnen we vaststellen dat dit niet toevallig is (p-waarde kleiner dan 0,05). Bijgevolg kunnen we zeggen dat dit al een redelijk goed model is. Toch nog eens vermelden dat er hier geen rekening werd gehouden met de voorgaande fout.

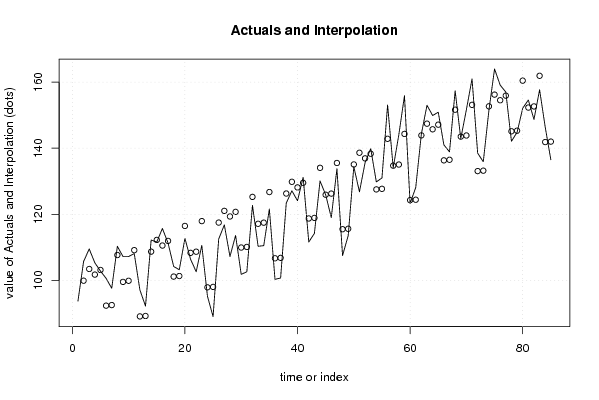
Actuals and interpolation:
De conclusie van de student is correct. We zien inderdaad een stijgende trend. Het niveauverschil waarvan sprake op het einde van de grafiek is niet zo uitgesproken. Normaal zou men, met een financiële crisis, toch mogen verwachten dat dit meer uitgesproken zou zijn.

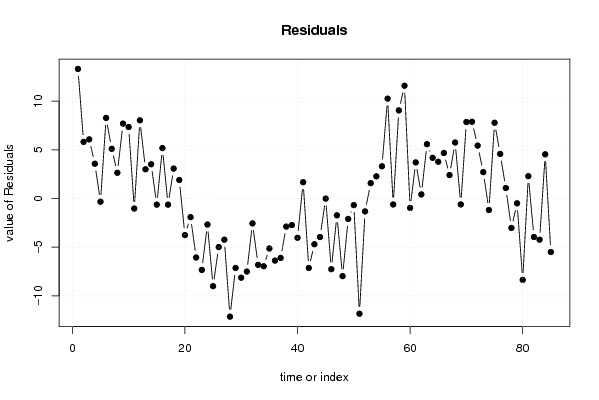
Residuals:
De student geeft een zeer beperkt antwoord. Er wordt niets gezegd over wat de grafiek voorstelt. De grafiek geeft ons een beeld van de schommelingen van de voorspellingsfouten over de verschillende periodes heen. Om een goed model te hebben moet er aan volgende assumptie voldaan zijn: het gemiddelde van de voorspellingsfouten moet constant en gelijk aan 0 zijn. Uit de tabel blijkt dat dit duidelijk niet zo is. De student vermeldt dan terecht dat het model nog niet zo goed is.

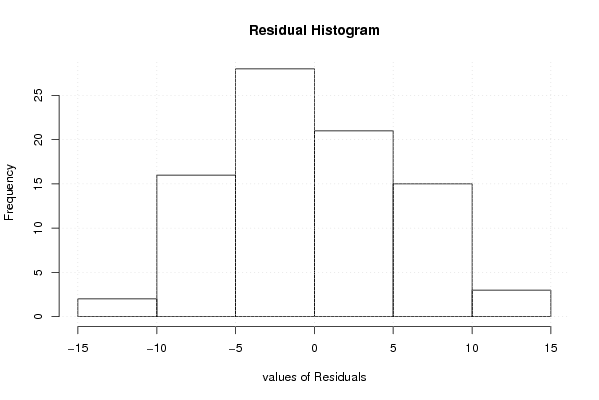
Residuals histogram:
De conclusie van de student is correct namelijk dat het histogram vrij degelijk normaal verdeeld is maar nog niet perfect. Het klopt ook dat er een rechtse scheefheid optreedt. Er is dus nog werk aan het model.

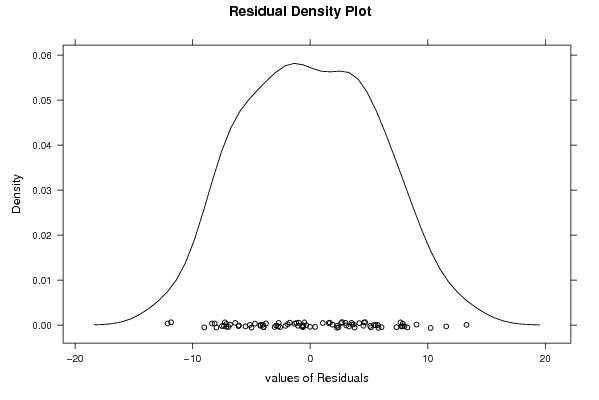
Residuals density plot:
Ook hier heeft de student een juiste conclusie geformuleerd. Het klopt inderdaad dat er een vrij goede normaal verdeling zichtbaar is maar dat deze nog niet met de theoretishe normaalverdeling overeenkomt. De inzakking bovenaan toont dit aan. Bijgevolg kunnen we ook uit deze grafiek concluderen dat het model nog niet optimaal is.

Residual normal q-q plot:
De conclusie van de student is hier geheel correct. Om een normaalverdeling van de gegevens te verkrijgen dienen de quantiles ervan overeen te komen met de quantiles van de theoretische normaalverdeling. Uit de grafiek blijkt inderdaad dat centraal in de figuur de quantiles goed overeenkomen maar dat er aan de staarten er nog enkele extremen voorkomen. Bijgevolg stelt de student terecht vast dat de voorspellingsfouten niet geheel normaal verdeeld zijn. Er is dus nog werk aan het model.

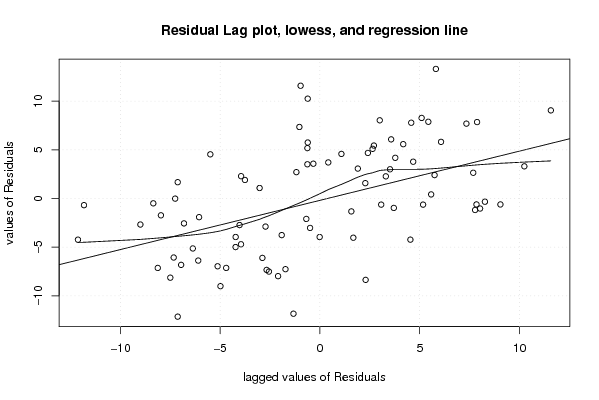
lag plot:
De conclusie van de student is hier echter fout. Ook wordt er niets over de werking van de grafiek vermeld. De grafiek geeft het verband weer tussen de voorspellingsfouten van nu en die van vorige maand. Uit de plot blijkt dat er toch een lichte positieve correlatie bestaat. Hieruit kunnen we dan concluderen dat er een voorspelbaarheid is.

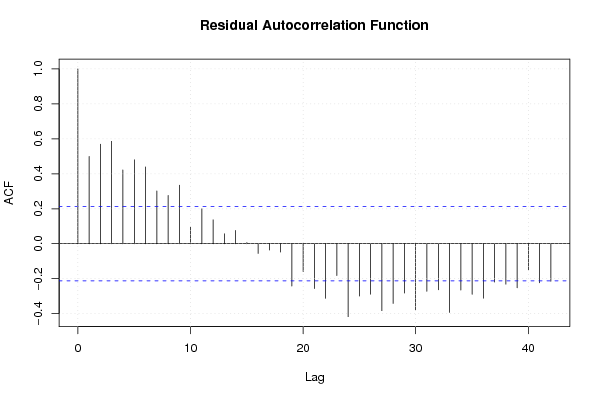
Residual autocorrelation function:
De student vermeldt ook hier niets over de werking van de plot. De grafiek is opgebouwd uit verticale lijnen,die de voorspellingsfouten weergeven, en blauwe stippellijnen, die het 95% betrouwbaarheidsinterval, voorstellen. Indien de verticale lijnen buiten het betrouwbaarheidsinterval vallen, wil dit zeggen dat de voorspellingsfouten significant verschillend (niet door toeval verklaarbaar) zijn. Verder had er ook vermeld mogen worden dat er geen patroon waarneembaar is. We kunnen dus zeggen dat de assumptie (voor een goed model) voldaan is.

conclusie:
Als algemene conclusie kunnen we stellen dat (zonder rekening te houden met de fout): het model nog niet goed is. Voor een goed model te verkrijgen moeten er 2 assumpties voldaan zijn, namelijk: het gemiddelde van de voorspellingsfouten moet constant en gelijk aan 0 zijn. Uit grafiek 2 blijkt duidelijk dat dit niet het geval is. Verder mag er geen patroon of autocorrelatie zijn. Kijken we naar grafiek 7 is het duidelijk dat de assumptie hier wel voldaan is. Het model kan dus nog verbeterd worden.

Post a new message
Dataseries X:
93.7
105.7
109.5
105.3
102.8
100.6
97.6
110.3
107.2
107.2
108.1
97.1
92.2
112.2
111.6
115.7
111.3
104.2
103.2
112.7
106.4
102.6
110.6
95.2
89
112.5
116.8
107.2
113.6
101.8
102.6
122.7
110.3
110.5
121.6
100.3
100.7
123.4
127.1
124.1
131.2
111.6
114.2
130.1
125.9
119
133.8
107.5
113.5
134.4
126.8
135.6
139.9
129.8
131
153.1
134.1
144.1
155.9
123.3
128.1
144.3
153
149.9
150.9
141
138.9
157.4
142.9
151.7
161
138.5
135.9
151.5
164
159.1
157
142.1
144.8
152.1
154.6
148.7
157.7
146.4
136.5


Summary of computational transaction
Raw Inputview raw input (R code)
Raw Outputview raw output of R engine
Computing time6 seconds
R Server'Sir Ronald Aylmer Fisher' @ 193.190.124.24

\begin{tabular}{lllllllll}
\hline
Summary of computational transaction \tabularnewline
Raw Input & view raw input (R code)  \tabularnewline
Raw Output & view raw output of R engine  \tabularnewline
Computing time & 6 seconds \tabularnewline
R Server & 'Sir Ronald Aylmer Fisher' @ 193.190.124.24 \tabularnewline
\hline
\end{tabular}
%Source: https://freestatistics.org/blog/index.php?pk=25813&T=0

[TABLE]
[ROW][C]Summary of computational transaction[/C][/ROW]
[ROW][C]Raw Input[/C][C]view raw input (R code) [/C][/ROW]
[ROW][C]Raw Output[/C][C]view raw output of R engine [/C][/ROW]
[ROW][C]Computing time[/C][C]6 seconds[/C][/ROW]
[ROW][C]R Server[/C][C]'Sir Ronald Aylmer Fisher' @ 193.190.124.24[/C][/ROW]
[/TABLE]
Source: https://freestatistics.org/blog/index.php?pk=25813&T=0

Globally Unique Identifier (entire table): ba.freestatistics.org/blog/index.php?pk=25813&T=0

As an alternative you can also use a QR Code:  

The GUIDs for individual cells are displayed in the table below:

Summary of computational transaction
Raw Inputview raw input (R code)
Raw Outputview raw output of R engine
Computing time6 seconds
R Server'Sir Ronald Aylmer Fisher' @ 193.190.124.24


Multiple Linear Regression - Estimated Regression Equation
omzet[t] = + 80.276 -0.605238095238104M1[t] + 18.1466666666667M2[t] + 20.9562857142857M3[t] + 18.5230476190476M4[t] + 19.1898095238095M5[t] + 7.65657142857143M6[t] + 7.0947619047619M7[t] + 21.5186666666667M8[t] + 12.6425714285714M9[t] + 12.2521904761905M10[t] + 20.7903809523809M11[t] + 0.733238095238095t + e[t]

\begin{tabular}{lllllllll}
\hline
Multiple Linear Regression - Estimated Regression Equation \tabularnewline
omzet[t] =  +  80.276 -0.605238095238104M1[t] +  18.1466666666667M2[t] +  20.9562857142857M3[t] +  18.5230476190476M4[t] +  19.1898095238095M5[t] +  7.65657142857143M6[t] +  7.0947619047619M7[t] +  21.5186666666667M8[t] +  12.6425714285714M9[t] +  12.2521904761905M10[t] +  20.7903809523809M11[t] +  0.733238095238095t  + e[t] \tabularnewline
\hline
\end{tabular}
%Source: https://freestatistics.org/blog/index.php?pk=25813&T=1

[TABLE]
[ROW][C]Multiple Linear Regression - Estimated Regression Equation[/C][/ROW]
[ROW][C]omzet[t] =  +  80.276 -0.605238095238104M1[t] +  18.1466666666667M2[t] +  20.9562857142857M3[t] +  18.5230476190476M4[t] +  19.1898095238095M5[t] +  7.65657142857143M6[t] +  7.0947619047619M7[t] +  21.5186666666667M8[t] +  12.6425714285714M9[t] +  12.2521904761905M10[t] +  20.7903809523809M11[t] +  0.733238095238095t  + e[t][/C][/ROW]
[/TABLE]
Source: https://freestatistics.org/blog/index.php?pk=25813&T=1

Globally Unique Identifier (entire table): ba.freestatistics.org/blog/index.php?pk=25813&T=1

As an alternative you can also use a QR Code:  

The GUIDs for individual cells are displayed in the table below:

Multiple Linear Regression - Estimated Regression Equation
omzet[t] = + 80.276 -0.605238095238104M1[t] + 18.1466666666667M2[t] + 20.9562857142857M3[t] + 18.5230476190476M4[t] + 19.1898095238095M5[t] + 7.65657142857143M6[t] + 7.0947619047619M7[t] + 21.5186666666667M8[t] + 12.6425714285714M9[t] + 12.2521904761905M10[t] + 20.7903809523809M11[t] + 0.733238095238095t + e[t]


Multiple Linear Regression - Ordinary Least Squares
VariableParameterS.D.T-STATH0: parameter = 02-tail p-value1-tail p-value
(Intercept)80.2762.63294530.48900
M1-0.6052380952381043.140923-0.19270.8477410.42387
M218.14666666666673.2521655.579900
M320.95628571428573.2500346.44800
M418.52304761904763.2481265.702700
M519.18980952380953.2464415.91100
M67.656571428571433.244982.35950.0210140.010507
M77.09476190476193.2437442.18720.0319760.015988
M821.51866666666673.2427326.63600
M912.64257142857143.2419443.89970.0002140.000107
M1012.25219047619053.2413823.77990.0003210.00016
M1120.79038095238093.2410446.414700
t0.7332380952380950.02700827.149200

\begin{tabular}{lllllllll}
\hline
Multiple Linear Regression - Ordinary Least Squares \tabularnewline
Variable & Parameter & S.D. & T-STATH0: parameter = 0 & 2-tail p-value & 1-tail p-value \tabularnewline
(Intercept) & 80.276 & 2.632945 & 30.489 & 0 & 0 \tabularnewline
M1 & -0.605238095238104 & 3.140923 & -0.1927 & 0.847741 & 0.42387 \tabularnewline
M2 & 18.1466666666667 & 3.252165 & 5.5799 & 0 & 0 \tabularnewline
M3 & 20.9562857142857 & 3.250034 & 6.448 & 0 & 0 \tabularnewline
M4 & 18.5230476190476 & 3.248126 & 5.7027 & 0 & 0 \tabularnewline
M5 & 19.1898095238095 & 3.246441 & 5.911 & 0 & 0 \tabularnewline
M6 & 7.65657142857143 & 3.24498 & 2.3595 & 0.021014 & 0.010507 \tabularnewline
M7 & 7.0947619047619 & 3.243744 & 2.1872 & 0.031976 & 0.015988 \tabularnewline
M8 & 21.5186666666667 & 3.242732 & 6.636 & 0 & 0 \tabularnewline
M9 & 12.6425714285714 & 3.241944 & 3.8997 & 0.000214 & 0.000107 \tabularnewline
M10 & 12.2521904761905 & 3.241382 & 3.7799 & 0.000321 & 0.00016 \tabularnewline
M11 & 20.7903809523809 & 3.241044 & 6.4147 & 0 & 0 \tabularnewline
t & 0.733238095238095 & 0.027008 & 27.1492 & 0 & 0 \tabularnewline
\hline
\end{tabular}
%Source: https://freestatistics.org/blog/index.php?pk=25813&T=2

[TABLE]
[ROW][C]Multiple Linear Regression - Ordinary Least Squares[/C][/ROW]
[ROW][C]Variable[/C][C]Parameter[/C][C]S.D.[/C][C]T-STATH0: parameter = 0[/C][C]2-tail p-value[/C][C]1-tail p-value[/C][/ROW]
[ROW][C](Intercept)[/C][C]80.276[/C][C]2.632945[/C][C]30.489[/C][C]0[/C][C]0[/C][/ROW]
[ROW][C]M1[/C][C]-0.605238095238104[/C][C]3.140923[/C][C]-0.1927[/C][C]0.847741[/C][C]0.42387[/C][/ROW]
[ROW][C]M2[/C][C]18.1466666666667[/C][C]3.252165[/C][C]5.5799[/C][C]0[/C][C]0[/C][/ROW]
[ROW][C]M3[/C][C]20.9562857142857[/C][C]3.250034[/C][C]6.448[/C][C]0[/C][C]0[/C][/ROW]
[ROW][C]M4[/C][C]18.5230476190476[/C][C]3.248126[/C][C]5.7027[/C][C]0[/C][C]0[/C][/ROW]
[ROW][C]M5[/C][C]19.1898095238095[/C][C]3.246441[/C][C]5.911[/C][C]0[/C][C]0[/C][/ROW]
[ROW][C]M6[/C][C]7.65657142857143[/C][C]3.24498[/C][C]2.3595[/C][C]0.021014[/C][C]0.010507[/C][/ROW]
[ROW][C]M7[/C][C]7.0947619047619[/C][C]3.243744[/C][C]2.1872[/C][C]0.031976[/C][C]0.015988[/C][/ROW]
[ROW][C]M8[/C][C]21.5186666666667[/C][C]3.242732[/C][C]6.636[/C][C]0[/C][C]0[/C][/ROW]
[ROW][C]M9[/C][C]12.6425714285714[/C][C]3.241944[/C][C]3.8997[/C][C]0.000214[/C][C]0.000107[/C][/ROW]
[ROW][C]M10[/C][C]12.2521904761905[/C][C]3.241382[/C][C]3.7799[/C][C]0.000321[/C][C]0.00016[/C][/ROW]
[ROW][C]M11[/C][C]20.7903809523809[/C][C]3.241044[/C][C]6.4147[/C][C]0[/C][C]0[/C][/ROW]
[ROW][C]t[/C][C]0.733238095238095[/C][C]0.027008[/C][C]27.1492[/C][C]0[/C][C]0[/C][/ROW]
[/TABLE]
Source: https://freestatistics.org/blog/index.php?pk=25813&T=2

Globally Unique Identifier (entire table): ba.freestatistics.org/blog/index.php?pk=25813&T=2

As an alternative you can also use a QR Code:  

The GUIDs for individual cells are displayed in the table below:

Multiple Linear Regression - Ordinary Least Squares
VariableParameterS.D.T-STATH0: parameter = 02-tail p-value1-tail p-value
(Intercept)80.2762.63294530.48900
M1-0.6052380952381043.140923-0.19270.8477410.42387
M218.14666666666673.2521655.579900
M320.95628571428573.2500346.44800
M418.52304761904763.2481265.702700
M519.18980952380953.2464415.91100
M67.656571428571433.244982.35950.0210140.010507
M77.09476190476193.2437442.18720.0319760.015988
M821.51866666666673.2427326.63600
M912.64257142857143.2419443.89970.0002140.000107
M1012.25219047619053.2413823.77990.0003210.00016
M1120.79038095238093.2410446.414700
t0.7332380952380950.02700827.149200


Multiple Linear Regression - Regression Statistics
Multiple R0.960511433070904
R-squared0.922582213059921
Adjusted R-squared0.909679248569908
F-TEST (value)71.5015695636452
F-TEST (DF numerator)12
F-TEST (DF denominator)72
p-value0
Multiple Linear Regression - Residual Statistics
Residual Standard Deviation6.0632278322715
Sum Squared Residuals2646.91668571429

\begin{tabular}{lllllllll}
\hline
Multiple Linear Regression - Regression Statistics \tabularnewline
Multiple R & 0.960511433070904 \tabularnewline
R-squared & 0.922582213059921 \tabularnewline
Adjusted R-squared & 0.909679248569908 \tabularnewline
F-TEST (value) & 71.5015695636452 \tabularnewline
F-TEST (DF numerator) & 12 \tabularnewline
F-TEST (DF denominator) & 72 \tabularnewline
p-value & 0 \tabularnewline
Multiple Linear Regression - Residual Statistics \tabularnewline
Residual Standard Deviation & 6.0632278322715 \tabularnewline
Sum Squared Residuals & 2646.91668571429 \tabularnewline
\hline
\end{tabular}
%Source: https://freestatistics.org/blog/index.php?pk=25813&T=3

[TABLE]
[ROW][C]Multiple Linear Regression - Regression Statistics[/C][/ROW]
[ROW][C]Multiple R[/C][C]0.960511433070904[/C][/ROW]
[ROW][C]R-squared[/C][C]0.922582213059921[/C][/ROW]
[ROW][C]Adjusted R-squared[/C][C]0.909679248569908[/C][/ROW]
[ROW][C]F-TEST (value)[/C][C]71.5015695636452[/C][/ROW]
[ROW][C]F-TEST (DF numerator)[/C][C]12[/C][/ROW]
[ROW][C]F-TEST (DF denominator)[/C][C]72[/C][/ROW]
[ROW][C]p-value[/C][C]0[/C][/ROW]
[ROW][C]Multiple Linear Regression - Residual Statistics[/C][/ROW]
[ROW][C]Residual Standard Deviation[/C][C]6.0632278322715[/C][/ROW]
[ROW][C]Sum Squared Residuals[/C][C]2646.91668571429[/C][/ROW]
[/TABLE]
Source: https://freestatistics.org/blog/index.php?pk=25813&T=3

Globally Unique Identifier (entire table): ba.freestatistics.org/blog/index.php?pk=25813&T=3

As an alternative you can also use a QR Code:  

The GUIDs for individual cells are displayed in the table below:

Multiple Linear Regression - Regression Statistics
Multiple R0.960511433070904
R-squared0.922582213059921
Adjusted R-squared0.909679248569908
F-TEST (value)71.5015695636452
F-TEST (DF numerator)12
F-TEST (DF denominator)72
p-value0
Multiple Linear Regression - Residual Statistics
Residual Standard Deviation6.0632278322715
Sum Squared Residuals2646.91668571429


Multiple Linear Regression - Actuals, Interpolation, and Residuals
Time or IndexActualsInterpolationForecastResidualsPrediction Error
193.780.40413.2960000000000
2105.799.88914285714285.81085714285715
3109.5103.4326.06799999999999
4105.3101.7323.56799999999999
5102.8103.132-0.331999999999998
6100.692.3328.268
797.692.50342857142865.09657142857142
8110.3107.6605714285712.63942857142856
9107.299.51771428571437.68228571428573
10107.299.86057142857147.33942857142857
11108.1109.132-1.03199999999999
1297.189.07485714285718.02514285714285
1392.289.20285714285712.9971428571429
14112.2108.6883.51199999999999
15111.6112.230857142857-0.630857142857143
16115.7110.5308571428575.16914285714286
17111.3111.930857142857-0.630857142857147
18104.2101.1308571428573.06914285714286
19103.2101.3022857142861.89771428571428
20112.7116.459428571429-3.75942857142857
21106.4108.316571428571-1.91657142857142
22102.6108.659428571429-6.05942857142858
23110.6117.930857142857-7.33085714285715
2495.297.8737142857143-2.67371428571428
258998.0017142857143-9.00171428571429
26112.5117.486857142857-4.98685714285715
27116.8121.029714285714-4.22971428571428
28107.2119.329714285714-12.1297142857143
29113.6120.729714285714-7.12971428571429
30101.8109.929714285714-8.12971428571429
31102.6110.101142857143-7.50114285714286
32122.7125.258285714286-2.55828571428571
33110.3117.115428571429-6.81542857142858
34110.5117.458285714286-6.95828571428571
35121.6126.729714285714-5.12971428571429
36100.3106.672571428571-6.37257142857144
37100.7106.800571428571-6.10057142857143
38123.4126.285714285714-2.88571428571428
39127.1129.828571428571-2.72857142857143
40124.1128.128571428571-4.02857142857143
41131.2129.5285714285711.67142857142857
42111.6118.728571428571-7.12857142857143
43114.2118.9-4.7
44130.1134.057142857143-3.95714285714286
45125.9125.914285714286-0.0142857142857130
46119126.257142857143-7.25714285714286
47133.8135.528571428571-1.72857142857141
48107.5115.471428571429-7.97142857142857
49113.5115.599428571429-2.09942857142857
50134.4135.084571428571-0.684571428571427
51126.8138.627428571429-11.8274285714286
52135.6136.927428571429-1.32742857142857
53139.9138.3274285714291.57257142857144
54129.8127.5274285714292.27257142857144
55131127.6988571428573.30114285714286
56153.1142.85610.244
57134.1134.713142857143-0.613142857142862
58144.1135.0569.044
59155.9144.32742857142911.5725714285714
60123.3124.270285714286-0.970285714285722
61128.1124.3982857142863.70171428571428
62144.3143.8834285714290.416571428571444
63153147.4262857142865.57371428571429
64149.9145.7262857142864.1737142857143
65150.9147.1262857142863.77371428571429
66141136.3262857142864.67371428571428
67138.9136.4977142857142.40228571428572
68157.4151.6548571428575.74514285714286
69142.9143.512-0.612000000000001
70151.7143.8548571428577.84514285714285
71161153.1262857142867.87371428571428
72138.5133.0691428571435.43085714285715
73135.9133.1971428571432.70285714285715
74151.5152.682285714286-1.18228571428572
75164156.2251428571437.77485714285715
76159.1154.5251428571434.57485714285714
77157155.9251428571431.07485714285714
78142.1145.125142857143-3.02514285714286
79144.8145.296571428571-0.496571428571425
80152.1160.453714285714-8.35371428571429
81154.6152.3108571428572.28914285714284
82148.7152.653714285714-3.95371428571429
83157.7161.925142857143-4.22514285714288
84146.4141.8684.53200000000001
85136.5141.996-5.496

\begin{tabular}{lllllllll}
\hline
Multiple Linear Regression - Actuals, Interpolation, and Residuals \tabularnewline
Time or Index & Actuals & InterpolationForecast & ResidualsPrediction Error \tabularnewline
1 & 93.7 & 80.404 & 13.2960000000000 \tabularnewline
2 & 105.7 & 99.8891428571428 & 5.81085714285715 \tabularnewline
3 & 109.5 & 103.432 & 6.06799999999999 \tabularnewline
4 & 105.3 & 101.732 & 3.56799999999999 \tabularnewline
5 & 102.8 & 103.132 & -0.331999999999998 \tabularnewline
6 & 100.6 & 92.332 & 8.268 \tabularnewline
7 & 97.6 & 92.5034285714286 & 5.09657142857142 \tabularnewline
8 & 110.3 & 107.660571428571 & 2.63942857142856 \tabularnewline
9 & 107.2 & 99.5177142857143 & 7.68228571428573 \tabularnewline
10 & 107.2 & 99.8605714285714 & 7.33942857142857 \tabularnewline
11 & 108.1 & 109.132 & -1.03199999999999 \tabularnewline
12 & 97.1 & 89.0748571428571 & 8.02514285714285 \tabularnewline
13 & 92.2 & 89.2028571428571 & 2.9971428571429 \tabularnewline
14 & 112.2 & 108.688 & 3.51199999999999 \tabularnewline
15 & 111.6 & 112.230857142857 & -0.630857142857143 \tabularnewline
16 & 115.7 & 110.530857142857 & 5.16914285714286 \tabularnewline
17 & 111.3 & 111.930857142857 & -0.630857142857147 \tabularnewline
18 & 104.2 & 101.130857142857 & 3.06914285714286 \tabularnewline
19 & 103.2 & 101.302285714286 & 1.89771428571428 \tabularnewline
20 & 112.7 & 116.459428571429 & -3.75942857142857 \tabularnewline
21 & 106.4 & 108.316571428571 & -1.91657142857142 \tabularnewline
22 & 102.6 & 108.659428571429 & -6.05942857142858 \tabularnewline
23 & 110.6 & 117.930857142857 & -7.33085714285715 \tabularnewline
24 & 95.2 & 97.8737142857143 & -2.67371428571428 \tabularnewline
25 & 89 & 98.0017142857143 & -9.00171428571429 \tabularnewline
26 & 112.5 & 117.486857142857 & -4.98685714285715 \tabularnewline
27 & 116.8 & 121.029714285714 & -4.22971428571428 \tabularnewline
28 & 107.2 & 119.329714285714 & -12.1297142857143 \tabularnewline
29 & 113.6 & 120.729714285714 & -7.12971428571429 \tabularnewline
30 & 101.8 & 109.929714285714 & -8.12971428571429 \tabularnewline
31 & 102.6 & 110.101142857143 & -7.50114285714286 \tabularnewline
32 & 122.7 & 125.258285714286 & -2.55828571428571 \tabularnewline
33 & 110.3 & 117.115428571429 & -6.81542857142858 \tabularnewline
34 & 110.5 & 117.458285714286 & -6.95828571428571 \tabularnewline
35 & 121.6 & 126.729714285714 & -5.12971428571429 \tabularnewline
36 & 100.3 & 106.672571428571 & -6.37257142857144 \tabularnewline
37 & 100.7 & 106.800571428571 & -6.10057142857143 \tabularnewline
38 & 123.4 & 126.285714285714 & -2.88571428571428 \tabularnewline
39 & 127.1 & 129.828571428571 & -2.72857142857143 \tabularnewline
40 & 124.1 & 128.128571428571 & -4.02857142857143 \tabularnewline
41 & 131.2 & 129.528571428571 & 1.67142857142857 \tabularnewline
42 & 111.6 & 118.728571428571 & -7.12857142857143 \tabularnewline
43 & 114.2 & 118.9 & -4.7 \tabularnewline
44 & 130.1 & 134.057142857143 & -3.95714285714286 \tabularnewline
45 & 125.9 & 125.914285714286 & -0.0142857142857130 \tabularnewline
46 & 119 & 126.257142857143 & -7.25714285714286 \tabularnewline
47 & 133.8 & 135.528571428571 & -1.72857142857141 \tabularnewline
48 & 107.5 & 115.471428571429 & -7.97142857142857 \tabularnewline
49 & 113.5 & 115.599428571429 & -2.09942857142857 \tabularnewline
50 & 134.4 & 135.084571428571 & -0.684571428571427 \tabularnewline
51 & 126.8 & 138.627428571429 & -11.8274285714286 \tabularnewline
52 & 135.6 & 136.927428571429 & -1.32742857142857 \tabularnewline
53 & 139.9 & 138.327428571429 & 1.57257142857144 \tabularnewline
54 & 129.8 & 127.527428571429 & 2.27257142857144 \tabularnewline
55 & 131 & 127.698857142857 & 3.30114285714286 \tabularnewline
56 & 153.1 & 142.856 & 10.244 \tabularnewline
57 & 134.1 & 134.713142857143 & -0.613142857142862 \tabularnewline
58 & 144.1 & 135.056 & 9.044 \tabularnewline
59 & 155.9 & 144.327428571429 & 11.5725714285714 \tabularnewline
60 & 123.3 & 124.270285714286 & -0.970285714285722 \tabularnewline
61 & 128.1 & 124.398285714286 & 3.70171428571428 \tabularnewline
62 & 144.3 & 143.883428571429 & 0.416571428571444 \tabularnewline
63 & 153 & 147.426285714286 & 5.57371428571429 \tabularnewline
64 & 149.9 & 145.726285714286 & 4.1737142857143 \tabularnewline
65 & 150.9 & 147.126285714286 & 3.77371428571429 \tabularnewline
66 & 141 & 136.326285714286 & 4.67371428571428 \tabularnewline
67 & 138.9 & 136.497714285714 & 2.40228571428572 \tabularnewline
68 & 157.4 & 151.654857142857 & 5.74514285714286 \tabularnewline
69 & 142.9 & 143.512 & -0.612000000000001 \tabularnewline
70 & 151.7 & 143.854857142857 & 7.84514285714285 \tabularnewline
71 & 161 & 153.126285714286 & 7.87371428571428 \tabularnewline
72 & 138.5 & 133.069142857143 & 5.43085714285715 \tabularnewline
73 & 135.9 & 133.197142857143 & 2.70285714285715 \tabularnewline
74 & 151.5 & 152.682285714286 & -1.18228571428572 \tabularnewline
75 & 164 & 156.225142857143 & 7.77485714285715 \tabularnewline
76 & 159.1 & 154.525142857143 & 4.57485714285714 \tabularnewline
77 & 157 & 155.925142857143 & 1.07485714285714 \tabularnewline
78 & 142.1 & 145.125142857143 & -3.02514285714286 \tabularnewline
79 & 144.8 & 145.296571428571 & -0.496571428571425 \tabularnewline
80 & 152.1 & 160.453714285714 & -8.35371428571429 \tabularnewline
81 & 154.6 & 152.310857142857 & 2.28914285714284 \tabularnewline
82 & 148.7 & 152.653714285714 & -3.95371428571429 \tabularnewline
83 & 157.7 & 161.925142857143 & -4.22514285714288 \tabularnewline
84 & 146.4 & 141.868 & 4.53200000000001 \tabularnewline
85 & 136.5 & 141.996 & -5.496 \tabularnewline
\hline
\end{tabular}
%Source: https://freestatistics.org/blog/index.php?pk=25813&T=4

[TABLE]
[ROW][C]Multiple Linear Regression - Actuals, Interpolation, and Residuals[/C][/ROW]
[ROW][C]Time or Index[/C][C]Actuals[/C][C]InterpolationForecast[/C][C]ResidualsPrediction Error[/C][/ROW]
[ROW][C]1[/C][C]93.7[/C][C]80.404[/C][C]13.2960000000000[/C][/ROW]
[ROW][C]2[/C][C]105.7[/C][C]99.8891428571428[/C][C]5.81085714285715[/C][/ROW]
[ROW][C]3[/C][C]109.5[/C][C]103.432[/C][C]6.06799999999999[/C][/ROW]
[ROW][C]4[/C][C]105.3[/C][C]101.732[/C][C]3.56799999999999[/C][/ROW]
[ROW][C]5[/C][C]102.8[/C][C]103.132[/C][C]-0.331999999999998[/C][/ROW]
[ROW][C]6[/C][C]100.6[/C][C]92.332[/C][C]8.268[/C][/ROW]
[ROW][C]7[/C][C]97.6[/C][C]92.5034285714286[/C][C]5.09657142857142[/C][/ROW]
[ROW][C]8[/C][C]110.3[/C][C]107.660571428571[/C][C]2.63942857142856[/C][/ROW]
[ROW][C]9[/C][C]107.2[/C][C]99.5177142857143[/C][C]7.68228571428573[/C][/ROW]
[ROW][C]10[/C][C]107.2[/C][C]99.8605714285714[/C][C]7.33942857142857[/C][/ROW]
[ROW][C]11[/C][C]108.1[/C][C]109.132[/C][C]-1.03199999999999[/C][/ROW]
[ROW][C]12[/C][C]97.1[/C][C]89.0748571428571[/C][C]8.02514285714285[/C][/ROW]
[ROW][C]13[/C][C]92.2[/C][C]89.2028571428571[/C][C]2.9971428571429[/C][/ROW]
[ROW][C]14[/C][C]112.2[/C][C]108.688[/C][C]3.51199999999999[/C][/ROW]
[ROW][C]15[/C][C]111.6[/C][C]112.230857142857[/C][C]-0.630857142857143[/C][/ROW]
[ROW][C]16[/C][C]115.7[/C][C]110.530857142857[/C][C]5.16914285714286[/C][/ROW]
[ROW][C]17[/C][C]111.3[/C][C]111.930857142857[/C][C]-0.630857142857147[/C][/ROW]
[ROW][C]18[/C][C]104.2[/C][C]101.130857142857[/C][C]3.06914285714286[/C][/ROW]
[ROW][C]19[/C][C]103.2[/C][C]101.302285714286[/C][C]1.89771428571428[/C][/ROW]
[ROW][C]20[/C][C]112.7[/C][C]116.459428571429[/C][C]-3.75942857142857[/C][/ROW]
[ROW][C]21[/C][C]106.4[/C][C]108.316571428571[/C][C]-1.91657142857142[/C][/ROW]
[ROW][C]22[/C][C]102.6[/C][C]108.659428571429[/C][C]-6.05942857142858[/C][/ROW]
[ROW][C]23[/C][C]110.6[/C][C]117.930857142857[/C][C]-7.33085714285715[/C][/ROW]
[ROW][C]24[/C][C]95.2[/C][C]97.8737142857143[/C][C]-2.67371428571428[/C][/ROW]
[ROW][C]25[/C][C]89[/C][C]98.0017142857143[/C][C]-9.00171428571429[/C][/ROW]
[ROW][C]26[/C][C]112.5[/C][C]117.486857142857[/C][C]-4.98685714285715[/C][/ROW]
[ROW][C]27[/C][C]116.8[/C][C]121.029714285714[/C][C]-4.22971428571428[/C][/ROW]
[ROW][C]28[/C][C]107.2[/C][C]119.329714285714[/C][C]-12.1297142857143[/C][/ROW]
[ROW][C]29[/C][C]113.6[/C][C]120.729714285714[/C][C]-7.12971428571429[/C][/ROW]
[ROW][C]30[/C][C]101.8[/C][C]109.929714285714[/C][C]-8.12971428571429[/C][/ROW]
[ROW][C]31[/C][C]102.6[/C][C]110.101142857143[/C][C]-7.50114285714286[/C][/ROW]
[ROW][C]32[/C][C]122.7[/C][C]125.258285714286[/C][C]-2.55828571428571[/C][/ROW]
[ROW][C]33[/C][C]110.3[/C][C]117.115428571429[/C][C]-6.81542857142858[/C][/ROW]
[ROW][C]34[/C][C]110.5[/C][C]117.458285714286[/C][C]-6.95828571428571[/C][/ROW]
[ROW][C]35[/C][C]121.6[/C][C]126.729714285714[/C][C]-5.12971428571429[/C][/ROW]
[ROW][C]36[/C][C]100.3[/C][C]106.672571428571[/C][C]-6.37257142857144[/C][/ROW]
[ROW][C]37[/C][C]100.7[/C][C]106.800571428571[/C][C]-6.10057142857143[/C][/ROW]
[ROW][C]38[/C][C]123.4[/C][C]126.285714285714[/C][C]-2.88571428571428[/C][/ROW]
[ROW][C]39[/C][C]127.1[/C][C]129.828571428571[/C][C]-2.72857142857143[/C][/ROW]
[ROW][C]40[/C][C]124.1[/C][C]128.128571428571[/C][C]-4.02857142857143[/C][/ROW]
[ROW][C]41[/C][C]131.2[/C][C]129.528571428571[/C][C]1.67142857142857[/C][/ROW]
[ROW][C]42[/C][C]111.6[/C][C]118.728571428571[/C][C]-7.12857142857143[/C][/ROW]
[ROW][C]43[/C][C]114.2[/C][C]118.9[/C][C]-4.7[/C][/ROW]
[ROW][C]44[/C][C]130.1[/C][C]134.057142857143[/C][C]-3.95714285714286[/C][/ROW]
[ROW][C]45[/C][C]125.9[/C][C]125.914285714286[/C][C]-0.0142857142857130[/C][/ROW]
[ROW][C]46[/C][C]119[/C][C]126.257142857143[/C][C]-7.25714285714286[/C][/ROW]
[ROW][C]47[/C][C]133.8[/C][C]135.528571428571[/C][C]-1.72857142857141[/C][/ROW]
[ROW][C]48[/C][C]107.5[/C][C]115.471428571429[/C][C]-7.97142857142857[/C][/ROW]
[ROW][C]49[/C][C]113.5[/C][C]115.599428571429[/C][C]-2.09942857142857[/C][/ROW]
[ROW][C]50[/C][C]134.4[/C][C]135.084571428571[/C][C]-0.684571428571427[/C][/ROW]
[ROW][C]51[/C][C]126.8[/C][C]138.627428571429[/C][C]-11.8274285714286[/C][/ROW]
[ROW][C]52[/C][C]135.6[/C][C]136.927428571429[/C][C]-1.32742857142857[/C][/ROW]
[ROW][C]53[/C][C]139.9[/C][C]138.327428571429[/C][C]1.57257142857144[/C][/ROW]
[ROW][C]54[/C][C]129.8[/C][C]127.527428571429[/C][C]2.27257142857144[/C][/ROW]
[ROW][C]55[/C][C]131[/C][C]127.698857142857[/C][C]3.30114285714286[/C][/ROW]
[ROW][C]56[/C][C]153.1[/C][C]142.856[/C][C]10.244[/C][/ROW]
[ROW][C]57[/C][C]134.1[/C][C]134.713142857143[/C][C]-0.613142857142862[/C][/ROW]
[ROW][C]58[/C][C]144.1[/C][C]135.056[/C][C]9.044[/C][/ROW]
[ROW][C]59[/C][C]155.9[/C][C]144.327428571429[/C][C]11.5725714285714[/C][/ROW]
[ROW][C]60[/C][C]123.3[/C][C]124.270285714286[/C][C]-0.970285714285722[/C][/ROW]
[ROW][C]61[/C][C]128.1[/C][C]124.398285714286[/C][C]3.70171428571428[/C][/ROW]
[ROW][C]62[/C][C]144.3[/C][C]143.883428571429[/C][C]0.416571428571444[/C][/ROW]
[ROW][C]63[/C][C]153[/C][C]147.426285714286[/C][C]5.57371428571429[/C][/ROW]
[ROW][C]64[/C][C]149.9[/C][C]145.726285714286[/C][C]4.1737142857143[/C][/ROW]
[ROW][C]65[/C][C]150.9[/C][C]147.126285714286[/C][C]3.77371428571429[/C][/ROW]
[ROW][C]66[/C][C]141[/C][C]136.326285714286[/C][C]4.67371428571428[/C][/ROW]
[ROW][C]67[/C][C]138.9[/C][C]136.497714285714[/C][C]2.40228571428572[/C][/ROW]
[ROW][C]68[/C][C]157.4[/C][C]151.654857142857[/C][C]5.74514285714286[/C][/ROW]
[ROW][C]69[/C][C]142.9[/C][C]143.512[/C][C]-0.612000000000001[/C][/ROW]
[ROW][C]70[/C][C]151.7[/C][C]143.854857142857[/C][C]7.84514285714285[/C][/ROW]
[ROW][C]71[/C][C]161[/C][C]153.126285714286[/C][C]7.87371428571428[/C][/ROW]
[ROW][C]72[/C][C]138.5[/C][C]133.069142857143[/C][C]5.43085714285715[/C][/ROW]
[ROW][C]73[/C][C]135.9[/C][C]133.197142857143[/C][C]2.70285714285715[/C][/ROW]
[ROW][C]74[/C][C]151.5[/C][C]152.682285714286[/C][C]-1.18228571428572[/C][/ROW]
[ROW][C]75[/C][C]164[/C][C]156.225142857143[/C][C]7.77485714285715[/C][/ROW]
[ROW][C]76[/C][C]159.1[/C][C]154.525142857143[/C][C]4.57485714285714[/C][/ROW]
[ROW][C]77[/C][C]157[/C][C]155.925142857143[/C][C]1.07485714285714[/C][/ROW]
[ROW][C]78[/C][C]142.1[/C][C]145.125142857143[/C][C]-3.02514285714286[/C][/ROW]
[ROW][C]79[/C][C]144.8[/C][C]145.296571428571[/C][C]-0.496571428571425[/C][/ROW]
[ROW][C]80[/C][C]152.1[/C][C]160.453714285714[/C][C]-8.35371428571429[/C][/ROW]
[ROW][C]81[/C][C]154.6[/C][C]152.310857142857[/C][C]2.28914285714284[/C][/ROW]
[ROW][C]82[/C][C]148.7[/C][C]152.653714285714[/C][C]-3.95371428571429[/C][/ROW]
[ROW][C]83[/C][C]157.7[/C][C]161.925142857143[/C][C]-4.22514285714288[/C][/ROW]
[ROW][C]84[/C][C]146.4[/C][C]141.868[/C][C]4.53200000000001[/C][/ROW]
[ROW][C]85[/C][C]136.5[/C][C]141.996[/C][C]-5.496[/C][/ROW]
[/TABLE]
Source: https://freestatistics.org/blog/index.php?pk=25813&T=4

Globally Unique Identifier (entire table): ba.freestatistics.org/blog/index.php?pk=25813&T=4

As an alternative you can also use a QR Code:  

The GUIDs for individual cells are displayed in the table below:

Multiple Linear Regression - Actuals, Interpolation, and Residuals
Time or IndexActualsInterpolationForecastResidualsPrediction Error
193.780.40413.2960000000000
2105.799.88914285714285.81085714285715
3109.5103.4326.06799999999999
4105.3101.7323.56799999999999
5102.8103.132-0.331999999999998
6100.692.3328.268
797.692.50342857142865.09657142857142
8110.3107.6605714285712.63942857142856
9107.299.51771428571437.68228571428573
10107.299.86057142857147.33942857142857
11108.1109.132-1.03199999999999
1297.189.07485714285718.02514285714285
1392.289.20285714285712.9971428571429
14112.2108.6883.51199999999999
15111.6112.230857142857-0.630857142857143
16115.7110.5308571428575.16914285714286
17111.3111.930857142857-0.630857142857147
18104.2101.1308571428573.06914285714286
19103.2101.3022857142861.89771428571428
20112.7116.459428571429-3.75942857142857
21106.4108.316571428571-1.91657142857142
22102.6108.659428571429-6.05942857142858
23110.6117.930857142857-7.33085714285715
2495.297.8737142857143-2.67371428571428
258998.0017142857143-9.00171428571429
26112.5117.486857142857-4.98685714285715
27116.8121.029714285714-4.22971428571428
28107.2119.329714285714-12.1297142857143
29113.6120.729714285714-7.12971428571429
30101.8109.929714285714-8.12971428571429
31102.6110.101142857143-7.50114285714286
32122.7125.258285714286-2.55828571428571
33110.3117.115428571429-6.81542857142858
34110.5117.458285714286-6.95828571428571
35121.6126.729714285714-5.12971428571429
36100.3106.672571428571-6.37257142857144
37100.7106.800571428571-6.10057142857143
38123.4126.285714285714-2.88571428571428
39127.1129.828571428571-2.72857142857143
40124.1128.128571428571-4.02857142857143
41131.2129.5285714285711.67142857142857
42111.6118.728571428571-7.12857142857143
43114.2118.9-4.7
44130.1134.057142857143-3.95714285714286
45125.9125.914285714286-0.0142857142857130
46119126.257142857143-7.25714285714286
47133.8135.528571428571-1.72857142857141
48107.5115.471428571429-7.97142857142857
49113.5115.599428571429-2.09942857142857
50134.4135.084571428571-0.684571428571427
51126.8138.627428571429-11.8274285714286
52135.6136.927428571429-1.32742857142857
53139.9138.3274285714291.57257142857144
54129.8127.5274285714292.27257142857144
55131127.6988571428573.30114285714286
56153.1142.85610.244
57134.1134.713142857143-0.613142857142862
58144.1135.0569.044
59155.9144.32742857142911.5725714285714
60123.3124.270285714286-0.970285714285722
61128.1124.3982857142863.70171428571428
62144.3143.8834285714290.416571428571444
63153147.4262857142865.57371428571429
64149.9145.7262857142864.1737142857143
65150.9147.1262857142863.77371428571429
66141136.3262857142864.67371428571428
67138.9136.4977142857142.40228571428572
68157.4151.6548571428575.74514285714286
69142.9143.512-0.612000000000001
70151.7143.8548571428577.84514285714285
71161153.1262857142867.87371428571428
72138.5133.0691428571435.43085714285715
73135.9133.1971428571432.70285714285715
74151.5152.682285714286-1.18228571428572
75164156.2251428571437.77485714285715
76159.1154.5251428571434.57485714285714
77157155.9251428571431.07485714285714
78142.1145.125142857143-3.02514285714286
79144.8145.296571428571-0.496571428571425
80152.1160.453714285714-8.35371428571429
81154.6152.3108571428572.28914285714284
82148.7152.653714285714-3.95371428571429
83157.7161.925142857143-4.22514285714288
84146.4141.8684.53200000000001
85136.5141.996-5.496


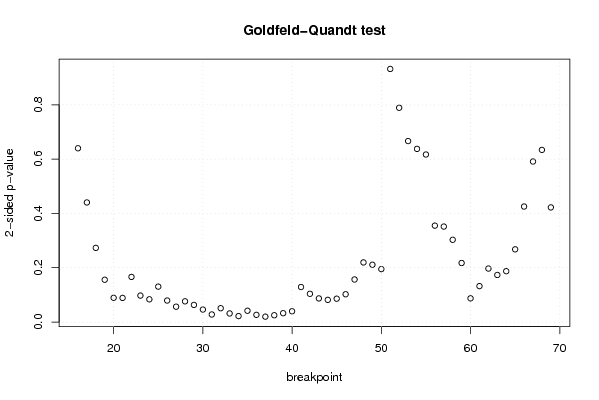
Goldfeld-Quandt test for Heteroskedasticity
p-valuesAlternative Hypothesis
breakpoint indexgreater2-sidedless
160.3199686506116130.6399373012232260.680031349388387
170.2201630636629680.4403261273259360.779836936337032
180.1365277110615060.2730554221230120.863472288938494
190.07784750433594610.1556950086718920.922152495664054
200.04461690229195580.08923380458391170.955383097708044
210.0443948920949210.0887897841898420.955605107905079
220.08308840184883710.1661768036976740.916911598151163
230.04869398453739190.09738796907478390.951306015462608
240.04183172765711350.0836634553142270.958168272342886
250.06518716097555540.1303743219511110.934812839024445
260.03961686466918610.07923372933837220.960383135330814
270.02824960753919290.05649921507838590.971750392460807
280.03812594189238390.07625188378476770.961874058107616
290.03147029797294010.06294059594588030.96852970202706
300.02297034590776550.04594069181553090.977029654092235
310.01392222237124540.02784444474249070.986077777628755
320.02544738222098170.05089476444196340.974552617779018
330.01581730923057350.0316346184611470.984182690769427
340.01093674545265420.02187349090530830.989063254547346
350.02077130643613440.04154261287226890.979228693563866
360.0132352030597740.0264704061195480.986764796940226
370.009901450928004610.01980290185600920.990098549071995
380.01253281393062750.02506562786125500.987467186069372
390.01623511602801150.03247023205602310.983764883971988
400.01980217650617940.03960435301235870.98019782349382
410.06448906947263820.1289781389452760.935510930527362
420.05198526551062170.1039705310212430.948014734489378
430.04346397854413040.08692795708826080.95653602145587
440.04084233803705630.08168467607411260.959157661962944
450.04295775005451190.08591550010902380.957042249945488
460.05115438140728960.1023087628145790.94884561859271
470.07836737666291620.1567347533258320.921632623337084
480.1097309953722470.2194619907444930.890269004627753
490.1054958891548480.2109917783096960.894504110845152
500.09744102535203470.1948820507040690.902558974647965
510.4660062528408920.9320125056817850.533993747159108
520.6054918764607020.7890162470785970.394508123539298
530.6667566082963170.6664867834073660.333243391703683
540.68121678079780.6375664384043990.318783219202199
550.6915468975256140.6169062049487720.308453102474386
560.8225021155281120.3549957689437760.177497884471888
570.824209560243770.3515808795124600.175790439756230
580.8485440330079070.3029119339841850.151455966992093
590.8912985524328860.2174028951342280.108701447567114
600.956367395357890.087265209284220.04363260464211
610.9338519969862390.1322960060275230.0661480030137615
620.9015386824348860.1969226351302280.0984613175651142
630.9133262679669370.1733474640661260.086673732033063
640.9063964063298930.1872071873402140.0936035936701068
650.8661329790539230.2677340418921550.133867020946077
660.7873225246719180.4253549506561650.212677475328082
670.7044341971073990.5911316057852030.295565802892601
680.6830740711433630.6338518577132730.316925928856637
690.7889658912129080.4220682175741830.211034108787092

\begin{tabular}{lllllllll}
\hline
Goldfeld-Quandt test for Heteroskedasticity \tabularnewline
p-values & Alternative Hypothesis \tabularnewline
breakpoint index & greater & 2-sided & less \tabularnewline
16 & 0.319968650611613 & 0.639937301223226 & 0.680031349388387 \tabularnewline
17 & 0.220163063662968 & 0.440326127325936 & 0.779836936337032 \tabularnewline
18 & 0.136527711061506 & 0.273055422123012 & 0.863472288938494 \tabularnewline
19 & 0.0778475043359461 & 0.155695008671892 & 0.922152495664054 \tabularnewline
20 & 0.0446169022919558 & 0.0892338045839117 & 0.955383097708044 \tabularnewline
21 & 0.044394892094921 & 0.088789784189842 & 0.955605107905079 \tabularnewline
22 & 0.0830884018488371 & 0.166176803697674 & 0.916911598151163 \tabularnewline
23 & 0.0486939845373919 & 0.0973879690747839 & 0.951306015462608 \tabularnewline
24 & 0.0418317276571135 & 0.083663455314227 & 0.958168272342886 \tabularnewline
25 & 0.0651871609755554 & 0.130374321951111 & 0.934812839024445 \tabularnewline
26 & 0.0396168646691861 & 0.0792337293383722 & 0.960383135330814 \tabularnewline
27 & 0.0282496075391929 & 0.0564992150783859 & 0.971750392460807 \tabularnewline
28 & 0.0381259418923839 & 0.0762518837847677 & 0.961874058107616 \tabularnewline
29 & 0.0314702979729401 & 0.0629405959458803 & 0.96852970202706 \tabularnewline
30 & 0.0229703459077655 & 0.0459406918155309 & 0.977029654092235 \tabularnewline
31 & 0.0139222223712454 & 0.0278444447424907 & 0.986077777628755 \tabularnewline
32 & 0.0254473822209817 & 0.0508947644419634 & 0.974552617779018 \tabularnewline
33 & 0.0158173092305735 & 0.031634618461147 & 0.984182690769427 \tabularnewline
34 & 0.0109367454526542 & 0.0218734909053083 & 0.989063254547346 \tabularnewline
35 & 0.0207713064361344 & 0.0415426128722689 & 0.979228693563866 \tabularnewline
36 & 0.013235203059774 & 0.026470406119548 & 0.986764796940226 \tabularnewline
37 & 0.00990145092800461 & 0.0198029018560092 & 0.990098549071995 \tabularnewline
38 & 0.0125328139306275 & 0.0250656278612550 & 0.987467186069372 \tabularnewline
39 & 0.0162351160280115 & 0.0324702320560231 & 0.983764883971988 \tabularnewline
40 & 0.0198021765061794 & 0.0396043530123587 & 0.98019782349382 \tabularnewline
41 & 0.0644890694726382 & 0.128978138945276 & 0.935510930527362 \tabularnewline
42 & 0.0519852655106217 & 0.103970531021243 & 0.948014734489378 \tabularnewline
43 & 0.0434639785441304 & 0.0869279570882608 & 0.95653602145587 \tabularnewline
44 & 0.0408423380370563 & 0.0816846760741126 & 0.959157661962944 \tabularnewline
45 & 0.0429577500545119 & 0.0859155001090238 & 0.957042249945488 \tabularnewline
46 & 0.0511543814072896 & 0.102308762814579 & 0.94884561859271 \tabularnewline
47 & 0.0783673766629162 & 0.156734753325832 & 0.921632623337084 \tabularnewline
48 & 0.109730995372247 & 0.219461990744493 & 0.890269004627753 \tabularnewline
49 & 0.105495889154848 & 0.210991778309696 & 0.894504110845152 \tabularnewline
50 & 0.0974410253520347 & 0.194882050704069 & 0.902558974647965 \tabularnewline
51 & 0.466006252840892 & 0.932012505681785 & 0.533993747159108 \tabularnewline
52 & 0.605491876460702 & 0.789016247078597 & 0.394508123539298 \tabularnewline
53 & 0.666756608296317 & 0.666486783407366 & 0.333243391703683 \tabularnewline
54 & 0.6812167807978 & 0.637566438404399 & 0.318783219202199 \tabularnewline
55 & 0.691546897525614 & 0.616906204948772 & 0.308453102474386 \tabularnewline
56 & 0.822502115528112 & 0.354995768943776 & 0.177497884471888 \tabularnewline
57 & 0.82420956024377 & 0.351580879512460 & 0.175790439756230 \tabularnewline
58 & 0.848544033007907 & 0.302911933984185 & 0.151455966992093 \tabularnewline
59 & 0.891298552432886 & 0.217402895134228 & 0.108701447567114 \tabularnewline
60 & 0.95636739535789 & 0.08726520928422 & 0.04363260464211 \tabularnewline
61 & 0.933851996986239 & 0.132296006027523 & 0.0661480030137615 \tabularnewline
62 & 0.901538682434886 & 0.196922635130228 & 0.0984613175651142 \tabularnewline
63 & 0.913326267966937 & 0.173347464066126 & 0.086673732033063 \tabularnewline
64 & 0.906396406329893 & 0.187207187340214 & 0.0936035936701068 \tabularnewline
65 & 0.866132979053923 & 0.267734041892155 & 0.133867020946077 \tabularnewline
66 & 0.787322524671918 & 0.425354950656165 & 0.212677475328082 \tabularnewline
67 & 0.704434197107399 & 0.591131605785203 & 0.295565802892601 \tabularnewline
68 & 0.683074071143363 & 0.633851857713273 & 0.316925928856637 \tabularnewline
69 & 0.788965891212908 & 0.422068217574183 & 0.211034108787092 \tabularnewline
\hline
\end{tabular}
%Source: https://freestatistics.org/blog/index.php?pk=25813&T=5

[TABLE]
[ROW][C]Goldfeld-Quandt test for Heteroskedasticity[/C][/ROW]
[ROW][C]p-values[/C][C]Alternative Hypothesis[/C][/ROW]
[ROW][C]breakpoint index[/C][C]greater[/C][C]2-sided[/C][C]less[/C][/ROW]
[ROW][C]16[/C][C]0.319968650611613[/C][C]0.639937301223226[/C][C]0.680031349388387[/C][/ROW]
[ROW][C]17[/C][C]0.220163063662968[/C][C]0.440326127325936[/C][C]0.779836936337032[/C][/ROW]
[ROW][C]18[/C][C]0.136527711061506[/C][C]0.273055422123012[/C][C]0.863472288938494[/C][/ROW]
[ROW][C]19[/C][C]0.0778475043359461[/C][C]0.155695008671892[/C][C]0.922152495664054[/C][/ROW]
[ROW][C]20[/C][C]0.0446169022919558[/C][C]0.0892338045839117[/C][C]0.955383097708044[/C][/ROW]
[ROW][C]21[/C][C]0.044394892094921[/C][C]0.088789784189842[/C][C]0.955605107905079[/C][/ROW]
[ROW][C]22[/C][C]0.0830884018488371[/C][C]0.166176803697674[/C][C]0.916911598151163[/C][/ROW]
[ROW][C]23[/C][C]0.0486939845373919[/C][C]0.0973879690747839[/C][C]0.951306015462608[/C][/ROW]
[ROW][C]24[/C][C]0.0418317276571135[/C][C]0.083663455314227[/C][C]0.958168272342886[/C][/ROW]
[ROW][C]25[/C][C]0.0651871609755554[/C][C]0.130374321951111[/C][C]0.934812839024445[/C][/ROW]
[ROW][C]26[/C][C]0.0396168646691861[/C][C]0.0792337293383722[/C][C]0.960383135330814[/C][/ROW]
[ROW][C]27[/C][C]0.0282496075391929[/C][C]0.0564992150783859[/C][C]0.971750392460807[/C][/ROW]
[ROW][C]28[/C][C]0.0381259418923839[/C][C]0.0762518837847677[/C][C]0.961874058107616[/C][/ROW]
[ROW][C]29[/C][C]0.0314702979729401[/C][C]0.0629405959458803[/C][C]0.96852970202706[/C][/ROW]
[ROW][C]30[/C][C]0.0229703459077655[/C][C]0.0459406918155309[/C][C]0.977029654092235[/C][/ROW]
[ROW][C]31[/C][C]0.0139222223712454[/C][C]0.0278444447424907[/C][C]0.986077777628755[/C][/ROW]
[ROW][C]32[/C][C]0.0254473822209817[/C][C]0.0508947644419634[/C][C]0.974552617779018[/C][/ROW]
[ROW][C]33[/C][C]0.0158173092305735[/C][C]0.031634618461147[/C][C]0.984182690769427[/C][/ROW]
[ROW][C]34[/C][C]0.0109367454526542[/C][C]0.0218734909053083[/C][C]0.989063254547346[/C][/ROW]
[ROW][C]35[/C][C]0.0207713064361344[/C][C]0.0415426128722689[/C][C]0.979228693563866[/C][/ROW]
[ROW][C]36[/C][C]0.013235203059774[/C][C]0.026470406119548[/C][C]0.986764796940226[/C][/ROW]
[ROW][C]37[/C][C]0.00990145092800461[/C][C]0.0198029018560092[/C][C]0.990098549071995[/C][/ROW]
[ROW][C]38[/C][C]0.0125328139306275[/C][C]0.0250656278612550[/C][C]0.987467186069372[/C][/ROW]
[ROW][C]39[/C][C]0.0162351160280115[/C][C]0.0324702320560231[/C][C]0.983764883971988[/C][/ROW]
[ROW][C]40[/C][C]0.0198021765061794[/C][C]0.0396043530123587[/C][C]0.98019782349382[/C][/ROW]
[ROW][C]41[/C][C]0.0644890694726382[/C][C]0.128978138945276[/C][C]0.935510930527362[/C][/ROW]
[ROW][C]42[/C][C]0.0519852655106217[/C][C]0.103970531021243[/C][C]0.948014734489378[/C][/ROW]
[ROW][C]43[/C][C]0.0434639785441304[/C][C]0.0869279570882608[/C][C]0.95653602145587[/C][/ROW]
[ROW][C]44[/C][C]0.0408423380370563[/C][C]0.0816846760741126[/C][C]0.959157661962944[/C][/ROW]
[ROW][C]45[/C][C]0.0429577500545119[/C][C]0.0859155001090238[/C][C]0.957042249945488[/C][/ROW]
[ROW][C]46[/C][C]0.0511543814072896[/C][C]0.102308762814579[/C][C]0.94884561859271[/C][/ROW]
[ROW][C]47[/C][C]0.0783673766629162[/C][C]0.156734753325832[/C][C]0.921632623337084[/C][/ROW]
[ROW][C]48[/C][C]0.109730995372247[/C][C]0.219461990744493[/C][C]0.890269004627753[/C][/ROW]
[ROW][C]49[/C][C]0.105495889154848[/C][C]0.210991778309696[/C][C]0.894504110845152[/C][/ROW]
[ROW][C]50[/C][C]0.0974410253520347[/C][C]0.194882050704069[/C][C]0.902558974647965[/C][/ROW]
[ROW][C]51[/C][C]0.466006252840892[/C][C]0.932012505681785[/C][C]0.533993747159108[/C][/ROW]
[ROW][C]52[/C][C]0.605491876460702[/C][C]0.789016247078597[/C][C]0.394508123539298[/C][/ROW]
[ROW][C]53[/C][C]0.666756608296317[/C][C]0.666486783407366[/C][C]0.333243391703683[/C][/ROW]
[ROW][C]54[/C][C]0.6812167807978[/C][C]0.637566438404399[/C][C]0.318783219202199[/C][/ROW]
[ROW][C]55[/C][C]0.691546897525614[/C][C]0.616906204948772[/C][C]0.308453102474386[/C][/ROW]
[ROW][C]56[/C][C]0.822502115528112[/C][C]0.354995768943776[/C][C]0.177497884471888[/C][/ROW]
[ROW][C]57[/C][C]0.82420956024377[/C][C]0.351580879512460[/C][C]0.175790439756230[/C][/ROW]
[ROW][C]58[/C][C]0.848544033007907[/C][C]0.302911933984185[/C][C]0.151455966992093[/C][/ROW]
[ROW][C]59[/C][C]0.891298552432886[/C][C]0.217402895134228[/C][C]0.108701447567114[/C][/ROW]
[ROW][C]60[/C][C]0.95636739535789[/C][C]0.08726520928422[/C][C]0.04363260464211[/C][/ROW]
[ROW][C]61[/C][C]0.933851996986239[/C][C]0.132296006027523[/C][C]0.0661480030137615[/C][/ROW]
[ROW][C]62[/C][C]0.901538682434886[/C][C]0.196922635130228[/C][C]0.0984613175651142[/C][/ROW]
[ROW][C]63[/C][C]0.913326267966937[/C][C]0.173347464066126[/C][C]0.086673732033063[/C][/ROW]
[ROW][C]64[/C][C]0.906396406329893[/C][C]0.187207187340214[/C][C]0.0936035936701068[/C][/ROW]
[ROW][C]65[/C][C]0.866132979053923[/C][C]0.267734041892155[/C][C]0.133867020946077[/C][/ROW]
[ROW][C]66[/C][C]0.787322524671918[/C][C]0.425354950656165[/C][C]0.212677475328082[/C][/ROW]
[ROW][C]67[/C][C]0.704434197107399[/C][C]0.591131605785203[/C][C]0.295565802892601[/C][/ROW]
[ROW][C]68[/C][C]0.683074071143363[/C][C]0.633851857713273[/C][C]0.316925928856637[/C][/ROW]
[ROW][C]69[/C][C]0.788965891212908[/C][C]0.422068217574183[/C][C]0.211034108787092[/C][/ROW]
[/TABLE]
Source: https://freestatistics.org/blog/index.php?pk=25813&T=5

Globally Unique Identifier (entire table): ba.freestatistics.org/blog/index.php?pk=25813&T=5

As an alternative you can also use a QR Code:  

The GUIDs for individual cells are displayed in the table below:

Goldfeld-Quandt test for Heteroskedasticity
p-valuesAlternative Hypothesis
breakpoint indexgreater2-sidedless
160.3199686506116130.6399373012232260.680031349388387
170.2201630636629680.4403261273259360.779836936337032
180.1365277110615060.2730554221230120.863472288938494
190.07784750433594610.1556950086718920.922152495664054
200.04461690229195580.08923380458391170.955383097708044
210.0443948920949210.0887897841898420.955605107905079
220.08308840184883710.1661768036976740.916911598151163
230.04869398453739190.09738796907478390.951306015462608
240.04183172765711350.0836634553142270.958168272342886
250.06518716097555540.1303743219511110.934812839024445
260.03961686466918610.07923372933837220.960383135330814
270.02824960753919290.05649921507838590.971750392460807
280.03812594189238390.07625188378476770.961874058107616
290.03147029797294010.06294059594588030.96852970202706
300.02297034590776550.04594069181553090.977029654092235
310.01392222237124540.02784444474249070.986077777628755
320.02544738222098170.05089476444196340.974552617779018
330.01581730923057350.0316346184611470.984182690769427
340.01093674545265420.02187349090530830.989063254547346
350.02077130643613440.04154261287226890.979228693563866
360.0132352030597740.0264704061195480.986764796940226
370.009901450928004610.01980290185600920.990098549071995
380.01253281393062750.02506562786125500.987467186069372
390.01623511602801150.03247023205602310.983764883971988
400.01980217650617940.03960435301235870.98019782349382
410.06448906947263820.1289781389452760.935510930527362
420.05198526551062170.1039705310212430.948014734489378
430.04346397854413040.08692795708826080.95653602145587
440.04084233803705630.08168467607411260.959157661962944
450.04295775005451190.08591550010902380.957042249945488
460.05115438140728960.1023087628145790.94884561859271
470.07836737666291620.1567347533258320.921632623337084
480.1097309953722470.2194619907444930.890269004627753
490.1054958891548480.2109917783096960.894504110845152
500.09744102535203470.1948820507040690.902558974647965
510.4660062528408920.9320125056817850.533993747159108
520.6054918764607020.7890162470785970.394508123539298
530.6667566082963170.6664867834073660.333243391703683
540.68121678079780.6375664384043990.318783219202199
550.6915468975256140.6169062049487720.308453102474386
560.8225021155281120.3549957689437760.177497884471888
570.824209560243770.3515808795124600.175790439756230
580.8485440330079070.3029119339841850.151455966992093
590.8912985524328860.2174028951342280.108701447567114
600.956367395357890.087265209284220.04363260464211
610.9338519969862390.1322960060275230.0661480030137615
620.9015386824348860.1969226351302280.0984613175651142
630.9133262679669370.1733474640661260.086673732033063
640.9063964063298930.1872071873402140.0936035936701068
650.8661329790539230.2677340418921550.133867020946077
660.7873225246719180.4253549506561650.212677475328082
670.7044341971073990.5911316057852030.295565802892601
680.6830740711433630.6338518577132730.316925928856637
690.7889658912129080.4220682175741830.211034108787092


Meta Analysis of Goldfeld-Quandt test for Heteroskedasticity
Description# significant tests% significant testsOK/NOK
1% type I error level00OK
5% type I error level100.185185185185185NOK
10% type I error level230.425925925925926NOK

\begin{tabular}{lllllllll}
\hline
Meta Analysis of Goldfeld-Quandt test for Heteroskedasticity \tabularnewline
Description & # significant tests & % significant tests & OK/NOK \tabularnewline
1% type I error level & 0 & 0 & OK \tabularnewline
5% type I error level & 10 & 0.185185185185185 & NOK \tabularnewline
10% type I error level & 23 & 0.425925925925926 & NOK \tabularnewline
\hline
\end{tabular}
%Source: https://freestatistics.org/blog/index.php?pk=25813&T=6

[TABLE]
[ROW][C]Meta Analysis of Goldfeld-Quandt test for Heteroskedasticity[/C][/ROW]
[ROW][C]Description[/C][C]# significant tests[/C][C]% significant tests[/C][C]OK/NOK[/C][/ROW]
[ROW][C]1% type I error level[/C][C]0[/C][C]0[/C][C]OK[/C][/ROW]
[ROW][C]5% type I error level[/C][C]10[/C][C]0.185185185185185[/C][C]NOK[/C][/ROW]
[ROW][C]10% type I error level[/C][C]23[/C][C]0.425925925925926[/C][C]NOK[/C][/ROW]
[/TABLE]
Source: https://freestatistics.org/blog/index.php?pk=25813&T=6

Globally Unique Identifier (entire table): ba.freestatistics.org/blog/index.php?pk=25813&T=6

As an alternative you can also use a QR Code:  

The GUIDs for individual cells are displayed in the table below:

Meta Analysis of Goldfeld-Quandt test for Heteroskedasticity
Description# significant tests% significant testsOK/NOK
1% type I error level00OK
5% type I error level100.185185185185185NOK
10% type I error level230.425925925925926NOK


Parameters (Session):
par1 = 1 ; par2 = Include Monthly Dummies ; par3 = Linear Trend ;
Parameters (R input):
par1 = 1 ; par2 = Include Monthly Dummies ; par3 = Linear Trend ;
R code (references can be found in the software module):
library(lattice)
library(lmtest)
n25 <- 25 #minimum number of obs. for Goldfeld-Quandt test
par1 <- as.numeric(par1)
x <- t(y)
k <- length(x[1,])
n <- length(x[,1])
x1 <- cbind(x[,par1], x[,1:k!=par1])
mycolnames <- c(colnames(x)[par1], colnames(x)[1:k!=par1])
colnames(x1) <- mycolnames #colnames(x)[par1]
x <- x1
if (par3 == 'First Differences'){
x2 <- array(0, dim=c(n-1,k), dimnames=list(1:(n-1), paste('(1-B)',colnames(x),sep='')))
for (i in 1:n-1) {
for (j in 1:k) {
x2[i,j] <- x[i+1,j] - x[i,j]
}
}
x <- x2
}
if (par2 == 'Include Monthly Dummies'){
x2 <- array(0, dim=c(n,11), dimnames=list(1:n, paste('M', seq(1:11), sep ='')))
for (i in 1:11){
x2[seq(i,n,12),i] <- 1
}
x <- cbind(x, x2)
}
if (par2 == 'Include Quarterly Dummies'){
x2 <- array(0, dim=c(n,3), dimnames=list(1:n, paste('Q', seq(1:3), sep ='')))
for (i in 1:3){
x2[seq(i,n,4),i] <- 1
}
x <- cbind(x, x2)
}
k <- length(x[1,])
if (par3 == 'Linear Trend'){
x <- cbind(x, c(1:n))
colnames(x)[k+1] <- 't'
}
x
k <- length(x[1,])
df <- as.data.frame(x)
(mylm <- lm(df))
(mysum <- summary(mylm))
if (n > n25) {
kp3 <- k + 3
nmkm3 <- n - k - 3
gqarr <- array(NA, dim=c(nmkm3-kp3+1,3))
numgqtests <- 0
numsignificant1 <- 0
numsignificant5 <- 0
numsignificant10 <- 0
for (mypoint in kp3:nmkm3) {
j <- 0
numgqtests <- numgqtests + 1
for (myalt in c('greater', 'two.sided', 'less')) {
j <- j + 1
gqarr[mypoint-kp3+1,j] <- gqtest(mylm, point=mypoint, alternative=myalt)$p.value
}
if (gqarr[mypoint-kp3+1,2] < 0.01) numsignificant1 <- numsignificant1 + 1
if (gqarr[mypoint-kp3+1,2] < 0.05) numsignificant5 <- numsignificant5 + 1
if (gqarr[mypoint-kp3+1,2] < 0.10) numsignificant10 <- numsignificant10 + 1
}
gqarr
}
bitmap(file='test0.png')
plot(x[,1], type='l', main='Actuals and Interpolation', ylab='value of Actuals and Interpolation (dots)', xlab='time or index')
points(x[,1]-mysum$resid)
grid()
dev.off()
bitmap(file='test1.png')
plot(mysum$resid, type='b', pch=19, main='Residuals', ylab='value of Residuals', xlab='time or index')
grid()
dev.off()
bitmap(file='test2.png')
hist(mysum$resid, main='Residual Histogram', xlab='values of Residuals')
grid()
dev.off()
bitmap(file='test3.png')
densityplot(~mysum$resid,col='black',main='Residual Density Plot', xlab='values of Residuals')
dev.off()
bitmap(file='test4.png')
qqnorm(mysum$resid, main='Residual Normal Q-Q Plot')
qqline(mysum$resid)
grid()
dev.off()
(myerror <- as.ts(mysum$resid))
bitmap(file='test5.png')
dum <- cbind(lag(myerror,k=1),myerror)
dum
dum1 <- dum[2:length(myerror),]
dum1
z <- as.data.frame(dum1)
z
plot(z,main=paste('Residual Lag plot, lowess, and regression line'), ylab='values of Residuals', xlab='lagged values of Residuals')
lines(lowess(z))
abline(lm(z))
grid()
dev.off()
bitmap(file='test6.png')
acf(mysum$resid, lag.max=length(mysum$resid)/2, main='Residual Autocorrelation Function')
grid()
dev.off()
bitmap(file='test7.png')
pacf(mysum$resid, lag.max=length(mysum$resid)/2, main='Residual Partial Autocorrelation Function')
grid()
dev.off()
bitmap(file='test8.png')
opar <- par(mfrow = c(2,2), oma = c(0, 0, 1.1, 0))
plot(mylm, las = 1, sub='Residual Diagnostics')
par(opar)
dev.off()
if (n > n25) {
bitmap(file='test9.png')
plot(kp3:nmkm3,gqarr[,2], main='Goldfeld-Quandt test',ylab='2-sided p-value',xlab='breakpoint')
grid()
dev.off()
}
load(file='createtable')
a<-table.start()
a<-table.row.start(a)
a<-table.element(a, 'Multiple Linear Regression - Estimated Regression Equation', 1, TRUE)
a<-table.row.end(a)
myeq <- colnames(x)[1]
myeq <- paste(myeq, '[t] = ', sep='')
for (i in 1:k){
if (mysum$coefficients[i,1] > 0) myeq <- paste(myeq, '+', '')
myeq <- paste(myeq, mysum$coefficients[i,1], sep=' ')
if (rownames(mysum$coefficients)[i] != '(Intercept)') {
myeq <- paste(myeq, rownames(mysum$coefficients)[i], sep='')
if (rownames(mysum$coefficients)[i] != 't') myeq <- paste(myeq, '[t]', sep='')
}
}
myeq <- paste(myeq, ' + e[t]')
a<-table.row.start(a)
a<-table.element(a, myeq)
a<-table.row.end(a)
a<-table.end(a)
table.save(a,file='mytable1.tab')
a<-table.start()
a<-table.row.start(a)
a<-table.element(a,hyperlink('ols1.htm','Multiple Linear Regression - Ordinary Least Squares',''), 6, TRUE)
a<-table.row.end(a)
a<-table.row.start(a)
a<-table.element(a,'Variable',header=TRUE)
a<-table.element(a,'Parameter',header=TRUE)
a<-table.element(a,'S.D.',header=TRUE)
a<-table.element(a,'T-STAT
H0: parameter = 0',header=TRUE)
a<-table.element(a,'2-tail p-value',header=TRUE)
a<-table.element(a,'1-tail p-value',header=TRUE)
a<-table.row.end(a)
for (i in 1:k){
a<-table.row.start(a)
a<-table.element(a,rownames(mysum$coefficients)[i],header=TRUE)
a<-table.element(a,mysum$coefficients[i,1])
a<-table.element(a, round(mysum$coefficients[i,2],6))
a<-table.element(a, round(mysum$coefficients[i,3],4))
a<-table.element(a, round(mysum$coefficients[i,4],6))
a<-table.element(a, round(mysum$coefficients[i,4]/2,6))
a<-table.row.end(a)
}
a<-table.end(a)
table.save(a,file='mytable2.tab')
a<-table.start()
a<-table.row.start(a)
a<-table.element(a, 'Multiple Linear Regression - Regression Statistics', 2, TRUE)
a<-table.row.end(a)
a<-table.row.start(a)
a<-table.element(a, 'Multiple R',1,TRUE)
a<-table.element(a, sqrt(mysum$r.squared))
a<-table.row.end(a)
a<-table.row.start(a)
a<-table.element(a, 'R-squared',1,TRUE)
a<-table.element(a, mysum$r.squared)
a<-table.row.end(a)
a<-table.row.start(a)
a<-table.element(a, 'Adjusted R-squared',1,TRUE)
a<-table.element(a, mysum$adj.r.squared)
a<-table.row.end(a)
a<-table.row.start(a)
a<-table.element(a, 'F-TEST (value)',1,TRUE)
a<-table.element(a, mysum$fstatistic[1])
a<-table.row.end(a)
a<-table.row.start(a)
a<-table.element(a, 'F-TEST (DF numerator)',1,TRUE)
a<-table.element(a, mysum$fstatistic[2])
a<-table.row.end(a)
a<-table.row.start(a)
a<-table.element(a, 'F-TEST (DF denominator)',1,TRUE)
a<-table.element(a, mysum$fstatistic[3])
a<-table.row.end(a)
a<-table.row.start(a)
a<-table.element(a, 'p-value',1,TRUE)
a<-table.element(a, 1-pf(mysum$fstatistic[1],mysum$fstatistic[2],mysum$fstatistic[3]))
a<-table.row.end(a)
a<-table.row.start(a)
a<-table.element(a, 'Multiple Linear Regression - Residual Statistics', 2, TRUE)
a<-table.row.end(a)
a<-table.row.start(a)
a<-table.element(a, 'Residual Standard Deviation',1,TRUE)
a<-table.element(a, mysum$sigma)
a<-table.row.end(a)
a<-table.row.start(a)
a<-table.element(a, 'Sum Squared Residuals',1,TRUE)
a<-table.element(a, sum(myerror*myerror))
a<-table.row.end(a)
a<-table.end(a)
table.save(a,file='mytable3.tab')
a<-table.start()
a<-table.row.start(a)
a<-table.element(a, 'Multiple Linear Regression - Actuals, Interpolation, and Residuals', 4, TRUE)
a<-table.row.end(a)
a<-table.row.start(a)
a<-table.element(a, 'Time or Index', 1, TRUE)
a<-table.element(a, 'Actuals', 1, TRUE)
a<-table.element(a, 'Interpolation
Forecast', 1, TRUE)
a<-table.element(a, 'Residuals
Prediction Error', 1, TRUE)
a<-table.row.end(a)
for (i in 1:n) {
a<-table.row.start(a)
a<-table.element(a,i, 1, TRUE)
a<-table.element(a,x[i])
a<-table.element(a,x[i]-mysum$resid[i])
a<-table.element(a,mysum$resid[i])
a<-table.row.end(a)
}
a<-table.end(a)
table.save(a,file='mytable4.tab')
if (n > n25) {
a<-table.start()
a<-table.row.start(a)
a<-table.element(a,'Goldfeld-Quandt test for Heteroskedasticity',4,TRUE)
a<-table.row.end(a)
a<-table.row.start(a)
a<-table.element(a,'p-values',header=TRUE)
a<-table.element(a,'Alternative Hypothesis',3,header=TRUE)
a<-table.row.end(a)
a<-table.row.start(a)
a<-table.element(a,'breakpoint index',header=TRUE)
a<-table.element(a,'greater',header=TRUE)
a<-table.element(a,'2-sided',header=TRUE)
a<-table.element(a,'less',header=TRUE)
a<-table.row.end(a)
for (mypoint in kp3:nmkm3) {
a<-table.row.start(a)
a<-table.element(a,mypoint,header=TRUE)
a<-table.element(a,gqarr[mypoint-kp3+1,1])
a<-table.element(a,gqarr[mypoint-kp3+1,2])
a<-table.element(a,gqarr[mypoint-kp3+1,3])
a<-table.row.end(a)
}
a<-table.end(a)
table.save(a,file='mytable5.tab')
a<-table.start()
a<-table.row.start(a)
a<-table.element(a,'Meta Analysis of Goldfeld-Quandt test for Heteroskedasticity',4,TRUE)
a<-table.row.end(a)
a<-table.row.start(a)
a<-table.element(a,'Description',header=TRUE)
a<-table.element(a,'# significant tests',header=TRUE)
a<-table.element(a,'% significant tests',header=TRUE)
a<-table.element(a,'OK/NOK',header=TRUE)
a<-table.row.end(a)
a<-table.row.start(a)
a<-table.element(a,'1% type I error level',header=TRUE)
a<-table.element(a,numsignificant1)
a<-table.element(a,numsignificant1/numgqtests)
if (numsignificant1/numgqtests < 0.01) dum <- 'OK' else dum <- 'NOK'
a<-table.element(a,dum)
a<-table.row.end(a)
a<-table.row.start(a)
a<-table.element(a,'5% type I error level',header=TRUE)
a<-table.element(a,numsignificant5)
a<-table.element(a,numsignificant5/numgqtests)
if (numsignificant5/numgqtests < 0.05) dum <- 'OK' else dum <- 'NOK'
a<-table.element(a,dum)
a<-table.row.end(a)
a<-table.row.start(a)
a<-table.element(a,'10% type I error level',header=TRUE)
a<-table.element(a,numsignificant10)
a<-table.element(a,numsignificant10/numgqtests)
if (numsignificant10/numgqtests < 0.1) dum <- 'OK' else dum <- 'NOK'
a<-table.element(a,dum)
a<-table.row.end(a)
a<-table.end(a)
table.save(a,file='mytable6.tab')
}