Free Statistics

of Irreproducible Research!

Author's title

Author*Unverified author*
R Software Modulerwasp_multipleregression.wasp
Title produced by softwareMultiple Regression
Date of computationThu, 27 Nov 2008 06:33:01 -0700
Cite this page as followsStatistical Computations at FreeStatistics.org, Office for Research Development and Education, URL https://freestatistics.org/blog/index.php?v=date/2008/Nov/27/t12277928152xlln9gs9n9p69g.htm/, Retrieved Sun, 19 May 2024 11:12:36 +0000
Statistical Computations at FreeStatistics.org, Office for Research Development and Education, URL https://freestatistics.org/blog/index.php?pk=25805, Retrieved Sun, 19 May 2024 11:12:36 +0000
QR Codes:

Original text written by user:
IsPrivate?No (this computation is public)
User-defined keywordskleuter
Estimated Impact155
Family? (F = Feedback message, R = changed R code, M = changed R Module, P = changed Parameters, D = changed Data)
F     [Multiple Regression] [] [2008-11-18 09:23:14] [488d9a19d3c63b747ac6ad96017e55c8]
F    D    [Multiple Regression] [] [2008-11-27 13:33:01] [b5c0979bf79a38ace87e0d3abace1ca1] [Current]
Feedback Forum
2008-11-30 10:45:23 [Gert-Jan Geudens] [reply
De berekeningen van de student(e) zijn correct al hebben we hier wel enkele vragen bij de gebruikte cijfergegevens. De omzet in de referentiemaand is 115. Is dit een percentage of een getal? aangezien de student over percentages spreekt. Indien dit inderdaad een percentage is, welk is dan het basisjaar?
Deze onduidelijkheid maakt de interpretatie nogal onduidelijk, al lijkt de conclusie van de student wel correct (indien het effectief om percentages gaat).
2008-11-30 11:00:57 [Gert-Jan Geudens] [reply
We moeten hier nog even het volgende rechtzetten : De student(e) heeft jaarcijfers gebruikt en dus is deze berekening met seasonal dummies helemaal niet van toepassing. In de vraag staat echter wel dat we gebruik moeten maken van deze seasonal dummies en dus kunnen we besluiten dat de student(e) foutieve tijdreeksen heeft gebruikt.
2008-11-30 15:15:14 [6066575aa30c0611e452e930b1dff53d] [reply
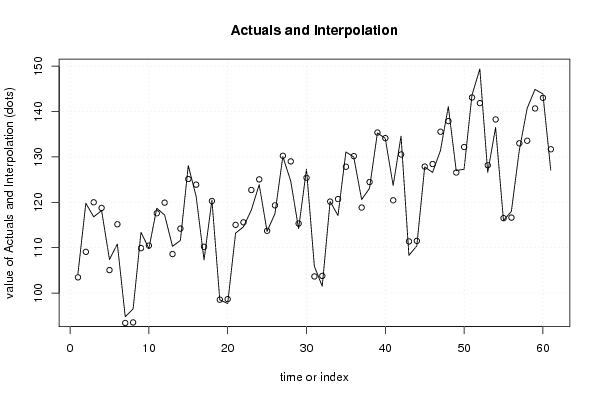
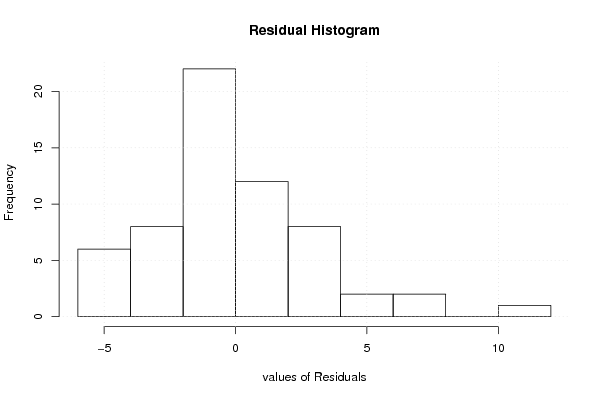
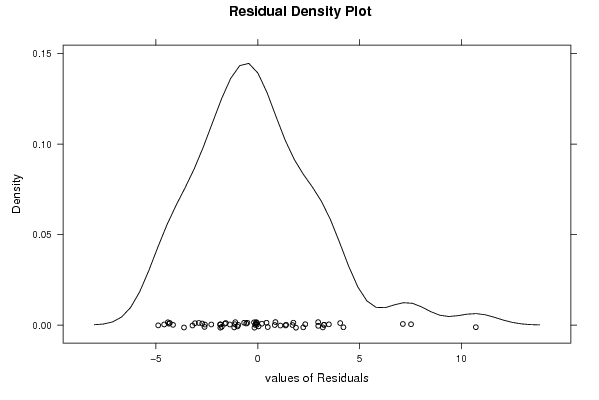
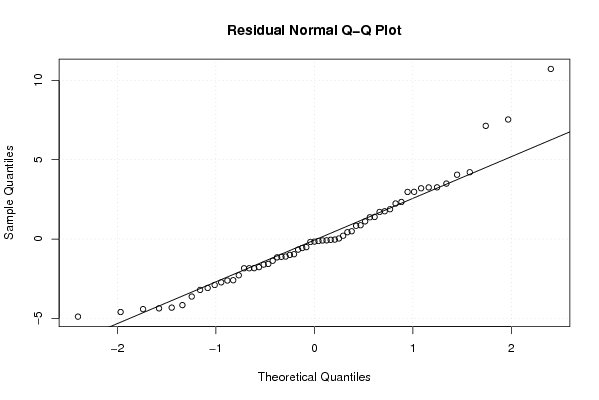
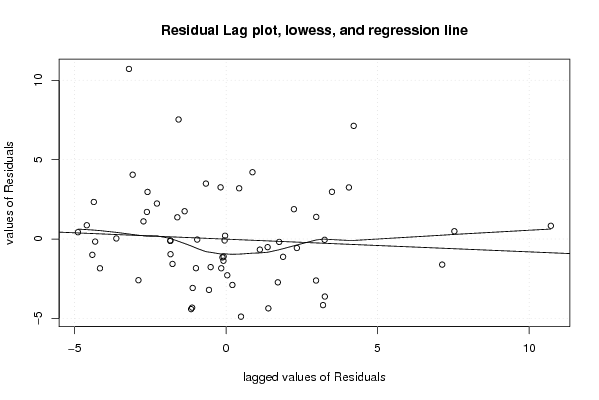
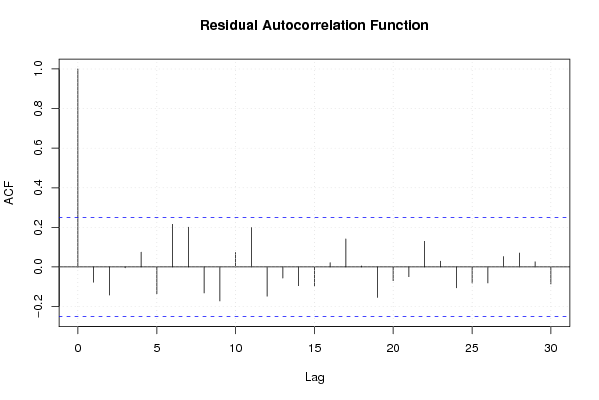
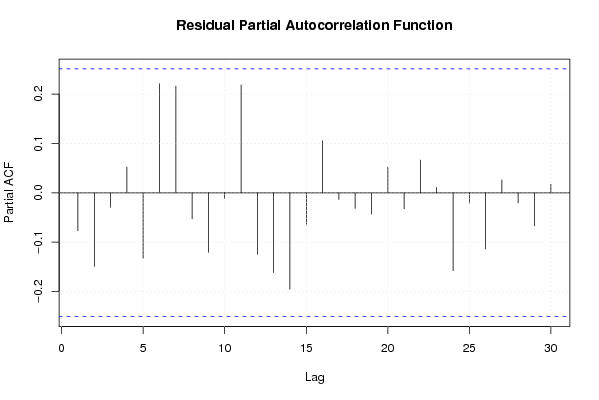
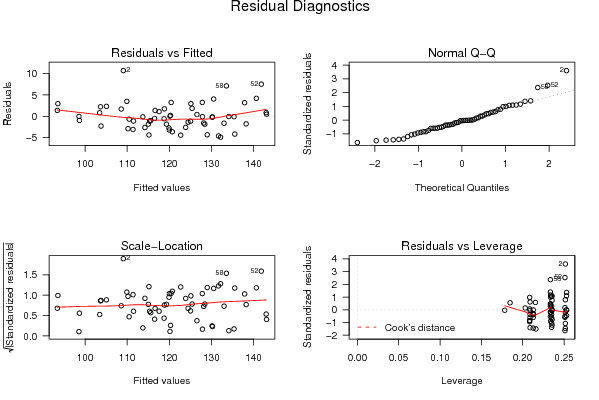
Bij deze vraag heeft men redelijk weinig uitleg gegeven. Men had ook nog kunnen vermelden dat de p-waarden in de tabel van multiple linear regression - ordinary least squares bij sommige maanden redelijk hoog zijn. Dus als we een alfa fout van 5% nemen, kunnen we stellen dat er geen significant verschil is en dat we het effect van onze gebeurtenis aan het toeval kunnen toeschrijven. De adjusted r-squared bedraagt 92%, dit houdt in dat we 92% van de schommelingen die ontstaan door de gebeurtenis kunnen verklaren. Verder werden de grafieken niet besproken.

Post a new message
Dataseries X:
104,3	0
119,8	0
116,8	0
118,2	0
107,4	0
110,8	0
94,8	0
96,5	0
113,4	0
109,8	0
118,7	0
117,2	0
110,3	0
111,6	0
128,1	0
121,3	0
107,3	0
120,5	0
98,5	0
97,7	0
113,2	0
114,6	0
118,3	0
123,9	0
113,6	0
117,5	0
130,1	0
124,7	0
114,2	0
127,3	0
105,9	0
101,5	0
120,2	0
117,1	0
131,1	0
130	0
120,6	0
123,1	0
135,3	0
134,1	0
123,7	0
134,6	0
108,3	1
110,4	1
127,8	1
126,6	1
131,4	1
141,1	1
127	1
127,3	1
143,6	1
149,4	1
126,6	1
136,5	1
116	1
118	1
131,4	1
140,7	1
144,9	1
143,9	1
127,1	1


Summary of computational transaction
Raw Inputview raw input (R code)
Raw Outputview raw output of R engine
Computing time3 seconds
R Server'Gwilym Jenkins' @ 72.249.127.135

\begin{tabular}{lllllllll}
\hline
Summary of computational transaction \tabularnewline
Raw Input & view raw input (R code)  \tabularnewline
Raw Output & view raw output of R engine  \tabularnewline
Computing time & 3 seconds \tabularnewline
R Server & 'Gwilym Jenkins' @ 72.249.127.135 \tabularnewline
\hline
\end{tabular}
%Source: https://freestatistics.org/blog/index.php?pk=25805&T=0

[TABLE]
[ROW][C]Summary of computational transaction[/C][/ROW]
[ROW][C]Raw Input[/C][C]view raw input (R code) [/C][/ROW]
[ROW][C]Raw Output[/C][C]view raw output of R engine [/C][/ROW]
[ROW][C]Computing time[/C][C]3 seconds[/C][/ROW]
[ROW][C]R Server[/C][C]'Gwilym Jenkins' @ 72.249.127.135[/C][/ROW]
[/TABLE]
Source: https://freestatistics.org/blog/index.php?pk=25805&T=0

Globally Unique Identifier (entire table): ba.freestatistics.org/blog/index.php?pk=25805&T=0

As an alternative you can also use a QR Code:  

The GUIDs for individual cells are displayed in the table below:

Summary of computational transaction
Raw Inputview raw input (R code)
Raw Outputview raw output of R engine
Computing time3 seconds
R Server'Gwilym Jenkins' @ 72.249.127.135


Multiple Linear Regression - Estimated Regression Equation
x[t] = + 114.799616724739 + 2.59224738675958y[t] -11.7605884630275M1[t] -6.56836043360433M2[t] + 3.92432055749128M3[t] + 2.25700154858691M4[t] -11.8703174603174M5[t] -2.19763646922184M6[t] -24.3834049554781M7[t] -24.6907239643825M8[t] -8.73804297328687M9[t] -8.60536198219127M10[t] -1.91268099109563M11[t] + 0.427319008904374t + e[t]

\begin{tabular}{lllllllll}
\hline
Multiple Linear Regression - Estimated Regression Equation \tabularnewline
x[t] =  +  114.799616724739 +  2.59224738675958y[t] -11.7605884630275M1[t] -6.56836043360433M2[t] +  3.92432055749128M3[t] +  2.25700154858691M4[t] -11.8703174603174M5[t] -2.19763646922184M6[t] -24.3834049554781M7[t] -24.6907239643825M8[t] -8.73804297328687M9[t] -8.60536198219127M10[t] -1.91268099109563M11[t] +  0.427319008904374t  + e[t] \tabularnewline
\hline
\end{tabular}
%Source: https://freestatistics.org/blog/index.php?pk=25805&T=1

[TABLE]
[ROW][C]Multiple Linear Regression - Estimated Regression Equation[/C][/ROW]
[ROW][C]x[t] =  +  114.799616724739 +  2.59224738675958y[t] -11.7605884630275M1[t] -6.56836043360433M2[t] +  3.92432055749128M3[t] +  2.25700154858691M4[t] -11.8703174603174M5[t] -2.19763646922184M6[t] -24.3834049554781M7[t] -24.6907239643825M8[t] -8.73804297328687M9[t] -8.60536198219127M10[t] -1.91268099109563M11[t] +  0.427319008904374t  + e[t][/C][/ROW]
[/TABLE]
Source: https://freestatistics.org/blog/index.php?pk=25805&T=1

Globally Unique Identifier (entire table): ba.freestatistics.org/blog/index.php?pk=25805&T=1

As an alternative you can also use a QR Code:  

The GUIDs for individual cells are displayed in the table below:

Multiple Linear Regression - Estimated Regression Equation
x[t] = + 114.799616724739 + 2.59224738675958y[t] -11.7605884630275M1[t] -6.56836043360433M2[t] + 3.92432055749128M3[t] + 2.25700154858691M4[t] -11.8703174603174M5[t] -2.19763646922184M6[t] -24.3834049554781M7[t] -24.6907239643825M8[t] -8.73804297328687M9[t] -8.60536198219127M10[t] -1.91268099109563M11[t] + 0.427319008904374t + e[t]


Multiple Linear Regression - Ordinary Least Squares
VariableParameterS.D.T-STATH0: parameter = 02-tail p-value1-tail p-value
(Intercept)114.7996167247391.88303360.965300
y2.592247386759581.6250291.59520.1173710.058685
M1-11.76058846302752.092623-5.621e-061e-06
M2-6.568360433604332.195527-2.99170.0044080.002204
M33.924320557491282.1927571.78970.079950.039975
M42.257001548586912.1908051.03020.3081810.154091
M5-11.87031746031742.189676-5.4212e-061e-06
M6-2.197636469221842.189369-1.00380.3206270.160313
M7-24.38340495547812.190989-11.128900
M8-24.69072396438252.187284-11.288300
M9-8.738042973286872.184397-4.00020.0002230.000111
M10-8.605361982191272.182333-3.94320.0002660.000133
M11-1.912680991095632.181094-0.87690.3849820.192491
t0.4273190089043740.04245810.064500

\begin{tabular}{lllllllll}
\hline
Multiple Linear Regression - Ordinary Least Squares \tabularnewline
Variable & Parameter & S.D. & T-STATH0: parameter = 0 & 2-tail p-value & 1-tail p-value \tabularnewline
(Intercept) & 114.799616724739 & 1.883033 & 60.9653 & 0 & 0 \tabularnewline
y & 2.59224738675958 & 1.625029 & 1.5952 & 0.117371 & 0.058685 \tabularnewline
M1 & -11.7605884630275 & 2.092623 & -5.62 & 1e-06 & 1e-06 \tabularnewline
M2 & -6.56836043360433 & 2.195527 & -2.9917 & 0.004408 & 0.002204 \tabularnewline
M3 & 3.92432055749128 & 2.192757 & 1.7897 & 0.07995 & 0.039975 \tabularnewline
M4 & 2.25700154858691 & 2.190805 & 1.0302 & 0.308181 & 0.154091 \tabularnewline
M5 & -11.8703174603174 & 2.189676 & -5.421 & 2e-06 & 1e-06 \tabularnewline
M6 & -2.19763646922184 & 2.189369 & -1.0038 & 0.320627 & 0.160313 \tabularnewline
M7 & -24.3834049554781 & 2.190989 & -11.1289 & 0 & 0 \tabularnewline
M8 & -24.6907239643825 & 2.187284 & -11.2883 & 0 & 0 \tabularnewline
M9 & -8.73804297328687 & 2.184397 & -4.0002 & 0.000223 & 0.000111 \tabularnewline
M10 & -8.60536198219127 & 2.182333 & -3.9432 & 0.000266 & 0.000133 \tabularnewline
M11 & -1.91268099109563 & 2.181094 & -0.8769 & 0.384982 & 0.192491 \tabularnewline
t & 0.427319008904374 & 0.042458 & 10.0645 & 0 & 0 \tabularnewline
\hline
\end{tabular}
%Source: https://freestatistics.org/blog/index.php?pk=25805&T=2

[TABLE]
[ROW][C]Multiple Linear Regression - Ordinary Least Squares[/C][/ROW]
[ROW][C]Variable[/C][C]Parameter[/C][C]S.D.[/C][C]T-STATH0: parameter = 0[/C][C]2-tail p-value[/C][C]1-tail p-value[/C][/ROW]
[ROW][C](Intercept)[/C][C]114.799616724739[/C][C]1.883033[/C][C]60.9653[/C][C]0[/C][C]0[/C][/ROW]
[ROW][C]y[/C][C]2.59224738675958[/C][C]1.625029[/C][C]1.5952[/C][C]0.117371[/C][C]0.058685[/C][/ROW]
[ROW][C]M1[/C][C]-11.7605884630275[/C][C]2.092623[/C][C]-5.62[/C][C]1e-06[/C][C]1e-06[/C][/ROW]
[ROW][C]M2[/C][C]-6.56836043360433[/C][C]2.195527[/C][C]-2.9917[/C][C]0.004408[/C][C]0.002204[/C][/ROW]
[ROW][C]M3[/C][C]3.92432055749128[/C][C]2.192757[/C][C]1.7897[/C][C]0.07995[/C][C]0.039975[/C][/ROW]
[ROW][C]M4[/C][C]2.25700154858691[/C][C]2.190805[/C][C]1.0302[/C][C]0.308181[/C][C]0.154091[/C][/ROW]
[ROW][C]M5[/C][C]-11.8703174603174[/C][C]2.189676[/C][C]-5.421[/C][C]2e-06[/C][C]1e-06[/C][/ROW]
[ROW][C]M6[/C][C]-2.19763646922184[/C][C]2.189369[/C][C]-1.0038[/C][C]0.320627[/C][C]0.160313[/C][/ROW]
[ROW][C]M7[/C][C]-24.3834049554781[/C][C]2.190989[/C][C]-11.1289[/C][C]0[/C][C]0[/C][/ROW]
[ROW][C]M8[/C][C]-24.6907239643825[/C][C]2.187284[/C][C]-11.2883[/C][C]0[/C][C]0[/C][/ROW]
[ROW][C]M9[/C][C]-8.73804297328687[/C][C]2.184397[/C][C]-4.0002[/C][C]0.000223[/C][C]0.000111[/C][/ROW]
[ROW][C]M10[/C][C]-8.60536198219127[/C][C]2.182333[/C][C]-3.9432[/C][C]0.000266[/C][C]0.000133[/C][/ROW]
[ROW][C]M11[/C][C]-1.91268099109563[/C][C]2.181094[/C][C]-0.8769[/C][C]0.384982[/C][C]0.192491[/C][/ROW]
[ROW][C]t[/C][C]0.427319008904374[/C][C]0.042458[/C][C]10.0645[/C][C]0[/C][C]0[/C][/ROW]
[/TABLE]
Source: https://freestatistics.org/blog/index.php?pk=25805&T=2

Globally Unique Identifier (entire table): ba.freestatistics.org/blog/index.php?pk=25805&T=2

As an alternative you can also use a QR Code:  

The GUIDs for individual cells are displayed in the table below:

Multiple Linear Regression - Ordinary Least Squares
VariableParameterS.D.T-STATH0: parameter = 02-tail p-value1-tail p-value
(Intercept)114.7996167247391.88303360.965300
y2.592247386759581.6250291.59520.1173710.058685
M1-11.76058846302752.092623-5.621e-061e-06
M2-6.568360433604332.195527-2.99170.0044080.002204
M33.924320557491282.1927571.78970.079950.039975
M42.257001548586912.1908051.03020.3081810.154091
M5-11.87031746031742.189676-5.4212e-061e-06
M6-2.197636469221842.189369-1.00380.3206270.160313
M7-24.38340495547812.190989-11.128900
M8-24.69072396438252.187284-11.288300
M9-8.738042973286872.184397-4.00020.0002230.000111
M10-8.605361982191272.182333-3.94320.0002660.000133
M11-1.912680991095632.181094-0.87690.3849820.192491
t0.4273190089043740.04245810.064500


Multiple Linear Regression - Regression Statistics
Multiple R0.970185957751532
R-squared0.941260792618257
Adjusted R-squared0.92501377781054
F-TEST (value)57.934383870397
F-TEST (DF numerator)13
F-TEST (DF denominator)47
p-value0
Multiple Linear Regression - Residual Statistics
Residual Standard Deviation3.44795854182024
Sum Squared Residuals558.755650987225

\begin{tabular}{lllllllll}
\hline
Multiple Linear Regression - Regression Statistics \tabularnewline
Multiple R & 0.970185957751532 \tabularnewline
R-squared & 0.941260792618257 \tabularnewline
Adjusted R-squared & 0.92501377781054 \tabularnewline
F-TEST (value) & 57.934383870397 \tabularnewline
F-TEST (DF numerator) & 13 \tabularnewline
F-TEST (DF denominator) & 47 \tabularnewline
p-value & 0 \tabularnewline
Multiple Linear Regression - Residual Statistics \tabularnewline
Residual Standard Deviation & 3.44795854182024 \tabularnewline
Sum Squared Residuals & 558.755650987225 \tabularnewline
\hline
\end{tabular}
%Source: https://freestatistics.org/blog/index.php?pk=25805&T=3

[TABLE]
[ROW][C]Multiple Linear Regression - Regression Statistics[/C][/ROW]
[ROW][C]Multiple R[/C][C]0.970185957751532[/C][/ROW]
[ROW][C]R-squared[/C][C]0.941260792618257[/C][/ROW]
[ROW][C]Adjusted R-squared[/C][C]0.92501377781054[/C][/ROW]
[ROW][C]F-TEST (value)[/C][C]57.934383870397[/C][/ROW]
[ROW][C]F-TEST (DF numerator)[/C][C]13[/C][/ROW]
[ROW][C]F-TEST (DF denominator)[/C][C]47[/C][/ROW]
[ROW][C]p-value[/C][C]0[/C][/ROW]
[ROW][C]Multiple Linear Regression - Residual Statistics[/C][/ROW]
[ROW][C]Residual Standard Deviation[/C][C]3.44795854182024[/C][/ROW]
[ROW][C]Sum Squared Residuals[/C][C]558.755650987225[/C][/ROW]
[/TABLE]
Source: https://freestatistics.org/blog/index.php?pk=25805&T=3

Globally Unique Identifier (entire table): ba.freestatistics.org/blog/index.php?pk=25805&T=3

As an alternative you can also use a QR Code:  

The GUIDs for individual cells are displayed in the table below:

Multiple Linear Regression - Regression Statistics
Multiple R0.970185957751532
R-squared0.941260792618257
Adjusted R-squared0.92501377781054
F-TEST (value)57.934383870397
F-TEST (DF numerator)13
F-TEST (DF denominator)47
p-value0
Multiple Linear Regression - Residual Statistics
Residual Standard Deviation3.44795854182024
Sum Squared Residuals558.755650987225


Multiple Linear Regression - Actuals, Interpolation, and Residuals
Time or IndexActualsInterpolationForecastResidualsPrediction Error
1104.3103.4663472706150.833652729384565
2119.8109.08589430894310.7141056910569
3116.8120.005894308943-3.20589430894311
4118.2118.765894308943-0.565894308943107
5107.4105.0658943089432.33410569105691
6110.8115.165894308943-4.3658943089431
794.893.40744483159121.3925551684088
896.593.52744483159122.97255516840881
9113.4109.9074448315913.49255516840883
10109.8110.467444831591-0.6674448315912
11118.7117.5874448315911.11255516840882
12117.2119.927444831591-2.72744483159118
13110.3108.5941753774681.7058246225319
14111.6114.213722415796-2.61372241579561
15128.1125.1337224157962.96627758420440
16121.3123.893722415796-2.59372241579559
17107.3110.193722415796-2.8937224157956
18120.5120.2937224157960.206277584204412
1998.598.5352729384437-0.0352729384436661
2097.798.6552729384437-0.955272938443672
21113.2115.035272938444-1.83527293844367
22114.6115.595272938444-0.995272938443663
23118.3122.715272938444-4.41527293844368
24123.9125.055272938444-1.15527293844367
25113.6113.722003484321-0.122003484320589
26117.5119.341550522648-1.84155052264808
27130.1130.261550522648-0.161550522648086
28124.7129.021550522648-4.32155052264808
29114.2115.321550522648-1.12155052264808
30127.3125.4215505226481.87844947735192
31105.9103.6631010452962.23689895470385
32101.5103.783101045296-2.28310104529616
33120.2120.1631010452960.0368989547038367
34117.1120.723101045296-3.62310104529615
35131.1127.8431010452963.25689895470383
36130130.183101045296-0.183101045296158
37120.6118.8498315911731.75016840882692
38123.1124.469378629501-1.36937862950058
39135.3135.389378629501-0.089378629500551
40134.1134.149378629501-0.0493786295005712
41123.7120.4493786295013.25062137049943
42134.6130.5493786295014.05062137049943
43108.3111.383176538908-3.08317653890825
44110.4111.503176538908-1.10317653890824
45127.8127.883176538908-0.0831765389082544
46126.6128.443176538908-1.84317653890824
47131.4135.563176538908-4.16317653890824
48141.1137.9031765389083.19682346109174
49127126.5699070847850.430092915214842
50127.3132.189454123113-4.88945412311267
51143.6143.1094541231130.490545876887339
52149.4141.8694541231137.53054587688735
53126.6128.169454123113-1.56945412311267
54136.5138.269454123113-1.76945412311265
55116116.511004645761-0.511004645760733
56118116.6310046457611.36899535423927
57131.4133.011004645761-1.61100464576074
58140.7133.5710046457617.12899535423926
59144.9140.6910046457614.20899535423927
60143.9143.0310046457610.868995354239274
61127.1131.697735191638-4.59773519163766

\begin{tabular}{lllllllll}
\hline
Multiple Linear Regression - Actuals, Interpolation, and Residuals \tabularnewline
Time or Index & Actuals & InterpolationForecast & ResidualsPrediction Error \tabularnewline
1 & 104.3 & 103.466347270615 & 0.833652729384565 \tabularnewline
2 & 119.8 & 109.085894308943 & 10.7141056910569 \tabularnewline
3 & 116.8 & 120.005894308943 & -3.20589430894311 \tabularnewline
4 & 118.2 & 118.765894308943 & -0.565894308943107 \tabularnewline
5 & 107.4 & 105.065894308943 & 2.33410569105691 \tabularnewline
6 & 110.8 & 115.165894308943 & -4.3658943089431 \tabularnewline
7 & 94.8 & 93.4074448315912 & 1.3925551684088 \tabularnewline
8 & 96.5 & 93.5274448315912 & 2.97255516840881 \tabularnewline
9 & 113.4 & 109.907444831591 & 3.49255516840883 \tabularnewline
10 & 109.8 & 110.467444831591 & -0.6674448315912 \tabularnewline
11 & 118.7 & 117.587444831591 & 1.11255516840882 \tabularnewline
12 & 117.2 & 119.927444831591 & -2.72744483159118 \tabularnewline
13 & 110.3 & 108.594175377468 & 1.7058246225319 \tabularnewline
14 & 111.6 & 114.213722415796 & -2.61372241579561 \tabularnewline
15 & 128.1 & 125.133722415796 & 2.96627758420440 \tabularnewline
16 & 121.3 & 123.893722415796 & -2.59372241579559 \tabularnewline
17 & 107.3 & 110.193722415796 & -2.8937224157956 \tabularnewline
18 & 120.5 & 120.293722415796 & 0.206277584204412 \tabularnewline
19 & 98.5 & 98.5352729384437 & -0.0352729384436661 \tabularnewline
20 & 97.7 & 98.6552729384437 & -0.955272938443672 \tabularnewline
21 & 113.2 & 115.035272938444 & -1.83527293844367 \tabularnewline
22 & 114.6 & 115.595272938444 & -0.995272938443663 \tabularnewline
23 & 118.3 & 122.715272938444 & -4.41527293844368 \tabularnewline
24 & 123.9 & 125.055272938444 & -1.15527293844367 \tabularnewline
25 & 113.6 & 113.722003484321 & -0.122003484320589 \tabularnewline
26 & 117.5 & 119.341550522648 & -1.84155052264808 \tabularnewline
27 & 130.1 & 130.261550522648 & -0.161550522648086 \tabularnewline
28 & 124.7 & 129.021550522648 & -4.32155052264808 \tabularnewline
29 & 114.2 & 115.321550522648 & -1.12155052264808 \tabularnewline
30 & 127.3 & 125.421550522648 & 1.87844947735192 \tabularnewline
31 & 105.9 & 103.663101045296 & 2.23689895470385 \tabularnewline
32 & 101.5 & 103.783101045296 & -2.28310104529616 \tabularnewline
33 & 120.2 & 120.163101045296 & 0.0368989547038367 \tabularnewline
34 & 117.1 & 120.723101045296 & -3.62310104529615 \tabularnewline
35 & 131.1 & 127.843101045296 & 3.25689895470383 \tabularnewline
36 & 130 & 130.183101045296 & -0.183101045296158 \tabularnewline
37 & 120.6 & 118.849831591173 & 1.75016840882692 \tabularnewline
38 & 123.1 & 124.469378629501 & -1.36937862950058 \tabularnewline
39 & 135.3 & 135.389378629501 & -0.089378629500551 \tabularnewline
40 & 134.1 & 134.149378629501 & -0.0493786295005712 \tabularnewline
41 & 123.7 & 120.449378629501 & 3.25062137049943 \tabularnewline
42 & 134.6 & 130.549378629501 & 4.05062137049943 \tabularnewline
43 & 108.3 & 111.383176538908 & -3.08317653890825 \tabularnewline
44 & 110.4 & 111.503176538908 & -1.10317653890824 \tabularnewline
45 & 127.8 & 127.883176538908 & -0.0831765389082544 \tabularnewline
46 & 126.6 & 128.443176538908 & -1.84317653890824 \tabularnewline
47 & 131.4 & 135.563176538908 & -4.16317653890824 \tabularnewline
48 & 141.1 & 137.903176538908 & 3.19682346109174 \tabularnewline
49 & 127 & 126.569907084785 & 0.430092915214842 \tabularnewline
50 & 127.3 & 132.189454123113 & -4.88945412311267 \tabularnewline
51 & 143.6 & 143.109454123113 & 0.490545876887339 \tabularnewline
52 & 149.4 & 141.869454123113 & 7.53054587688735 \tabularnewline
53 & 126.6 & 128.169454123113 & -1.56945412311267 \tabularnewline
54 & 136.5 & 138.269454123113 & -1.76945412311265 \tabularnewline
55 & 116 & 116.511004645761 & -0.511004645760733 \tabularnewline
56 & 118 & 116.631004645761 & 1.36899535423927 \tabularnewline
57 & 131.4 & 133.011004645761 & -1.61100464576074 \tabularnewline
58 & 140.7 & 133.571004645761 & 7.12899535423926 \tabularnewline
59 & 144.9 & 140.691004645761 & 4.20899535423927 \tabularnewline
60 & 143.9 & 143.031004645761 & 0.868995354239274 \tabularnewline
61 & 127.1 & 131.697735191638 & -4.59773519163766 \tabularnewline
\hline
\end{tabular}
%Source: https://freestatistics.org/blog/index.php?pk=25805&T=4

[TABLE]
[ROW][C]Multiple Linear Regression - Actuals, Interpolation, and Residuals[/C][/ROW]
[ROW][C]Time or Index[/C][C]Actuals[/C][C]InterpolationForecast[/C][C]ResidualsPrediction Error[/C][/ROW]
[ROW][C]1[/C][C]104.3[/C][C]103.466347270615[/C][C]0.833652729384565[/C][/ROW]
[ROW][C]2[/C][C]119.8[/C][C]109.085894308943[/C][C]10.7141056910569[/C][/ROW]
[ROW][C]3[/C][C]116.8[/C][C]120.005894308943[/C][C]-3.20589430894311[/C][/ROW]
[ROW][C]4[/C][C]118.2[/C][C]118.765894308943[/C][C]-0.565894308943107[/C][/ROW]
[ROW][C]5[/C][C]107.4[/C][C]105.065894308943[/C][C]2.33410569105691[/C][/ROW]
[ROW][C]6[/C][C]110.8[/C][C]115.165894308943[/C][C]-4.3658943089431[/C][/ROW]
[ROW][C]7[/C][C]94.8[/C][C]93.4074448315912[/C][C]1.3925551684088[/C][/ROW]
[ROW][C]8[/C][C]96.5[/C][C]93.5274448315912[/C][C]2.97255516840881[/C][/ROW]
[ROW][C]9[/C][C]113.4[/C][C]109.907444831591[/C][C]3.49255516840883[/C][/ROW]
[ROW][C]10[/C][C]109.8[/C][C]110.467444831591[/C][C]-0.6674448315912[/C][/ROW]
[ROW][C]11[/C][C]118.7[/C][C]117.587444831591[/C][C]1.11255516840882[/C][/ROW]
[ROW][C]12[/C][C]117.2[/C][C]119.927444831591[/C][C]-2.72744483159118[/C][/ROW]
[ROW][C]13[/C][C]110.3[/C][C]108.594175377468[/C][C]1.7058246225319[/C][/ROW]
[ROW][C]14[/C][C]111.6[/C][C]114.213722415796[/C][C]-2.61372241579561[/C][/ROW]
[ROW][C]15[/C][C]128.1[/C][C]125.133722415796[/C][C]2.96627758420440[/C][/ROW]
[ROW][C]16[/C][C]121.3[/C][C]123.893722415796[/C][C]-2.59372241579559[/C][/ROW]
[ROW][C]17[/C][C]107.3[/C][C]110.193722415796[/C][C]-2.8937224157956[/C][/ROW]
[ROW][C]18[/C][C]120.5[/C][C]120.293722415796[/C][C]0.206277584204412[/C][/ROW]
[ROW][C]19[/C][C]98.5[/C][C]98.5352729384437[/C][C]-0.0352729384436661[/C][/ROW]
[ROW][C]20[/C][C]97.7[/C][C]98.6552729384437[/C][C]-0.955272938443672[/C][/ROW]
[ROW][C]21[/C][C]113.2[/C][C]115.035272938444[/C][C]-1.83527293844367[/C][/ROW]
[ROW][C]22[/C][C]114.6[/C][C]115.595272938444[/C][C]-0.995272938443663[/C][/ROW]
[ROW][C]23[/C][C]118.3[/C][C]122.715272938444[/C][C]-4.41527293844368[/C][/ROW]
[ROW][C]24[/C][C]123.9[/C][C]125.055272938444[/C][C]-1.15527293844367[/C][/ROW]
[ROW][C]25[/C][C]113.6[/C][C]113.722003484321[/C][C]-0.122003484320589[/C][/ROW]
[ROW][C]26[/C][C]117.5[/C][C]119.341550522648[/C][C]-1.84155052264808[/C][/ROW]
[ROW][C]27[/C][C]130.1[/C][C]130.261550522648[/C][C]-0.161550522648086[/C][/ROW]
[ROW][C]28[/C][C]124.7[/C][C]129.021550522648[/C][C]-4.32155052264808[/C][/ROW]
[ROW][C]29[/C][C]114.2[/C][C]115.321550522648[/C][C]-1.12155052264808[/C][/ROW]
[ROW][C]30[/C][C]127.3[/C][C]125.421550522648[/C][C]1.87844947735192[/C][/ROW]
[ROW][C]31[/C][C]105.9[/C][C]103.663101045296[/C][C]2.23689895470385[/C][/ROW]
[ROW][C]32[/C][C]101.5[/C][C]103.783101045296[/C][C]-2.28310104529616[/C][/ROW]
[ROW][C]33[/C][C]120.2[/C][C]120.163101045296[/C][C]0.0368989547038367[/C][/ROW]
[ROW][C]34[/C][C]117.1[/C][C]120.723101045296[/C][C]-3.62310104529615[/C][/ROW]
[ROW][C]35[/C][C]131.1[/C][C]127.843101045296[/C][C]3.25689895470383[/C][/ROW]
[ROW][C]36[/C][C]130[/C][C]130.183101045296[/C][C]-0.183101045296158[/C][/ROW]
[ROW][C]37[/C][C]120.6[/C][C]118.849831591173[/C][C]1.75016840882692[/C][/ROW]
[ROW][C]38[/C][C]123.1[/C][C]124.469378629501[/C][C]-1.36937862950058[/C][/ROW]
[ROW][C]39[/C][C]135.3[/C][C]135.389378629501[/C][C]-0.089378629500551[/C][/ROW]
[ROW][C]40[/C][C]134.1[/C][C]134.149378629501[/C][C]-0.0493786295005712[/C][/ROW]
[ROW][C]41[/C][C]123.7[/C][C]120.449378629501[/C][C]3.25062137049943[/C][/ROW]
[ROW][C]42[/C][C]134.6[/C][C]130.549378629501[/C][C]4.05062137049943[/C][/ROW]
[ROW][C]43[/C][C]108.3[/C][C]111.383176538908[/C][C]-3.08317653890825[/C][/ROW]
[ROW][C]44[/C][C]110.4[/C][C]111.503176538908[/C][C]-1.10317653890824[/C][/ROW]
[ROW][C]45[/C][C]127.8[/C][C]127.883176538908[/C][C]-0.0831765389082544[/C][/ROW]
[ROW][C]46[/C][C]126.6[/C][C]128.443176538908[/C][C]-1.84317653890824[/C][/ROW]
[ROW][C]47[/C][C]131.4[/C][C]135.563176538908[/C][C]-4.16317653890824[/C][/ROW]
[ROW][C]48[/C][C]141.1[/C][C]137.903176538908[/C][C]3.19682346109174[/C][/ROW]
[ROW][C]49[/C][C]127[/C][C]126.569907084785[/C][C]0.430092915214842[/C][/ROW]
[ROW][C]50[/C][C]127.3[/C][C]132.189454123113[/C][C]-4.88945412311267[/C][/ROW]
[ROW][C]51[/C][C]143.6[/C][C]143.109454123113[/C][C]0.490545876887339[/C][/ROW]
[ROW][C]52[/C][C]149.4[/C][C]141.869454123113[/C][C]7.53054587688735[/C][/ROW]
[ROW][C]53[/C][C]126.6[/C][C]128.169454123113[/C][C]-1.56945412311267[/C][/ROW]
[ROW][C]54[/C][C]136.5[/C][C]138.269454123113[/C][C]-1.76945412311265[/C][/ROW]
[ROW][C]55[/C][C]116[/C][C]116.511004645761[/C][C]-0.511004645760733[/C][/ROW]
[ROW][C]56[/C][C]118[/C][C]116.631004645761[/C][C]1.36899535423927[/C][/ROW]
[ROW][C]57[/C][C]131.4[/C][C]133.011004645761[/C][C]-1.61100464576074[/C][/ROW]
[ROW][C]58[/C][C]140.7[/C][C]133.571004645761[/C][C]7.12899535423926[/C][/ROW]
[ROW][C]59[/C][C]144.9[/C][C]140.691004645761[/C][C]4.20899535423927[/C][/ROW]
[ROW][C]60[/C][C]143.9[/C][C]143.031004645761[/C][C]0.868995354239274[/C][/ROW]
[ROW][C]61[/C][C]127.1[/C][C]131.697735191638[/C][C]-4.59773519163766[/C][/ROW]
[/TABLE]
Source: https://freestatistics.org/blog/index.php?pk=25805&T=4

Globally Unique Identifier (entire table): ba.freestatistics.org/blog/index.php?pk=25805&T=4

As an alternative you can also use a QR Code:  

The GUIDs for individual cells are displayed in the table below:

Multiple Linear Regression - Actuals, Interpolation, and Residuals
Time or IndexActualsInterpolationForecastResidualsPrediction Error
1104.3103.4663472706150.833652729384565
2119.8109.08589430894310.7141056910569
3116.8120.005894308943-3.20589430894311
4118.2118.765894308943-0.565894308943107
5107.4105.0658943089432.33410569105691
6110.8115.165894308943-4.3658943089431
794.893.40744483159121.3925551684088
896.593.52744483159122.97255516840881
9113.4109.9074448315913.49255516840883
10109.8110.467444831591-0.6674448315912
11118.7117.5874448315911.11255516840882
12117.2119.927444831591-2.72744483159118
13110.3108.5941753774681.7058246225319
14111.6114.213722415796-2.61372241579561
15128.1125.1337224157962.96627758420440
16121.3123.893722415796-2.59372241579559
17107.3110.193722415796-2.8937224157956
18120.5120.2937224157960.206277584204412
1998.598.5352729384437-0.0352729384436661
2097.798.6552729384437-0.955272938443672
21113.2115.035272938444-1.83527293844367
22114.6115.595272938444-0.995272938443663
23118.3122.715272938444-4.41527293844368
24123.9125.055272938444-1.15527293844367
25113.6113.722003484321-0.122003484320589
26117.5119.341550522648-1.84155052264808
27130.1130.261550522648-0.161550522648086
28124.7129.021550522648-4.32155052264808
29114.2115.321550522648-1.12155052264808
30127.3125.4215505226481.87844947735192
31105.9103.6631010452962.23689895470385
32101.5103.783101045296-2.28310104529616
33120.2120.1631010452960.0368989547038367
34117.1120.723101045296-3.62310104529615
35131.1127.8431010452963.25689895470383
36130130.183101045296-0.183101045296158
37120.6118.8498315911731.75016840882692
38123.1124.469378629501-1.36937862950058
39135.3135.389378629501-0.089378629500551
40134.1134.149378629501-0.0493786295005712
41123.7120.4493786295013.25062137049943
42134.6130.5493786295014.05062137049943
43108.3111.383176538908-3.08317653890825
44110.4111.503176538908-1.10317653890824
45127.8127.883176538908-0.0831765389082544
46126.6128.443176538908-1.84317653890824
47131.4135.563176538908-4.16317653890824
48141.1137.9031765389083.19682346109174
49127126.5699070847850.430092915214842
50127.3132.189454123113-4.88945412311267
51143.6143.1094541231130.490545876887339
52149.4141.8694541231137.53054587688735
53126.6128.169454123113-1.56945412311267
54136.5138.269454123113-1.76945412311265
55116116.511004645761-0.511004645760733
56118116.6310046457611.36899535423927
57131.4133.011004645761-1.61100464576074
58140.7133.5710046457617.12899535423926
59144.9140.6910046457614.20899535423927
60143.9143.0310046457610.868995354239274
61127.1131.697735191638-4.59773519163766


Goldfeld-Quandt test for Heteroskedasticity
p-valuesAlternative Hypothesis
breakpoint indexgreater2-sidedless
170.982652720041470.03469455991705850.0173472799585293
180.9806783267403910.03864334651921760.0193216732596088
190.960425953935750.07914809212850060.0395740460642503
200.9316717585258320.1366564829483360.0683282414741679
210.896963144925170.2060737101496600.103036855074830
220.8403346094993830.3193307810012340.159665390500617
230.8049789753365920.3900420493268160.195021024663408
240.7512619964929350.4974760070141310.248738003507065
250.6783606916747820.6432786166504360.321639308325218
260.6242784712162730.7514430575674540.375721528783727
270.5550181444955570.8899637110088860.444981855504443
280.5520916297033330.8958167405933330.447908370296667
290.4628576339376790.9257152678753580.537142366062321
300.4854089175553070.9708178351106140.514591082444693
310.4579727616474050.915945523294810.542027238352595
320.3806657342890950.761331468578190.619334265710905
330.2924270291386270.5848540582772550.707572970861372
340.3223753184771020.6447506369542040.677624681522898
350.3390299319459420.6780598638918850.660970068054058
360.2893291234410000.5786582468819990.710670876559
370.2398252561280150.479650512256030.760174743871985
380.1816805315313100.3633610630626190.81831946846869
390.1218845149160350.2437690298320710.878115485083965
400.3093630897250260.6187261794500520.690636910274974
410.2403248626781290.4806497253562570.759675137321871
420.1791544844011810.3583089688023630.820845515598819
430.1021930741183120.2043861482366230.897806925881688
440.05161467364177480.1032293472835500.948385326358225

\begin{tabular}{lllllllll}
\hline
Goldfeld-Quandt test for Heteroskedasticity \tabularnewline
p-values & Alternative Hypothesis \tabularnewline
breakpoint index & greater & 2-sided & less \tabularnewline
17 & 0.98265272004147 & 0.0346945599170585 & 0.0173472799585293 \tabularnewline
18 & 0.980678326740391 & 0.0386433465192176 & 0.0193216732596088 \tabularnewline
19 & 0.96042595393575 & 0.0791480921285006 & 0.0395740460642503 \tabularnewline
20 & 0.931671758525832 & 0.136656482948336 & 0.0683282414741679 \tabularnewline
21 & 0.89696314492517 & 0.206073710149660 & 0.103036855074830 \tabularnewline
22 & 0.840334609499383 & 0.319330781001234 & 0.159665390500617 \tabularnewline
23 & 0.804978975336592 & 0.390042049326816 & 0.195021024663408 \tabularnewline
24 & 0.751261996492935 & 0.497476007014131 & 0.248738003507065 \tabularnewline
25 & 0.678360691674782 & 0.643278616650436 & 0.321639308325218 \tabularnewline
26 & 0.624278471216273 & 0.751443057567454 & 0.375721528783727 \tabularnewline
27 & 0.555018144495557 & 0.889963711008886 & 0.444981855504443 \tabularnewline
28 & 0.552091629703333 & 0.895816740593333 & 0.447908370296667 \tabularnewline
29 & 0.462857633937679 & 0.925715267875358 & 0.537142366062321 \tabularnewline
30 & 0.485408917555307 & 0.970817835110614 & 0.514591082444693 \tabularnewline
31 & 0.457972761647405 & 0.91594552329481 & 0.542027238352595 \tabularnewline
32 & 0.380665734289095 & 0.76133146857819 & 0.619334265710905 \tabularnewline
33 & 0.292427029138627 & 0.584854058277255 & 0.707572970861372 \tabularnewline
34 & 0.322375318477102 & 0.644750636954204 & 0.677624681522898 \tabularnewline
35 & 0.339029931945942 & 0.678059863891885 & 0.660970068054058 \tabularnewline
36 & 0.289329123441000 & 0.578658246881999 & 0.710670876559 \tabularnewline
37 & 0.239825256128015 & 0.47965051225603 & 0.760174743871985 \tabularnewline
38 & 0.181680531531310 & 0.363361063062619 & 0.81831946846869 \tabularnewline
39 & 0.121884514916035 & 0.243769029832071 & 0.878115485083965 \tabularnewline
40 & 0.309363089725026 & 0.618726179450052 & 0.690636910274974 \tabularnewline
41 & 0.240324862678129 & 0.480649725356257 & 0.759675137321871 \tabularnewline
42 & 0.179154484401181 & 0.358308968802363 & 0.820845515598819 \tabularnewline
43 & 0.102193074118312 & 0.204386148236623 & 0.897806925881688 \tabularnewline
44 & 0.0516146736417748 & 0.103229347283550 & 0.948385326358225 \tabularnewline
\hline
\end{tabular}
%Source: https://freestatistics.org/blog/index.php?pk=25805&T=5

[TABLE]
[ROW][C]Goldfeld-Quandt test for Heteroskedasticity[/C][/ROW]
[ROW][C]p-values[/C][C]Alternative Hypothesis[/C][/ROW]
[ROW][C]breakpoint index[/C][C]greater[/C][C]2-sided[/C][C]less[/C][/ROW]
[ROW][C]17[/C][C]0.98265272004147[/C][C]0.0346945599170585[/C][C]0.0173472799585293[/C][/ROW]
[ROW][C]18[/C][C]0.980678326740391[/C][C]0.0386433465192176[/C][C]0.0193216732596088[/C][/ROW]
[ROW][C]19[/C][C]0.96042595393575[/C][C]0.0791480921285006[/C][C]0.0395740460642503[/C][/ROW]
[ROW][C]20[/C][C]0.931671758525832[/C][C]0.136656482948336[/C][C]0.0683282414741679[/C][/ROW]
[ROW][C]21[/C][C]0.89696314492517[/C][C]0.206073710149660[/C][C]0.103036855074830[/C][/ROW]
[ROW][C]22[/C][C]0.840334609499383[/C][C]0.319330781001234[/C][C]0.159665390500617[/C][/ROW]
[ROW][C]23[/C][C]0.804978975336592[/C][C]0.390042049326816[/C][C]0.195021024663408[/C][/ROW]
[ROW][C]24[/C][C]0.751261996492935[/C][C]0.497476007014131[/C][C]0.248738003507065[/C][/ROW]
[ROW][C]25[/C][C]0.678360691674782[/C][C]0.643278616650436[/C][C]0.321639308325218[/C][/ROW]
[ROW][C]26[/C][C]0.624278471216273[/C][C]0.751443057567454[/C][C]0.375721528783727[/C][/ROW]
[ROW][C]27[/C][C]0.555018144495557[/C][C]0.889963711008886[/C][C]0.444981855504443[/C][/ROW]
[ROW][C]28[/C][C]0.552091629703333[/C][C]0.895816740593333[/C][C]0.447908370296667[/C][/ROW]
[ROW][C]29[/C][C]0.462857633937679[/C][C]0.925715267875358[/C][C]0.537142366062321[/C][/ROW]
[ROW][C]30[/C][C]0.485408917555307[/C][C]0.970817835110614[/C][C]0.514591082444693[/C][/ROW]
[ROW][C]31[/C][C]0.457972761647405[/C][C]0.91594552329481[/C][C]0.542027238352595[/C][/ROW]
[ROW][C]32[/C][C]0.380665734289095[/C][C]0.76133146857819[/C][C]0.619334265710905[/C][/ROW]
[ROW][C]33[/C][C]0.292427029138627[/C][C]0.584854058277255[/C][C]0.707572970861372[/C][/ROW]
[ROW][C]34[/C][C]0.322375318477102[/C][C]0.644750636954204[/C][C]0.677624681522898[/C][/ROW]
[ROW][C]35[/C][C]0.339029931945942[/C][C]0.678059863891885[/C][C]0.660970068054058[/C][/ROW]
[ROW][C]36[/C][C]0.289329123441000[/C][C]0.578658246881999[/C][C]0.710670876559[/C][/ROW]
[ROW][C]37[/C][C]0.239825256128015[/C][C]0.47965051225603[/C][C]0.760174743871985[/C][/ROW]
[ROW][C]38[/C][C]0.181680531531310[/C][C]0.363361063062619[/C][C]0.81831946846869[/C][/ROW]
[ROW][C]39[/C][C]0.121884514916035[/C][C]0.243769029832071[/C][C]0.878115485083965[/C][/ROW]
[ROW][C]40[/C][C]0.309363089725026[/C][C]0.618726179450052[/C][C]0.690636910274974[/C][/ROW]
[ROW][C]41[/C][C]0.240324862678129[/C][C]0.480649725356257[/C][C]0.759675137321871[/C][/ROW]
[ROW][C]42[/C][C]0.179154484401181[/C][C]0.358308968802363[/C][C]0.820845515598819[/C][/ROW]
[ROW][C]43[/C][C]0.102193074118312[/C][C]0.204386148236623[/C][C]0.897806925881688[/C][/ROW]
[ROW][C]44[/C][C]0.0516146736417748[/C][C]0.103229347283550[/C][C]0.948385326358225[/C][/ROW]
[/TABLE]
Source: https://freestatistics.org/blog/index.php?pk=25805&T=5

Globally Unique Identifier (entire table): ba.freestatistics.org/blog/index.php?pk=25805&T=5

As an alternative you can also use a QR Code:  

The GUIDs for individual cells are displayed in the table below:

Goldfeld-Quandt test for Heteroskedasticity
p-valuesAlternative Hypothesis
breakpoint indexgreater2-sidedless
170.982652720041470.03469455991705850.0173472799585293
180.9806783267403910.03864334651921760.0193216732596088
190.960425953935750.07914809212850060.0395740460642503
200.9316717585258320.1366564829483360.0683282414741679
210.896963144925170.2060737101496600.103036855074830
220.8403346094993830.3193307810012340.159665390500617
230.8049789753365920.3900420493268160.195021024663408
240.7512619964929350.4974760070141310.248738003507065
250.6783606916747820.6432786166504360.321639308325218
260.6242784712162730.7514430575674540.375721528783727
270.5550181444955570.8899637110088860.444981855504443
280.5520916297033330.8958167405933330.447908370296667
290.4628576339376790.9257152678753580.537142366062321
300.4854089175553070.9708178351106140.514591082444693
310.4579727616474050.915945523294810.542027238352595
320.3806657342890950.761331468578190.619334265710905
330.2924270291386270.5848540582772550.707572970861372
340.3223753184771020.6447506369542040.677624681522898
350.3390299319459420.6780598638918850.660970068054058
360.2893291234410000.5786582468819990.710670876559
370.2398252561280150.479650512256030.760174743871985
380.1816805315313100.3633610630626190.81831946846869
390.1218845149160350.2437690298320710.878115485083965
400.3093630897250260.6187261794500520.690636910274974
410.2403248626781290.4806497253562570.759675137321871
420.1791544844011810.3583089688023630.820845515598819
430.1021930741183120.2043861482366230.897806925881688
440.05161467364177480.1032293472835500.948385326358225


Meta Analysis of Goldfeld-Quandt test for Heteroskedasticity
Description# significant tests% significant testsOK/NOK
1% type I error level00OK
5% type I error level20.0714285714285714NOK
10% type I error level30.107142857142857NOK

\begin{tabular}{lllllllll}
\hline
Meta Analysis of Goldfeld-Quandt test for Heteroskedasticity \tabularnewline
Description & # significant tests & % significant tests & OK/NOK \tabularnewline
1% type I error level & 0 & 0 & OK \tabularnewline
5% type I error level & 2 & 0.0714285714285714 & NOK \tabularnewline
10% type I error level & 3 & 0.107142857142857 & NOK \tabularnewline
\hline
\end{tabular}
%Source: https://freestatistics.org/blog/index.php?pk=25805&T=6

[TABLE]
[ROW][C]Meta Analysis of Goldfeld-Quandt test for Heteroskedasticity[/C][/ROW]
[ROW][C]Description[/C][C]# significant tests[/C][C]% significant tests[/C][C]OK/NOK[/C][/ROW]
[ROW][C]1% type I error level[/C][C]0[/C][C]0[/C][C]OK[/C][/ROW]
[ROW][C]5% type I error level[/C][C]2[/C][C]0.0714285714285714[/C][C]NOK[/C][/ROW]
[ROW][C]10% type I error level[/C][C]3[/C][C]0.107142857142857[/C][C]NOK[/C][/ROW]
[/TABLE]
Source: https://freestatistics.org/blog/index.php?pk=25805&T=6

Globally Unique Identifier (entire table): ba.freestatistics.org/blog/index.php?pk=25805&T=6

As an alternative you can also use a QR Code:  

The GUIDs for individual cells are displayed in the table below:

Meta Analysis of Goldfeld-Quandt test for Heteroskedasticity
Description# significant tests% significant testsOK/NOK
1% type I error level00OK
5% type I error level20.0714285714285714NOK
10% type I error level30.107142857142857NOK


Parameters (Session):
par1 = 1 ; par2 = Include Monthly Dummies ; par3 = Linear Trend ;
Parameters (R input):
par1 = 1 ; par2 = Include Monthly Dummies ; par3 = Linear Trend ;
R code (references can be found in the software module):
library(lattice)
library(lmtest)
n25 <- 25 #minimum number of obs. for Goldfeld-Quandt test
par1 <- as.numeric(par1)
x <- t(y)
k <- length(x[1,])
n <- length(x[,1])
x1 <- cbind(x[,par1], x[,1:k!=par1])
mycolnames <- c(colnames(x)[par1], colnames(x)[1:k!=par1])
colnames(x1) <- mycolnames #colnames(x)[par1]
x <- x1
if (par3 == 'First Differences'){
x2 <- array(0, dim=c(n-1,k), dimnames=list(1:(n-1), paste('(1-B)',colnames(x),sep='')))
for (i in 1:n-1) {
for (j in 1:k) {
x2[i,j] <- x[i+1,j] - x[i,j]
}
}
x <- x2
}
if (par2 == 'Include Monthly Dummies'){
x2 <- array(0, dim=c(n,11), dimnames=list(1:n, paste('M', seq(1:11), sep ='')))
for (i in 1:11){
x2[seq(i,n,12),i] <- 1
}
x <- cbind(x, x2)
}
if (par2 == 'Include Quarterly Dummies'){
x2 <- array(0, dim=c(n,3), dimnames=list(1:n, paste('Q', seq(1:3), sep ='')))
for (i in 1:3){
x2[seq(i,n,4),i] <- 1
}
x <- cbind(x, x2)
}
k <- length(x[1,])
if (par3 == 'Linear Trend'){
x <- cbind(x, c(1:n))
colnames(x)[k+1] <- 't'
}
x
k <- length(x[1,])
df <- as.data.frame(x)
(mylm <- lm(df))
(mysum <- summary(mylm))
if (n > n25) {
kp3 <- k + 3
nmkm3 <- n - k - 3
gqarr <- array(NA, dim=c(nmkm3-kp3+1,3))
numgqtests <- 0
numsignificant1 <- 0
numsignificant5 <- 0
numsignificant10 <- 0
for (mypoint in kp3:nmkm3) {
j <- 0
numgqtests <- numgqtests + 1
for (myalt in c('greater', 'two.sided', 'less')) {
j <- j + 1
gqarr[mypoint-kp3+1,j] <- gqtest(mylm, point=mypoint, alternative=myalt)$p.value
}
if (gqarr[mypoint-kp3+1,2] < 0.01) numsignificant1 <- numsignificant1 + 1
if (gqarr[mypoint-kp3+1,2] < 0.05) numsignificant5 <- numsignificant5 + 1
if (gqarr[mypoint-kp3+1,2] < 0.10) numsignificant10 <- numsignificant10 + 1
}
gqarr
}
bitmap(file='test0.png')
plot(x[,1], type='l', main='Actuals and Interpolation', ylab='value of Actuals and Interpolation (dots)', xlab='time or index')
points(x[,1]-mysum$resid)
grid()
dev.off()
bitmap(file='test1.png')
plot(mysum$resid, type='b', pch=19, main='Residuals', ylab='value of Residuals', xlab='time or index')
grid()
dev.off()
bitmap(file='test2.png')
hist(mysum$resid, main='Residual Histogram', xlab='values of Residuals')
grid()
dev.off()
bitmap(file='test3.png')
densityplot(~mysum$resid,col='black',main='Residual Density Plot', xlab='values of Residuals')
dev.off()
bitmap(file='test4.png')
qqnorm(mysum$resid, main='Residual Normal Q-Q Plot')
qqline(mysum$resid)
grid()
dev.off()
(myerror <- as.ts(mysum$resid))
bitmap(file='test5.png')
dum <- cbind(lag(myerror,k=1),myerror)
dum
dum1 <- dum[2:length(myerror),]
dum1
z <- as.data.frame(dum1)
z
plot(z,main=paste('Residual Lag plot, lowess, and regression line'), ylab='values of Residuals', xlab='lagged values of Residuals')
lines(lowess(z))
abline(lm(z))
grid()
dev.off()
bitmap(file='test6.png')
acf(mysum$resid, lag.max=length(mysum$resid)/2, main='Residual Autocorrelation Function')
grid()
dev.off()
bitmap(file='test7.png')
pacf(mysum$resid, lag.max=length(mysum$resid)/2, main='Residual Partial Autocorrelation Function')
grid()
dev.off()
bitmap(file='test8.png')
opar <- par(mfrow = c(2,2), oma = c(0, 0, 1.1, 0))
plot(mylm, las = 1, sub='Residual Diagnostics')
par(opar)
dev.off()
if (n > n25) {
bitmap(file='test9.png')
plot(kp3:nmkm3,gqarr[,2], main='Goldfeld-Quandt test',ylab='2-sided p-value',xlab='breakpoint')
grid()
dev.off()
}
load(file='createtable')
a<-table.start()
a<-table.row.start(a)
a<-table.element(a, 'Multiple Linear Regression - Estimated Regression Equation', 1, TRUE)
a<-table.row.end(a)
myeq <- colnames(x)[1]
myeq <- paste(myeq, '[t] = ', sep='')
for (i in 1:k){
if (mysum$coefficients[i,1] > 0) myeq <- paste(myeq, '+', '')
myeq <- paste(myeq, mysum$coefficients[i,1], sep=' ')
if (rownames(mysum$coefficients)[i] != '(Intercept)') {
myeq <- paste(myeq, rownames(mysum$coefficients)[i], sep='')
if (rownames(mysum$coefficients)[i] != 't') myeq <- paste(myeq, '[t]', sep='')
}
}
myeq <- paste(myeq, ' + e[t]')
a<-table.row.start(a)
a<-table.element(a, myeq)
a<-table.row.end(a)
a<-table.end(a)
table.save(a,file='mytable1.tab')
a<-table.start()
a<-table.row.start(a)
a<-table.element(a,hyperlink('ols1.htm','Multiple Linear Regression - Ordinary Least Squares',''), 6, TRUE)
a<-table.row.end(a)
a<-table.row.start(a)
a<-table.element(a,'Variable',header=TRUE)
a<-table.element(a,'Parameter',header=TRUE)
a<-table.element(a,'S.D.',header=TRUE)
a<-table.element(a,'T-STAT
H0: parameter = 0',header=TRUE)
a<-table.element(a,'2-tail p-value',header=TRUE)
a<-table.element(a,'1-tail p-value',header=TRUE)
a<-table.row.end(a)
for (i in 1:k){
a<-table.row.start(a)
a<-table.element(a,rownames(mysum$coefficients)[i],header=TRUE)
a<-table.element(a,mysum$coefficients[i,1])
a<-table.element(a, round(mysum$coefficients[i,2],6))
a<-table.element(a, round(mysum$coefficients[i,3],4))
a<-table.element(a, round(mysum$coefficients[i,4],6))
a<-table.element(a, round(mysum$coefficients[i,4]/2,6))
a<-table.row.end(a)
}
a<-table.end(a)
table.save(a,file='mytable2.tab')
a<-table.start()
a<-table.row.start(a)
a<-table.element(a, 'Multiple Linear Regression - Regression Statistics', 2, TRUE)
a<-table.row.end(a)
a<-table.row.start(a)
a<-table.element(a, 'Multiple R',1,TRUE)
a<-table.element(a, sqrt(mysum$r.squared))
a<-table.row.end(a)
a<-table.row.start(a)
a<-table.element(a, 'R-squared',1,TRUE)
a<-table.element(a, mysum$r.squared)
a<-table.row.end(a)
a<-table.row.start(a)
a<-table.element(a, 'Adjusted R-squared',1,TRUE)
a<-table.element(a, mysum$adj.r.squared)
a<-table.row.end(a)
a<-table.row.start(a)
a<-table.element(a, 'F-TEST (value)',1,TRUE)
a<-table.element(a, mysum$fstatistic[1])
a<-table.row.end(a)
a<-table.row.start(a)
a<-table.element(a, 'F-TEST (DF numerator)',1,TRUE)
a<-table.element(a, mysum$fstatistic[2])
a<-table.row.end(a)
a<-table.row.start(a)
a<-table.element(a, 'F-TEST (DF denominator)',1,TRUE)
a<-table.element(a, mysum$fstatistic[3])
a<-table.row.end(a)
a<-table.row.start(a)
a<-table.element(a, 'p-value',1,TRUE)
a<-table.element(a, 1-pf(mysum$fstatistic[1],mysum$fstatistic[2],mysum$fstatistic[3]))
a<-table.row.end(a)
a<-table.row.start(a)
a<-table.element(a, 'Multiple Linear Regression - Residual Statistics', 2, TRUE)
a<-table.row.end(a)
a<-table.row.start(a)
a<-table.element(a, 'Residual Standard Deviation',1,TRUE)
a<-table.element(a, mysum$sigma)
a<-table.row.end(a)
a<-table.row.start(a)
a<-table.element(a, 'Sum Squared Residuals',1,TRUE)
a<-table.element(a, sum(myerror*myerror))
a<-table.row.end(a)
a<-table.end(a)
table.save(a,file='mytable3.tab')
a<-table.start()
a<-table.row.start(a)
a<-table.element(a, 'Multiple Linear Regression - Actuals, Interpolation, and Residuals', 4, TRUE)
a<-table.row.end(a)
a<-table.row.start(a)
a<-table.element(a, 'Time or Index', 1, TRUE)
a<-table.element(a, 'Actuals', 1, TRUE)
a<-table.element(a, 'Interpolation
Forecast', 1, TRUE)
a<-table.element(a, 'Residuals
Prediction Error', 1, TRUE)
a<-table.row.end(a)
for (i in 1:n) {
a<-table.row.start(a)
a<-table.element(a,i, 1, TRUE)
a<-table.element(a,x[i])
a<-table.element(a,x[i]-mysum$resid[i])
a<-table.element(a,mysum$resid[i])
a<-table.row.end(a)
}
a<-table.end(a)
table.save(a,file='mytable4.tab')
if (n > n25) {
a<-table.start()
a<-table.row.start(a)
a<-table.element(a,'Goldfeld-Quandt test for Heteroskedasticity',4,TRUE)
a<-table.row.end(a)
a<-table.row.start(a)
a<-table.element(a,'p-values',header=TRUE)
a<-table.element(a,'Alternative Hypothesis',3,header=TRUE)
a<-table.row.end(a)
a<-table.row.start(a)
a<-table.element(a,'breakpoint index',header=TRUE)
a<-table.element(a,'greater',header=TRUE)
a<-table.element(a,'2-sided',header=TRUE)
a<-table.element(a,'less',header=TRUE)
a<-table.row.end(a)
for (mypoint in kp3:nmkm3) {
a<-table.row.start(a)
a<-table.element(a,mypoint,header=TRUE)
a<-table.element(a,gqarr[mypoint-kp3+1,1])
a<-table.element(a,gqarr[mypoint-kp3+1,2])
a<-table.element(a,gqarr[mypoint-kp3+1,3])
a<-table.row.end(a)
}
a<-table.end(a)
table.save(a,file='mytable5.tab')
a<-table.start()
a<-table.row.start(a)
a<-table.element(a,'Meta Analysis of Goldfeld-Quandt test for Heteroskedasticity',4,TRUE)
a<-table.row.end(a)
a<-table.row.start(a)
a<-table.element(a,'Description',header=TRUE)
a<-table.element(a,'# significant tests',header=TRUE)
a<-table.element(a,'% significant tests',header=TRUE)
a<-table.element(a,'OK/NOK',header=TRUE)
a<-table.row.end(a)
a<-table.row.start(a)
a<-table.element(a,'1% type I error level',header=TRUE)
a<-table.element(a,numsignificant1)
a<-table.element(a,numsignificant1/numgqtests)
if (numsignificant1/numgqtests < 0.01) dum <- 'OK' else dum <- 'NOK'
a<-table.element(a,dum)
a<-table.row.end(a)
a<-table.row.start(a)
a<-table.element(a,'5% type I error level',header=TRUE)
a<-table.element(a,numsignificant5)
a<-table.element(a,numsignificant5/numgqtests)
if (numsignificant5/numgqtests < 0.05) dum <- 'OK' else dum <- 'NOK'
a<-table.element(a,dum)
a<-table.row.end(a)
a<-table.row.start(a)
a<-table.element(a,'10% type I error level',header=TRUE)
a<-table.element(a,numsignificant10)
a<-table.element(a,numsignificant10/numgqtests)
if (numsignificant10/numgqtests < 0.1) dum <- 'OK' else dum <- 'NOK'
a<-table.element(a,dum)
a<-table.row.end(a)
a<-table.end(a)
table.save(a,file='mytable6.tab')
}