Free Statistics

of Irreproducible Research!

Author's title

Author*Unverified author*
R Software Modulerwasp_multipleregression.wasp
Title produced by softwareMultiple Regression
Date of computationThu, 27 Nov 2008 06:17:01 -0700
Cite this page as followsStatistical Computations at FreeStatistics.org, Office for Research Development and Education, URL https://freestatistics.org/blog/index.php?v=date/2008/Nov/27/t1227791934jch1wd8pu35q9ax.htm/, Retrieved Sun, 19 May 2024 12:15:05 +0000
Statistical Computations at FreeStatistics.org, Office for Research Development and Education, URL https://freestatistics.org/blog/index.php?pk=25802, Retrieved Sun, 19 May 2024 12:15:05 +0000
QR Codes:

Original text written by user:
IsPrivate?No (this computation is public)
User-defined keywords
Estimated Impact144
Family? (F = Feedback message, R = changed R code, M = changed R Module, P = changed Parameters, D = changed Data)
F       [Multiple Regression] [multiple linear r...] [2008-11-27 13:17:01] [266b6f199ef3d9a738d4198d1c90425d] [Current]
-   P     [Multiple Regression] [met lineaire trend] [2008-12-01 12:52:41] [f77c9ab3b413812d7baee6b7ec69a15d]
Feedback Forum
2008-12-01 12:56:09 [Charis Berrevoets] [reply
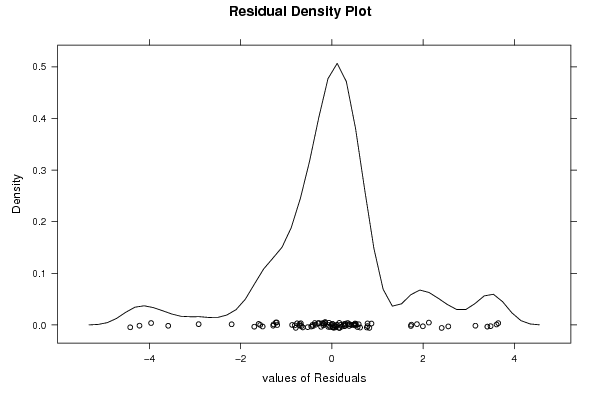
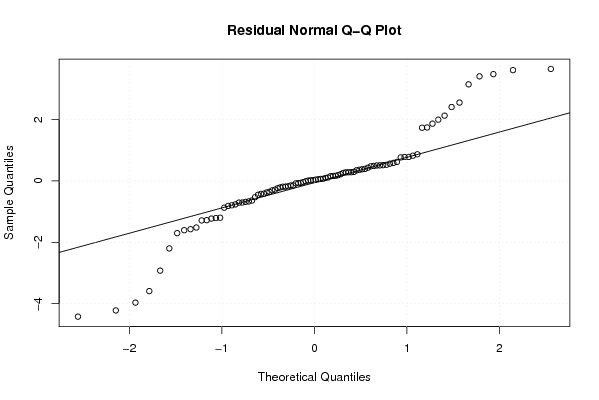
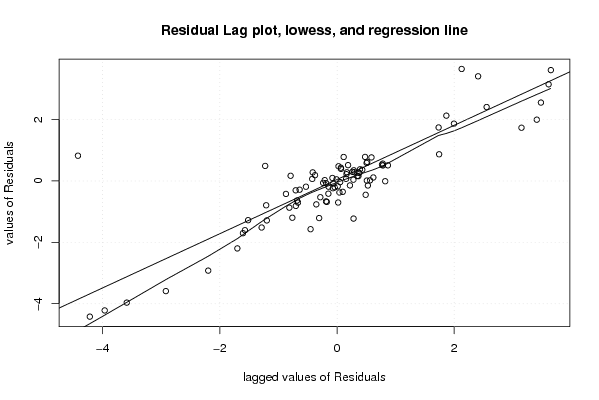
Je berekening ziet er heel juist uit. Maar je geeft wederom niet veel uitleg. De seizoenaliteit die je in je berekening hebt opgenomen bespreek je amper. Je hebt geen lineaire trend opgenomen maar waarom zeg je niet. Wat je zegt bij de grafieken die je bespreekt is correct, maar je had er meer kunnen bespreken. Verder spreek je je er ook niet over uit of dit nu een goed model is, of dat er nog verbeteringen moeten aangebracht worden of niet.
Ik heb een lineaire trend ingevoerd in je model:
http://www.freestatistics.org/blog/index.php?v=date/2008/Dec/01/t12281360529b42t3y22w00ard.htm
Hier is te zien dat het invoeren van een lineaire trend een verbetering betekent voor je model. De R²-waarde verhoogd tot 86% ipv 76%. De p-waarde hierbij is 0 dus we mogen aannemen dat dit een significant model is.
Kortom: wat je zegt is allemaal wel juist, maar je zegt eigenlijk te weinig. Je model had je nog verder kunnen uitzoeken en de conclusie kan veel uitgebreider.
2008-12-01 14:15:52 [Dave Bellekens] [reply
Wat je zegt klopt wel, maar je verklaringen zijn erg beknopt.

- Je geeft niet weer aan welke parameter we kunnen zien dat het model 76% verklaart.
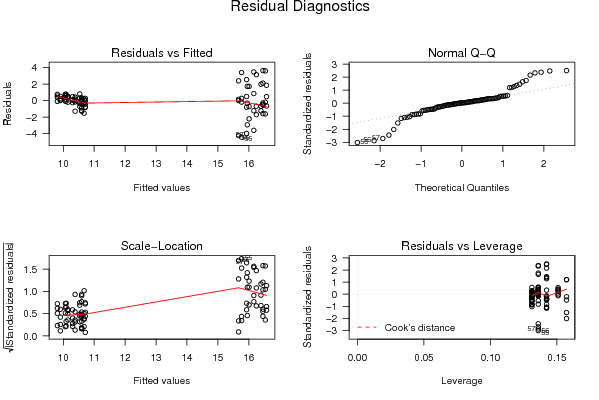
- Je geeft weer dat de residuals vaak dicht bij nul liggen, maar correcter is dat je zegt dat het gemiddelde van al de punten gelijk aan 0 moet zijn en dat is duidelijk niet het geval
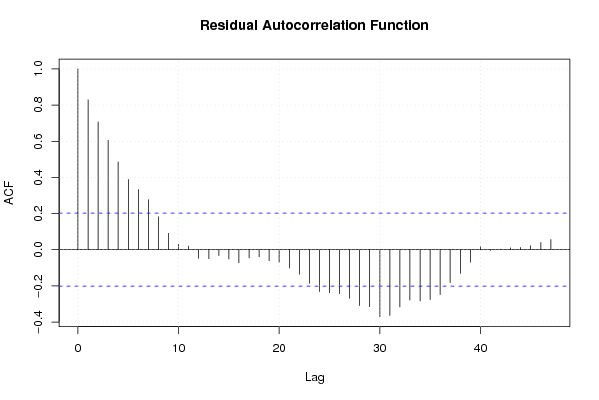
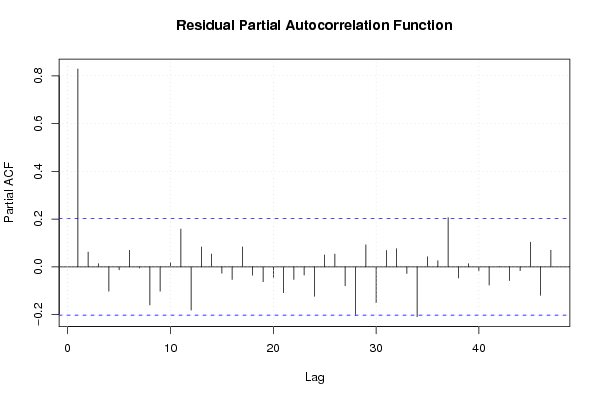
- Je bespreekt niets van de autocorrelatie
- en trekt daarom ook geen globale conclusie of dit nu al dan niet een goed model is

Post a new message
Dataseries X:
9.103	0
9.155	0
9.308	0
9.394	0
9.948	0
10.177	0
10.002	0
9.728	0
10.002	0
10.063	0
10.018	0
9.96	0
10.236	0
10.893	0
10.756	0
10.94	0
10.997	0
10.827	0
10.166	0
10.186	0
10.457	0
10.368	0
10.244	0
10.511	0
10.812	0
10.738	0
10.171	0
9.721	0
9.897	0
9.828	0
9.924	0
10.371	0
10.846	0
10.413	0
10.709	0
10.662	0
10.57	0
10.297	0
10.635	0
10.872	0
10.296	0
10.383	0
10.431	0
10.574	0
10.653	0
10.805	0
10.872	0
10.625	0
10.407	0
10.463	0
10.556	0
10.646	0
10.702	0
11.353	0
11.346	1
11.451	1
11.964	1
12.574	1
13.031	1
13.812	1
14.544	1
14.931	1
14.886	1
16.005	1
17.064	1
15.168	1
16.05	1
15.839	1
15.137	1
14.954	1
15.648	1
15.305	1
15.579	1
16.348	1
15.928	1
16.171	1
15.937	1
15.713	1
15.594	1
15.683	1
16.438	1
17.032	1
17.696	1
17.745	1
19.394	1
20.148	1
20.108	1
18.584	1
18.441	1
18.391	1
19.178	1
18.079	1
18.483	1
19.644	1


Summary of computational transaction
Raw Inputview raw input (R code)
Raw Outputview raw output of R engine
Computing time3 seconds
R Server'Gwilym Jenkins' @ 72.249.127.135

\begin{tabular}{lllllllll}
\hline
Summary of computational transaction \tabularnewline
Raw Input & view raw input (R code)  \tabularnewline
Raw Output & view raw output of R engine  \tabularnewline
Computing time & 3 seconds \tabularnewline
R Server & 'Gwilym Jenkins' @ 72.249.127.135 \tabularnewline
\hline
\end{tabular}
%Source: https://freestatistics.org/blog/index.php?pk=25802&T=0

[TABLE]
[ROW][C]Summary of computational transaction[/C][/ROW]
[ROW][C]Raw Input[/C][C]view raw input (R code) [/C][/ROW]
[ROW][C]Raw Output[/C][C]view raw output of R engine [/C][/ROW]
[ROW][C]Computing time[/C][C]3 seconds[/C][/ROW]
[ROW][C]R Server[/C][C]'Gwilym Jenkins' @ 72.249.127.135[/C][/ROW]
[/TABLE]
Source: https://freestatistics.org/blog/index.php?pk=25802&T=0

Globally Unique Identifier (entire table): ba.freestatistics.org/blog/index.php?pk=25802&T=0

As an alternative you can also use a QR Code:  

The GUIDs for individual cells are displayed in the table below:

Summary of computational transaction
Raw Inputview raw input (R code)
Raw Outputview raw output of R engine
Computing time3 seconds
R Server'Gwilym Jenkins' @ 72.249.127.135


Multiple Linear Regression - Estimated Regression Equation
goudprijs[t] = + 10.1468993250844 + 5.86390157480315dummy[t] + 0.234762584364457M1[t] + 0.525762584364453M2[t] + 0.447637584364454M3[t] + 0.445762584364456M4[t] + 0.564387584364456M5[t] + 0.384137584364454M6[t] -0.242475112485938M7[t] -0.339975112485939M8[t] -0.0813501124859381M9[t] + 0.152774887514062M10[t] -0.0574285714285704M11[t] + e[t]

\begin{tabular}{lllllllll}
\hline
Multiple Linear Regression - Estimated Regression Equation \tabularnewline
goudprijs[t] =  +  10.1468993250844 +  5.86390157480315dummy[t] +  0.234762584364457M1[t] +  0.525762584364453M2[t] +  0.447637584364454M3[t] +  0.445762584364456M4[t] +  0.564387584364456M5[t] +  0.384137584364454M6[t] -0.242475112485938M7[t] -0.339975112485939M8[t] -0.0813501124859381M9[t] +  0.152774887514062M10[t] -0.0574285714285704M11[t]  + e[t] \tabularnewline
\hline
\end{tabular}
%Source: https://freestatistics.org/blog/index.php?pk=25802&T=1

[TABLE]
[ROW][C]Multiple Linear Regression - Estimated Regression Equation[/C][/ROW]
[ROW][C]goudprijs[t] =  +  10.1468993250844 +  5.86390157480315dummy[t] +  0.234762584364457M1[t] +  0.525762584364453M2[t] +  0.447637584364454M3[t] +  0.445762584364456M4[t] +  0.564387584364456M5[t] +  0.384137584364454M6[t] -0.242475112485938M7[t] -0.339975112485939M8[t] -0.0813501124859381M9[t] +  0.152774887514062M10[t] -0.0574285714285704M11[t]  + e[t][/C][/ROW]
[/TABLE]
Source: https://freestatistics.org/blog/index.php?pk=25802&T=1

Globally Unique Identifier (entire table): ba.freestatistics.org/blog/index.php?pk=25802&T=1

As an alternative you can also use a QR Code:  

The GUIDs for individual cells are displayed in the table below:

Multiple Linear Regression - Estimated Regression Equation
goudprijs[t] = + 10.1468993250844 + 5.86390157480315dummy[t] + 0.234762584364457M1[t] + 0.525762584364453M2[t] + 0.447637584364454M3[t] + 0.445762584364456M4[t] + 0.564387584364456M5[t] + 0.384137584364454M6[t] -0.242475112485938M7[t] -0.339975112485939M8[t] -0.0813501124859381M9[t] + 0.152774887514062M10[t] -0.0574285714285704M11[t] + e[t]


Multiple Linear Regression - Ordinary Least Squares
VariableParameterS.D.T-STATH0: parameter = 02-tail p-value1-tail p-value
(Intercept)10.14689932508440.61247516.56700
dummy5.863901574803150.33102117.714600
M10.2347625843644570.816050.28770.7743250.387163
M20.5257625843644530.816050.64430.5212160.260608
M30.4476375843644540.816050.54850.5848290.292414
M40.4457625843644560.816050.54620.58640.2932
M50.5643875843644560.816050.69160.4911610.24558
M60.3841375843644540.816050.47070.63910.31955
M7-0.2424751124859380.8162-0.29710.7671670.383584
M8-0.3399751124859390.8162-0.41650.6781210.339061
M9-0.08135011248593810.8162-0.09970.9208530.460427
M100.1527748875140620.81620.18720.8519890.425994
M11-0.05742857142857040.842614-0.06820.945830.472915

\begin{tabular}{lllllllll}
\hline
Multiple Linear Regression - Ordinary Least Squares \tabularnewline
Variable & Parameter & S.D. & T-STATH0: parameter = 0 & 2-tail p-value & 1-tail p-value \tabularnewline
(Intercept) & 10.1468993250844 & 0.612475 & 16.567 & 0 & 0 \tabularnewline
dummy & 5.86390157480315 & 0.331021 & 17.7146 & 0 & 0 \tabularnewline
M1 & 0.234762584364457 & 0.81605 & 0.2877 & 0.774325 & 0.387163 \tabularnewline
M2 & 0.525762584364453 & 0.81605 & 0.6443 & 0.521216 & 0.260608 \tabularnewline
M3 & 0.447637584364454 & 0.81605 & 0.5485 & 0.584829 & 0.292414 \tabularnewline
M4 & 0.445762584364456 & 0.81605 & 0.5462 & 0.5864 & 0.2932 \tabularnewline
M5 & 0.564387584364456 & 0.81605 & 0.6916 & 0.491161 & 0.24558 \tabularnewline
M6 & 0.384137584364454 & 0.81605 & 0.4707 & 0.6391 & 0.31955 \tabularnewline
M7 & -0.242475112485938 & 0.8162 & -0.2971 & 0.767167 & 0.383584 \tabularnewline
M8 & -0.339975112485939 & 0.8162 & -0.4165 & 0.678121 & 0.339061 \tabularnewline
M9 & -0.0813501124859381 & 0.8162 & -0.0997 & 0.920853 & 0.460427 \tabularnewline
M10 & 0.152774887514062 & 0.8162 & 0.1872 & 0.851989 & 0.425994 \tabularnewline
M11 & -0.0574285714285704 & 0.842614 & -0.0682 & 0.94583 & 0.472915 \tabularnewline
\hline
\end{tabular}
%Source: https://freestatistics.org/blog/index.php?pk=25802&T=2

[TABLE]
[ROW][C]Multiple Linear Regression - Ordinary Least Squares[/C][/ROW]
[ROW][C]Variable[/C][C]Parameter[/C][C]S.D.[/C][C]T-STATH0: parameter = 0[/C][C]2-tail p-value[/C][C]1-tail p-value[/C][/ROW]
[ROW][C](Intercept)[/C][C]10.1468993250844[/C][C]0.612475[/C][C]16.567[/C][C]0[/C][C]0[/C][/ROW]
[ROW][C]dummy[/C][C]5.86390157480315[/C][C]0.331021[/C][C]17.7146[/C][C]0[/C][C]0[/C][/ROW]
[ROW][C]M1[/C][C]0.234762584364457[/C][C]0.81605[/C][C]0.2877[/C][C]0.774325[/C][C]0.387163[/C][/ROW]
[ROW][C]M2[/C][C]0.525762584364453[/C][C]0.81605[/C][C]0.6443[/C][C]0.521216[/C][C]0.260608[/C][/ROW]
[ROW][C]M3[/C][C]0.447637584364454[/C][C]0.81605[/C][C]0.5485[/C][C]0.584829[/C][C]0.292414[/C][/ROW]
[ROW][C]M4[/C][C]0.445762584364456[/C][C]0.81605[/C][C]0.5462[/C][C]0.5864[/C][C]0.2932[/C][/ROW]
[ROW][C]M5[/C][C]0.564387584364456[/C][C]0.81605[/C][C]0.6916[/C][C]0.491161[/C][C]0.24558[/C][/ROW]
[ROW][C]M6[/C][C]0.384137584364454[/C][C]0.81605[/C][C]0.4707[/C][C]0.6391[/C][C]0.31955[/C][/ROW]
[ROW][C]M7[/C][C]-0.242475112485938[/C][C]0.8162[/C][C]-0.2971[/C][C]0.767167[/C][C]0.383584[/C][/ROW]
[ROW][C]M8[/C][C]-0.339975112485939[/C][C]0.8162[/C][C]-0.4165[/C][C]0.678121[/C][C]0.339061[/C][/ROW]
[ROW][C]M9[/C][C]-0.0813501124859381[/C][C]0.8162[/C][C]-0.0997[/C][C]0.920853[/C][C]0.460427[/C][/ROW]
[ROW][C]M10[/C][C]0.152774887514062[/C][C]0.8162[/C][C]0.1872[/C][C]0.851989[/C][C]0.425994[/C][/ROW]
[ROW][C]M11[/C][C]-0.0574285714285704[/C][C]0.842614[/C][C]-0.0682[/C][C]0.94583[/C][C]0.472915[/C][/ROW]
[/TABLE]
Source: https://freestatistics.org/blog/index.php?pk=25802&T=2

Globally Unique Identifier (entire table): ba.freestatistics.org/blog/index.php?pk=25802&T=2

As an alternative you can also use a QR Code:  

The GUIDs for individual cells are displayed in the table below:

Multiple Linear Regression - Ordinary Least Squares
VariableParameterS.D.T-STATH0: parameter = 02-tail p-value1-tail p-value
(Intercept)10.14689932508440.61247516.56700
dummy5.863901574803150.33102117.714600
M10.2347625843644570.816050.28770.7743250.387163
M20.5257625843644530.816050.64430.5212160.260608
M30.4476375843644540.816050.54850.5848290.292414
M40.4457625843644560.816050.54620.58640.2932
M50.5643875843644560.816050.69160.4911610.24558
M60.3841375843644540.816050.47070.63910.31955
M7-0.2424751124859380.8162-0.29710.7671670.383584
M8-0.3399751124859390.8162-0.41650.6781210.339061
M9-0.08135011248593810.8162-0.09970.9208530.460427
M100.1527748875140620.81620.18720.8519890.425994
M11-0.05742857142857040.842614-0.06820.945830.472915


Multiple Linear Regression - Regression Statistics
Multiple R0.891862712448084
R-squared0.795419097855254
Adjusted R-squared0.765110816056032
F-TEST (value)26.2442821115541
F-TEST (DF numerator)12
F-TEST (DF denominator)81
p-value0
Multiple Linear Regression - Residual Statistics
Residual Standard Deviation1.57638681292758
Sum Squared Residuals201.284626101729

\begin{tabular}{lllllllll}
\hline
Multiple Linear Regression - Regression Statistics \tabularnewline
Multiple R & 0.891862712448084 \tabularnewline
R-squared & 0.795419097855254 \tabularnewline
Adjusted R-squared & 0.765110816056032 \tabularnewline
F-TEST (value) & 26.2442821115541 \tabularnewline
F-TEST (DF numerator) & 12 \tabularnewline
F-TEST (DF denominator) & 81 \tabularnewline
p-value & 0 \tabularnewline
Multiple Linear Regression - Residual Statistics \tabularnewline
Residual Standard Deviation & 1.57638681292758 \tabularnewline
Sum Squared Residuals & 201.284626101729 \tabularnewline
\hline
\end{tabular}
%Source: https://freestatistics.org/blog/index.php?pk=25802&T=3

[TABLE]
[ROW][C]Multiple Linear Regression - Regression Statistics[/C][/ROW]
[ROW][C]Multiple R[/C][C]0.891862712448084[/C][/ROW]
[ROW][C]R-squared[/C][C]0.795419097855254[/C][/ROW]
[ROW][C]Adjusted R-squared[/C][C]0.765110816056032[/C][/ROW]
[ROW][C]F-TEST (value)[/C][C]26.2442821115541[/C][/ROW]
[ROW][C]F-TEST (DF numerator)[/C][C]12[/C][/ROW]
[ROW][C]F-TEST (DF denominator)[/C][C]81[/C][/ROW]
[ROW][C]p-value[/C][C]0[/C][/ROW]
[ROW][C]Multiple Linear Regression - Residual Statistics[/C][/ROW]
[ROW][C]Residual Standard Deviation[/C][C]1.57638681292758[/C][/ROW]
[ROW][C]Sum Squared Residuals[/C][C]201.284626101729[/C][/ROW]
[/TABLE]
Source: https://freestatistics.org/blog/index.php?pk=25802&T=3

Globally Unique Identifier (entire table): ba.freestatistics.org/blog/index.php?pk=25802&T=3

As an alternative you can also use a QR Code:  

The GUIDs for individual cells are displayed in the table below:

Multiple Linear Regression - Regression Statistics
Multiple R0.891862712448084
R-squared0.795419097855254
Adjusted R-squared0.765110816056032
F-TEST (value)26.2442821115541
F-TEST (DF numerator)12
F-TEST (DF denominator)81
p-value0
Multiple Linear Regression - Residual Statistics
Residual Standard Deviation1.57638681292758
Sum Squared Residuals201.284626101729


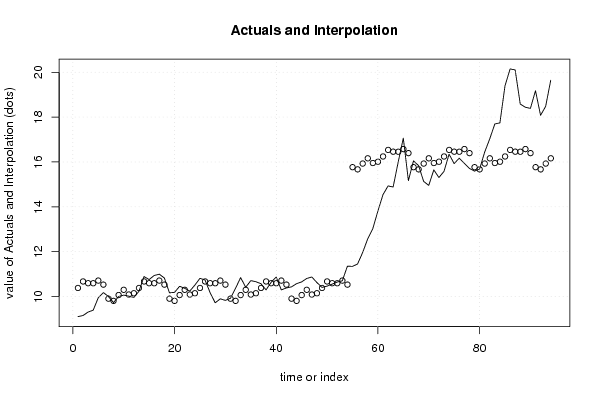
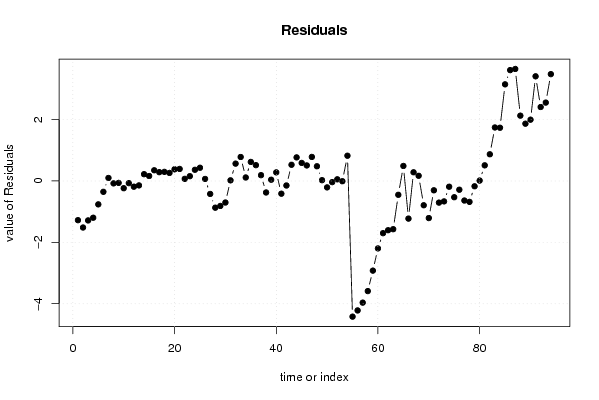
Multiple Linear Regression - Actuals, Interpolation, and Residuals
Time or IndexActualsInterpolationForecastResidualsPrediction Error
19.10310.3816619094488-1.2786619094488
29.15510.6726619094488-1.51766190944883
39.30810.5945369094488-1.28653690944882
49.39410.5926619094488-1.19866190944882
59.94810.7112869094488-0.763286909448815
610.17710.5310369094488-0.35403690944882
710.0029.904424212598430.0975757874015746
89.7289.80692421259842-0.0789242125984247
910.00210.0655492125984-0.0635492125984253
1010.06310.2996742125984-0.236674212598424
1110.01810.0894707536558-0.0714707536557929
129.9610.1468993250844-0.186899325084363
1310.23610.3816619094488-0.145661909448821
1410.89310.67266190944880.220338090551183
1510.75610.59453690944880.161463090551181
1610.9410.59266190944880.347338090551180
1710.99710.71128690944880.28571309055118
1810.82710.53103690944880.295963090551182
1910.1669.904424212598420.261575787401575
2010.1869.806924212598430.379075787401574
2110.45710.06554921259840.391450787401575
2210.36810.29967421259840.0683257874015747
2310.24410.08947075365580.154529246344206
2410.51110.14689932508440.364100674915635
2510.81210.38166190944880.430338090551178
2610.73810.67266190944880.0653380905511822
2710.17110.5945369094488-0.42353690944882
289.72110.5926619094488-0.87166190944882
299.89710.7112869094488-0.814286909448819
309.82810.5310369094488-0.703036909448819
319.9249.904424212598420.0195757874015741
3210.3719.806924212598430.564075787401575
3310.84610.06554921259840.780450787401574
3410.41310.29967421259840.113325787401575
3510.70910.08947075365580.619529246344206
3610.66210.14689932508440.515100674915637
3710.5710.38166190944880.188338090551179
3810.29710.6726619094488-0.375661909448817
3910.63510.59453690944880.0404630905511802
4010.87210.59266190944880.279338090551181
4110.29610.7112869094488-0.41528690944882
4210.38310.5310369094488-0.148036909448819
4310.4319.904424212598420.526575787401574
4410.5749.806924212598430.767075787401574
4510.65310.06554921259840.587450787401575
4610.80510.29967421259840.505325787401574
4710.87210.08947075365580.782529246344207
4810.62510.14689932508440.478100674915636
4910.40710.38166190944880.0253380905511783
5010.46310.6726619094488-0.209661909448818
5110.55610.5945369094488-0.0385369094488205
5210.64610.59266190944880.0533380905511817
5310.70210.7112869094488-0.0092869094488195
5411.35310.53103690944880.821963090551182
5511.34615.7683257874016-4.42232578740158
5611.45115.6708257874016-4.21982578740158
5711.96415.9294507874016-3.96545078740158
5812.57416.1635757874016-3.58957578740157
5913.03115.9533723284589-2.92237232845894
6013.81216.0108008998875-2.19880089988751
6114.54416.2455634842520-1.70156348425197
6214.93116.5365634842520-1.60556348425197
6314.88616.4584384842520-1.57243848425197
6416.00516.4565634842520-0.451563484251969
6517.06416.57518848425200.488811515748031
6615.16816.3949384842520-1.22693848425197
6716.0515.76832578740160.281674212598426
6815.83915.67082578740160.168174212598426
6915.13715.9294507874016-0.792450787401574
7014.95416.1635757874016-1.20957578740157
7115.64815.9533723284589-0.305372328458943
7215.30516.0108008998875-0.705800899887513
7315.57916.2455634842520-0.66656348425197
7416.34816.5365634842520-0.188563484251967
7515.92816.4584384842520-0.530438484251968
7616.17116.4565634842520-0.285563484251968
7715.93716.5751884842520-0.63818848425197
7815.71316.3949384842520-0.681938484251968
7915.59415.7683257874016-0.174325787401575
8015.68315.67082578740160.0121742125984253
8116.43815.92945078740160.508549212598424
8217.03216.16357578740160.868424212598426
8317.69615.95337232845891.74262767154106
8417.74516.01080089988751.73419910011249
8519.39416.24556348425203.14843651574803
8620.14816.53656348425203.61143651574803
8720.10816.45843848425203.64956151574803
8818.58416.45656348425202.12743651574803
8918.44116.57518848425201.86581151574803
9018.39116.39493848425201.99606151574803
9119.17815.76832578740163.40967421259843
9218.07915.67082578740162.40817421259843
9318.48315.92945078740162.55354921259843
9419.64416.16357578740163.48042421259842

\begin{tabular}{lllllllll}
\hline
Multiple Linear Regression - Actuals, Interpolation, and Residuals \tabularnewline
Time or Index & Actuals & InterpolationForecast & ResidualsPrediction Error \tabularnewline
1 & 9.103 & 10.3816619094488 & -1.2786619094488 \tabularnewline
2 & 9.155 & 10.6726619094488 & -1.51766190944883 \tabularnewline
3 & 9.308 & 10.5945369094488 & -1.28653690944882 \tabularnewline
4 & 9.394 & 10.5926619094488 & -1.19866190944882 \tabularnewline
5 & 9.948 & 10.7112869094488 & -0.763286909448815 \tabularnewline
6 & 10.177 & 10.5310369094488 & -0.35403690944882 \tabularnewline
7 & 10.002 & 9.90442421259843 & 0.0975757874015746 \tabularnewline
8 & 9.728 & 9.80692421259842 & -0.0789242125984247 \tabularnewline
9 & 10.002 & 10.0655492125984 & -0.0635492125984253 \tabularnewline
10 & 10.063 & 10.2996742125984 & -0.236674212598424 \tabularnewline
11 & 10.018 & 10.0894707536558 & -0.0714707536557929 \tabularnewline
12 & 9.96 & 10.1468993250844 & -0.186899325084363 \tabularnewline
13 & 10.236 & 10.3816619094488 & -0.145661909448821 \tabularnewline
14 & 10.893 & 10.6726619094488 & 0.220338090551183 \tabularnewline
15 & 10.756 & 10.5945369094488 & 0.161463090551181 \tabularnewline
16 & 10.94 & 10.5926619094488 & 0.347338090551180 \tabularnewline
17 & 10.997 & 10.7112869094488 & 0.28571309055118 \tabularnewline
18 & 10.827 & 10.5310369094488 & 0.295963090551182 \tabularnewline
19 & 10.166 & 9.90442421259842 & 0.261575787401575 \tabularnewline
20 & 10.186 & 9.80692421259843 & 0.379075787401574 \tabularnewline
21 & 10.457 & 10.0655492125984 & 0.391450787401575 \tabularnewline
22 & 10.368 & 10.2996742125984 & 0.0683257874015747 \tabularnewline
23 & 10.244 & 10.0894707536558 & 0.154529246344206 \tabularnewline
24 & 10.511 & 10.1468993250844 & 0.364100674915635 \tabularnewline
25 & 10.812 & 10.3816619094488 & 0.430338090551178 \tabularnewline
26 & 10.738 & 10.6726619094488 & 0.0653380905511822 \tabularnewline
27 & 10.171 & 10.5945369094488 & -0.42353690944882 \tabularnewline
28 & 9.721 & 10.5926619094488 & -0.87166190944882 \tabularnewline
29 & 9.897 & 10.7112869094488 & -0.814286909448819 \tabularnewline
30 & 9.828 & 10.5310369094488 & -0.703036909448819 \tabularnewline
31 & 9.924 & 9.90442421259842 & 0.0195757874015741 \tabularnewline
32 & 10.371 & 9.80692421259843 & 0.564075787401575 \tabularnewline
33 & 10.846 & 10.0655492125984 & 0.780450787401574 \tabularnewline
34 & 10.413 & 10.2996742125984 & 0.113325787401575 \tabularnewline
35 & 10.709 & 10.0894707536558 & 0.619529246344206 \tabularnewline
36 & 10.662 & 10.1468993250844 & 0.515100674915637 \tabularnewline
37 & 10.57 & 10.3816619094488 & 0.188338090551179 \tabularnewline
38 & 10.297 & 10.6726619094488 & -0.375661909448817 \tabularnewline
39 & 10.635 & 10.5945369094488 & 0.0404630905511802 \tabularnewline
40 & 10.872 & 10.5926619094488 & 0.279338090551181 \tabularnewline
41 & 10.296 & 10.7112869094488 & -0.41528690944882 \tabularnewline
42 & 10.383 & 10.5310369094488 & -0.148036909448819 \tabularnewline
43 & 10.431 & 9.90442421259842 & 0.526575787401574 \tabularnewline
44 & 10.574 & 9.80692421259843 & 0.767075787401574 \tabularnewline
45 & 10.653 & 10.0655492125984 & 0.587450787401575 \tabularnewline
46 & 10.805 & 10.2996742125984 & 0.505325787401574 \tabularnewline
47 & 10.872 & 10.0894707536558 & 0.782529246344207 \tabularnewline
48 & 10.625 & 10.1468993250844 & 0.478100674915636 \tabularnewline
49 & 10.407 & 10.3816619094488 & 0.0253380905511783 \tabularnewline
50 & 10.463 & 10.6726619094488 & -0.209661909448818 \tabularnewline
51 & 10.556 & 10.5945369094488 & -0.0385369094488205 \tabularnewline
52 & 10.646 & 10.5926619094488 & 0.0533380905511817 \tabularnewline
53 & 10.702 & 10.7112869094488 & -0.0092869094488195 \tabularnewline
54 & 11.353 & 10.5310369094488 & 0.821963090551182 \tabularnewline
55 & 11.346 & 15.7683257874016 & -4.42232578740158 \tabularnewline
56 & 11.451 & 15.6708257874016 & -4.21982578740158 \tabularnewline
57 & 11.964 & 15.9294507874016 & -3.96545078740158 \tabularnewline
58 & 12.574 & 16.1635757874016 & -3.58957578740157 \tabularnewline
59 & 13.031 & 15.9533723284589 & -2.92237232845894 \tabularnewline
60 & 13.812 & 16.0108008998875 & -2.19880089988751 \tabularnewline
61 & 14.544 & 16.2455634842520 & -1.70156348425197 \tabularnewline
62 & 14.931 & 16.5365634842520 & -1.60556348425197 \tabularnewline
63 & 14.886 & 16.4584384842520 & -1.57243848425197 \tabularnewline
64 & 16.005 & 16.4565634842520 & -0.451563484251969 \tabularnewline
65 & 17.064 & 16.5751884842520 & 0.488811515748031 \tabularnewline
66 & 15.168 & 16.3949384842520 & -1.22693848425197 \tabularnewline
67 & 16.05 & 15.7683257874016 & 0.281674212598426 \tabularnewline
68 & 15.839 & 15.6708257874016 & 0.168174212598426 \tabularnewline
69 & 15.137 & 15.9294507874016 & -0.792450787401574 \tabularnewline
70 & 14.954 & 16.1635757874016 & -1.20957578740157 \tabularnewline
71 & 15.648 & 15.9533723284589 & -0.305372328458943 \tabularnewline
72 & 15.305 & 16.0108008998875 & -0.705800899887513 \tabularnewline
73 & 15.579 & 16.2455634842520 & -0.66656348425197 \tabularnewline
74 & 16.348 & 16.5365634842520 & -0.188563484251967 \tabularnewline
75 & 15.928 & 16.4584384842520 & -0.530438484251968 \tabularnewline
76 & 16.171 & 16.4565634842520 & -0.285563484251968 \tabularnewline
77 & 15.937 & 16.5751884842520 & -0.63818848425197 \tabularnewline
78 & 15.713 & 16.3949384842520 & -0.681938484251968 \tabularnewline
79 & 15.594 & 15.7683257874016 & -0.174325787401575 \tabularnewline
80 & 15.683 & 15.6708257874016 & 0.0121742125984253 \tabularnewline
81 & 16.438 & 15.9294507874016 & 0.508549212598424 \tabularnewline
82 & 17.032 & 16.1635757874016 & 0.868424212598426 \tabularnewline
83 & 17.696 & 15.9533723284589 & 1.74262767154106 \tabularnewline
84 & 17.745 & 16.0108008998875 & 1.73419910011249 \tabularnewline
85 & 19.394 & 16.2455634842520 & 3.14843651574803 \tabularnewline
86 & 20.148 & 16.5365634842520 & 3.61143651574803 \tabularnewline
87 & 20.108 & 16.4584384842520 & 3.64956151574803 \tabularnewline
88 & 18.584 & 16.4565634842520 & 2.12743651574803 \tabularnewline
89 & 18.441 & 16.5751884842520 & 1.86581151574803 \tabularnewline
90 & 18.391 & 16.3949384842520 & 1.99606151574803 \tabularnewline
91 & 19.178 & 15.7683257874016 & 3.40967421259843 \tabularnewline
92 & 18.079 & 15.6708257874016 & 2.40817421259843 \tabularnewline
93 & 18.483 & 15.9294507874016 & 2.55354921259843 \tabularnewline
94 & 19.644 & 16.1635757874016 & 3.48042421259842 \tabularnewline
\hline
\end{tabular}
%Source: https://freestatistics.org/blog/index.php?pk=25802&T=4

[TABLE]
[ROW][C]Multiple Linear Regression - Actuals, Interpolation, and Residuals[/C][/ROW]
[ROW][C]Time or Index[/C][C]Actuals[/C][C]InterpolationForecast[/C][C]ResidualsPrediction Error[/C][/ROW]
[ROW][C]1[/C][C]9.103[/C][C]10.3816619094488[/C][C]-1.2786619094488[/C][/ROW]
[ROW][C]2[/C][C]9.155[/C][C]10.6726619094488[/C][C]-1.51766190944883[/C][/ROW]
[ROW][C]3[/C][C]9.308[/C][C]10.5945369094488[/C][C]-1.28653690944882[/C][/ROW]
[ROW][C]4[/C][C]9.394[/C][C]10.5926619094488[/C][C]-1.19866190944882[/C][/ROW]
[ROW][C]5[/C][C]9.948[/C][C]10.7112869094488[/C][C]-0.763286909448815[/C][/ROW]
[ROW][C]6[/C][C]10.177[/C][C]10.5310369094488[/C][C]-0.35403690944882[/C][/ROW]
[ROW][C]7[/C][C]10.002[/C][C]9.90442421259843[/C][C]0.0975757874015746[/C][/ROW]
[ROW][C]8[/C][C]9.728[/C][C]9.80692421259842[/C][C]-0.0789242125984247[/C][/ROW]
[ROW][C]9[/C][C]10.002[/C][C]10.0655492125984[/C][C]-0.0635492125984253[/C][/ROW]
[ROW][C]10[/C][C]10.063[/C][C]10.2996742125984[/C][C]-0.236674212598424[/C][/ROW]
[ROW][C]11[/C][C]10.018[/C][C]10.0894707536558[/C][C]-0.0714707536557929[/C][/ROW]
[ROW][C]12[/C][C]9.96[/C][C]10.1468993250844[/C][C]-0.186899325084363[/C][/ROW]
[ROW][C]13[/C][C]10.236[/C][C]10.3816619094488[/C][C]-0.145661909448821[/C][/ROW]
[ROW][C]14[/C][C]10.893[/C][C]10.6726619094488[/C][C]0.220338090551183[/C][/ROW]
[ROW][C]15[/C][C]10.756[/C][C]10.5945369094488[/C][C]0.161463090551181[/C][/ROW]
[ROW][C]16[/C][C]10.94[/C][C]10.5926619094488[/C][C]0.347338090551180[/C][/ROW]
[ROW][C]17[/C][C]10.997[/C][C]10.7112869094488[/C][C]0.28571309055118[/C][/ROW]
[ROW][C]18[/C][C]10.827[/C][C]10.5310369094488[/C][C]0.295963090551182[/C][/ROW]
[ROW][C]19[/C][C]10.166[/C][C]9.90442421259842[/C][C]0.261575787401575[/C][/ROW]
[ROW][C]20[/C][C]10.186[/C][C]9.80692421259843[/C][C]0.379075787401574[/C][/ROW]
[ROW][C]21[/C][C]10.457[/C][C]10.0655492125984[/C][C]0.391450787401575[/C][/ROW]
[ROW][C]22[/C][C]10.368[/C][C]10.2996742125984[/C][C]0.0683257874015747[/C][/ROW]
[ROW][C]23[/C][C]10.244[/C][C]10.0894707536558[/C][C]0.154529246344206[/C][/ROW]
[ROW][C]24[/C][C]10.511[/C][C]10.1468993250844[/C][C]0.364100674915635[/C][/ROW]
[ROW][C]25[/C][C]10.812[/C][C]10.3816619094488[/C][C]0.430338090551178[/C][/ROW]
[ROW][C]26[/C][C]10.738[/C][C]10.6726619094488[/C][C]0.0653380905511822[/C][/ROW]
[ROW][C]27[/C][C]10.171[/C][C]10.5945369094488[/C][C]-0.42353690944882[/C][/ROW]
[ROW][C]28[/C][C]9.721[/C][C]10.5926619094488[/C][C]-0.87166190944882[/C][/ROW]
[ROW][C]29[/C][C]9.897[/C][C]10.7112869094488[/C][C]-0.814286909448819[/C][/ROW]
[ROW][C]30[/C][C]9.828[/C][C]10.5310369094488[/C][C]-0.703036909448819[/C][/ROW]
[ROW][C]31[/C][C]9.924[/C][C]9.90442421259842[/C][C]0.0195757874015741[/C][/ROW]
[ROW][C]32[/C][C]10.371[/C][C]9.80692421259843[/C][C]0.564075787401575[/C][/ROW]
[ROW][C]33[/C][C]10.846[/C][C]10.0655492125984[/C][C]0.780450787401574[/C][/ROW]
[ROW][C]34[/C][C]10.413[/C][C]10.2996742125984[/C][C]0.113325787401575[/C][/ROW]
[ROW][C]35[/C][C]10.709[/C][C]10.0894707536558[/C][C]0.619529246344206[/C][/ROW]
[ROW][C]36[/C][C]10.662[/C][C]10.1468993250844[/C][C]0.515100674915637[/C][/ROW]
[ROW][C]37[/C][C]10.57[/C][C]10.3816619094488[/C][C]0.188338090551179[/C][/ROW]
[ROW][C]38[/C][C]10.297[/C][C]10.6726619094488[/C][C]-0.375661909448817[/C][/ROW]
[ROW][C]39[/C][C]10.635[/C][C]10.5945369094488[/C][C]0.0404630905511802[/C][/ROW]
[ROW][C]40[/C][C]10.872[/C][C]10.5926619094488[/C][C]0.279338090551181[/C][/ROW]
[ROW][C]41[/C][C]10.296[/C][C]10.7112869094488[/C][C]-0.41528690944882[/C][/ROW]
[ROW][C]42[/C][C]10.383[/C][C]10.5310369094488[/C][C]-0.148036909448819[/C][/ROW]
[ROW][C]43[/C][C]10.431[/C][C]9.90442421259842[/C][C]0.526575787401574[/C][/ROW]
[ROW][C]44[/C][C]10.574[/C][C]9.80692421259843[/C][C]0.767075787401574[/C][/ROW]
[ROW][C]45[/C][C]10.653[/C][C]10.0655492125984[/C][C]0.587450787401575[/C][/ROW]
[ROW][C]46[/C][C]10.805[/C][C]10.2996742125984[/C][C]0.505325787401574[/C][/ROW]
[ROW][C]47[/C][C]10.872[/C][C]10.0894707536558[/C][C]0.782529246344207[/C][/ROW]
[ROW][C]48[/C][C]10.625[/C][C]10.1468993250844[/C][C]0.478100674915636[/C][/ROW]
[ROW][C]49[/C][C]10.407[/C][C]10.3816619094488[/C][C]0.0253380905511783[/C][/ROW]
[ROW][C]50[/C][C]10.463[/C][C]10.6726619094488[/C][C]-0.209661909448818[/C][/ROW]
[ROW][C]51[/C][C]10.556[/C][C]10.5945369094488[/C][C]-0.0385369094488205[/C][/ROW]
[ROW][C]52[/C][C]10.646[/C][C]10.5926619094488[/C][C]0.0533380905511817[/C][/ROW]
[ROW][C]53[/C][C]10.702[/C][C]10.7112869094488[/C][C]-0.0092869094488195[/C][/ROW]
[ROW][C]54[/C][C]11.353[/C][C]10.5310369094488[/C][C]0.821963090551182[/C][/ROW]
[ROW][C]55[/C][C]11.346[/C][C]15.7683257874016[/C][C]-4.42232578740158[/C][/ROW]
[ROW][C]56[/C][C]11.451[/C][C]15.6708257874016[/C][C]-4.21982578740158[/C][/ROW]
[ROW][C]57[/C][C]11.964[/C][C]15.9294507874016[/C][C]-3.96545078740158[/C][/ROW]
[ROW][C]58[/C][C]12.574[/C][C]16.1635757874016[/C][C]-3.58957578740157[/C][/ROW]
[ROW][C]59[/C][C]13.031[/C][C]15.9533723284589[/C][C]-2.92237232845894[/C][/ROW]
[ROW][C]60[/C][C]13.812[/C][C]16.0108008998875[/C][C]-2.19880089988751[/C][/ROW]
[ROW][C]61[/C][C]14.544[/C][C]16.2455634842520[/C][C]-1.70156348425197[/C][/ROW]
[ROW][C]62[/C][C]14.931[/C][C]16.5365634842520[/C][C]-1.60556348425197[/C][/ROW]
[ROW][C]63[/C][C]14.886[/C][C]16.4584384842520[/C][C]-1.57243848425197[/C][/ROW]
[ROW][C]64[/C][C]16.005[/C][C]16.4565634842520[/C][C]-0.451563484251969[/C][/ROW]
[ROW][C]65[/C][C]17.064[/C][C]16.5751884842520[/C][C]0.488811515748031[/C][/ROW]
[ROW][C]66[/C][C]15.168[/C][C]16.3949384842520[/C][C]-1.22693848425197[/C][/ROW]
[ROW][C]67[/C][C]16.05[/C][C]15.7683257874016[/C][C]0.281674212598426[/C][/ROW]
[ROW][C]68[/C][C]15.839[/C][C]15.6708257874016[/C][C]0.168174212598426[/C][/ROW]
[ROW][C]69[/C][C]15.137[/C][C]15.9294507874016[/C][C]-0.792450787401574[/C][/ROW]
[ROW][C]70[/C][C]14.954[/C][C]16.1635757874016[/C][C]-1.20957578740157[/C][/ROW]
[ROW][C]71[/C][C]15.648[/C][C]15.9533723284589[/C][C]-0.305372328458943[/C][/ROW]
[ROW][C]72[/C][C]15.305[/C][C]16.0108008998875[/C][C]-0.705800899887513[/C][/ROW]
[ROW][C]73[/C][C]15.579[/C][C]16.2455634842520[/C][C]-0.66656348425197[/C][/ROW]
[ROW][C]74[/C][C]16.348[/C][C]16.5365634842520[/C][C]-0.188563484251967[/C][/ROW]
[ROW][C]75[/C][C]15.928[/C][C]16.4584384842520[/C][C]-0.530438484251968[/C][/ROW]
[ROW][C]76[/C][C]16.171[/C][C]16.4565634842520[/C][C]-0.285563484251968[/C][/ROW]
[ROW][C]77[/C][C]15.937[/C][C]16.5751884842520[/C][C]-0.63818848425197[/C][/ROW]
[ROW][C]78[/C][C]15.713[/C][C]16.3949384842520[/C][C]-0.681938484251968[/C][/ROW]
[ROW][C]79[/C][C]15.594[/C][C]15.7683257874016[/C][C]-0.174325787401575[/C][/ROW]
[ROW][C]80[/C][C]15.683[/C][C]15.6708257874016[/C][C]0.0121742125984253[/C][/ROW]
[ROW][C]81[/C][C]16.438[/C][C]15.9294507874016[/C][C]0.508549212598424[/C][/ROW]
[ROW][C]82[/C][C]17.032[/C][C]16.1635757874016[/C][C]0.868424212598426[/C][/ROW]
[ROW][C]83[/C][C]17.696[/C][C]15.9533723284589[/C][C]1.74262767154106[/C][/ROW]
[ROW][C]84[/C][C]17.745[/C][C]16.0108008998875[/C][C]1.73419910011249[/C][/ROW]
[ROW][C]85[/C][C]19.394[/C][C]16.2455634842520[/C][C]3.14843651574803[/C][/ROW]
[ROW][C]86[/C][C]20.148[/C][C]16.5365634842520[/C][C]3.61143651574803[/C][/ROW]
[ROW][C]87[/C][C]20.108[/C][C]16.4584384842520[/C][C]3.64956151574803[/C][/ROW]
[ROW][C]88[/C][C]18.584[/C][C]16.4565634842520[/C][C]2.12743651574803[/C][/ROW]
[ROW][C]89[/C][C]18.441[/C][C]16.5751884842520[/C][C]1.86581151574803[/C][/ROW]
[ROW][C]90[/C][C]18.391[/C][C]16.3949384842520[/C][C]1.99606151574803[/C][/ROW]
[ROW][C]91[/C][C]19.178[/C][C]15.7683257874016[/C][C]3.40967421259843[/C][/ROW]
[ROW][C]92[/C][C]18.079[/C][C]15.6708257874016[/C][C]2.40817421259843[/C][/ROW]
[ROW][C]93[/C][C]18.483[/C][C]15.9294507874016[/C][C]2.55354921259843[/C][/ROW]
[ROW][C]94[/C][C]19.644[/C][C]16.1635757874016[/C][C]3.48042421259842[/C][/ROW]
[/TABLE]
Source: https://freestatistics.org/blog/index.php?pk=25802&T=4

Globally Unique Identifier (entire table): ba.freestatistics.org/blog/index.php?pk=25802&T=4

As an alternative you can also use a QR Code:  

The GUIDs for individual cells are displayed in the table below:

Multiple Linear Regression - Actuals, Interpolation, and Residuals
Time or IndexActualsInterpolationForecastResidualsPrediction Error
19.10310.3816619094488-1.2786619094488
29.15510.6726619094488-1.51766190944883
39.30810.5945369094488-1.28653690944882
49.39410.5926619094488-1.19866190944882
59.94810.7112869094488-0.763286909448815
610.17710.5310369094488-0.35403690944882
710.0029.904424212598430.0975757874015746
89.7289.80692421259842-0.0789242125984247
910.00210.0655492125984-0.0635492125984253
1010.06310.2996742125984-0.236674212598424
1110.01810.0894707536558-0.0714707536557929
129.9610.1468993250844-0.186899325084363
1310.23610.3816619094488-0.145661909448821
1410.89310.67266190944880.220338090551183
1510.75610.59453690944880.161463090551181
1610.9410.59266190944880.347338090551180
1710.99710.71128690944880.28571309055118
1810.82710.53103690944880.295963090551182
1910.1669.904424212598420.261575787401575
2010.1869.806924212598430.379075787401574
2110.45710.06554921259840.391450787401575
2210.36810.29967421259840.0683257874015747
2310.24410.08947075365580.154529246344206
2410.51110.14689932508440.364100674915635
2510.81210.38166190944880.430338090551178
2610.73810.67266190944880.0653380905511822
2710.17110.5945369094488-0.42353690944882
289.72110.5926619094488-0.87166190944882
299.89710.7112869094488-0.814286909448819
309.82810.5310369094488-0.703036909448819
319.9249.904424212598420.0195757874015741
3210.3719.806924212598430.564075787401575
3310.84610.06554921259840.780450787401574
3410.41310.29967421259840.113325787401575
3510.70910.08947075365580.619529246344206
3610.66210.14689932508440.515100674915637
3710.5710.38166190944880.188338090551179
3810.29710.6726619094488-0.375661909448817
3910.63510.59453690944880.0404630905511802
4010.87210.59266190944880.279338090551181
4110.29610.7112869094488-0.41528690944882
4210.38310.5310369094488-0.148036909448819
4310.4319.904424212598420.526575787401574
4410.5749.806924212598430.767075787401574
4510.65310.06554921259840.587450787401575
4610.80510.29967421259840.505325787401574
4710.87210.08947075365580.782529246344207
4810.62510.14689932508440.478100674915636
4910.40710.38166190944880.0253380905511783
5010.46310.6726619094488-0.209661909448818
5110.55610.5945369094488-0.0385369094488205
5210.64610.59266190944880.0533380905511817
5310.70210.7112869094488-0.0092869094488195
5411.35310.53103690944880.821963090551182
5511.34615.7683257874016-4.42232578740158
5611.45115.6708257874016-4.21982578740158
5711.96415.9294507874016-3.96545078740158
5812.57416.1635757874016-3.58957578740157
5913.03115.9533723284589-2.92237232845894
6013.81216.0108008998875-2.19880089988751
6114.54416.2455634842520-1.70156348425197
6214.93116.5365634842520-1.60556348425197
6314.88616.4584384842520-1.57243848425197
6416.00516.4565634842520-0.451563484251969
6517.06416.57518848425200.488811515748031
6615.16816.3949384842520-1.22693848425197
6716.0515.76832578740160.281674212598426
6815.83915.67082578740160.168174212598426
6915.13715.9294507874016-0.792450787401574
7014.95416.1635757874016-1.20957578740157
7115.64815.9533723284589-0.305372328458943
7215.30516.0108008998875-0.705800899887513
7315.57916.2455634842520-0.66656348425197
7416.34816.5365634842520-0.188563484251967
7515.92816.4584384842520-0.530438484251968
7616.17116.4565634842520-0.285563484251968
7715.93716.5751884842520-0.63818848425197
7815.71316.3949384842520-0.681938484251968
7915.59415.7683257874016-0.174325787401575
8015.68315.67082578740160.0121742125984253
8116.43815.92945078740160.508549212598424
8217.03216.16357578740160.868424212598426
8317.69615.95337232845891.74262767154106
8417.74516.01080089988751.73419910011249
8519.39416.24556348425203.14843651574803
8620.14816.53656348425203.61143651574803
8720.10816.45843848425203.64956151574803
8818.58416.45656348425202.12743651574803
8918.44116.57518848425201.86581151574803
9018.39116.39493848425201.99606151574803
9119.17815.76832578740163.40967421259843
9218.07915.67082578740162.40817421259843
9318.48315.92945078740162.55354921259843
9419.64416.16357578740163.48042421259842


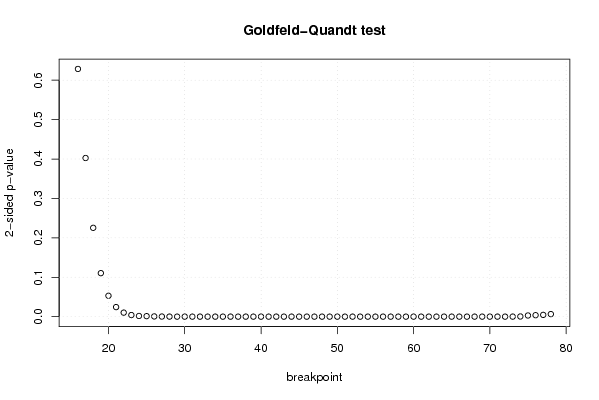
Goldfeld-Quandt test for Heteroskedasticity
p-valuesAlternative Hypothesis
breakpoint indexgreater2-sidedless
160.3143276568133060.6286553136266120.685672343186694
170.2013194102316660.4026388204633330.798680589768334
180.1127091504824570.2254183009649130.887290849517543
190.05518612054601290.1103722410920260.944813879453987
200.02651887441057480.05303774882114960.973481125589425
210.01214997862990290.02429995725980580.987850021370097
220.005120663563648450.01024132712729690.994879336436352
230.002025352955315590.004050705910631180.997974647044684
240.0008523487814054110.001704697562810820.999147651218595
250.0006367814159412560.001273562831882510.99936321858406
260.0003090159813620280.0006180319627240570.999690984018638
270.0001140119316194530.0002280238632389050.99988598806838
284.67560952385985e-059.35121904771969e-050.99995324390476
292.03590224092023e-054.07180448184045e-050.99997964097759
309.38931233570382e-061.87786246714076e-050.999990610687664
313.10307502933647e-066.20615005867295e-060.99999689692497
321.11493462809939e-062.22986925619878e-060.999998885065372
334.66008386582517e-079.32016773165033e-070.999999533991613
341.44308025583295e-072.88616051166590e-070.999999855691974
355.60535005304867e-081.12107001060973e-070.9999999439465
361.89129001450443e-083.78258002900886e-080.9999999810871
376.84600340230841e-091.36920068046168e-080.999999993153997
381.95265987770946e-093.90531975541891e-090.99999999804734
397.20919758186604e-101.44183951637321e-090.99999999927908
403.95309271269926e-107.90618542539852e-100.99999999960469
411.09811182825528e-102.19622365651056e-100.999999999890189
422.89163939591948e-115.78327879183897e-110.999999999971084
438.62036255578048e-121.72407251115610e-110.99999999999138
442.8346291751815e-125.669258350363e-120.999999999997165
457.44509583512648e-131.48901916702530e-120.999999999999255
462.41387364993735e-134.82774729987469e-130.999999999999759
478.70927995227301e-141.74185599045460e-130.999999999999913
482.26835983943272e-144.53671967886544e-140.999999999999977
495.30788669405463e-151.06157733881093e-140.999999999999995
501.21352121072215e-152.42704242144430e-150.999999999999999
512.97582814913398e-165.95165629826796e-161
527.7227371287962e-171.54454742575924e-161
532.09141179857422e-174.18282359714844e-171
541.81884447192535e-173.6376889438507e-171
555.10508866666882e-171.02101773333376e-161
561.33023295492750e-162.66046590985501e-161
573.74520428257021e-167.49040856514042e-161
582.84361456800644e-155.68722913601288e-150.999999999999997
591.14725742282410e-142.29451484564820e-140.999999999999988
601.03024229898989e-132.06048459797978e-130.999999999999897
617.80693527698712e-121.56138705539742e-110.999999999992193
623.42127954605493e-106.84255909210985e-100.999999999657872
634.01580066247472e-098.03160132494944e-090.9999999959842
646.00672386271696e-081.20134477254339e-070.999999939932761
651.20860531602444e-062.41721063204888e-060.999998791394684
661.13061559802609e-062.26123119605219e-060.999998869384402
673.96449802128886e-067.92899604257773e-060.999996035501979
686.03236515514403e-061.20647303102881e-050.999993967634845
696.89319864193642e-061.37863972838728e-050.999993106801358
701.749948622714e-053.499897245428e-050.999982500513773
711.66147242562421e-053.32294485124842e-050.999983385275744
721.54148738241297e-053.08297476482594e-050.999984585126176
734.89413590913824e-059.78827181827647e-050.999951058640909
740.0002212257203787290.0004424514407574580.999778774279621
750.001492578595951020.002985157191902040.99850742140405
760.001852827252099320.003705654504198650.9981471727479
770.002256221727700830.004512443455401650.997743778272299
780.003264542641175690.006529085282351380.996735457358824

\begin{tabular}{lllllllll}
\hline
Goldfeld-Quandt test for Heteroskedasticity \tabularnewline
p-values & Alternative Hypothesis \tabularnewline
breakpoint index & greater & 2-sided & less \tabularnewline
16 & 0.314327656813306 & 0.628655313626612 & 0.685672343186694 \tabularnewline
17 & 0.201319410231666 & 0.402638820463333 & 0.798680589768334 \tabularnewline
18 & 0.112709150482457 & 0.225418300964913 & 0.887290849517543 \tabularnewline
19 & 0.0551861205460129 & 0.110372241092026 & 0.944813879453987 \tabularnewline
20 & 0.0265188744105748 & 0.0530377488211496 & 0.973481125589425 \tabularnewline
21 & 0.0121499786299029 & 0.0242999572598058 & 0.987850021370097 \tabularnewline
22 & 0.00512066356364845 & 0.0102413271272969 & 0.994879336436352 \tabularnewline
23 & 0.00202535295531559 & 0.00405070591063118 & 0.997974647044684 \tabularnewline
24 & 0.000852348781405411 & 0.00170469756281082 & 0.999147651218595 \tabularnewline
25 & 0.000636781415941256 & 0.00127356283188251 & 0.99936321858406 \tabularnewline
26 & 0.000309015981362028 & 0.000618031962724057 & 0.999690984018638 \tabularnewline
27 & 0.000114011931619453 & 0.000228023863238905 & 0.99988598806838 \tabularnewline
28 & 4.67560952385985e-05 & 9.35121904771969e-05 & 0.99995324390476 \tabularnewline
29 & 2.03590224092023e-05 & 4.07180448184045e-05 & 0.99997964097759 \tabularnewline
30 & 9.38931233570382e-06 & 1.87786246714076e-05 & 0.999990610687664 \tabularnewline
31 & 3.10307502933647e-06 & 6.20615005867295e-06 & 0.99999689692497 \tabularnewline
32 & 1.11493462809939e-06 & 2.22986925619878e-06 & 0.999998885065372 \tabularnewline
33 & 4.66008386582517e-07 & 9.32016773165033e-07 & 0.999999533991613 \tabularnewline
34 & 1.44308025583295e-07 & 2.88616051166590e-07 & 0.999999855691974 \tabularnewline
35 & 5.60535005304867e-08 & 1.12107001060973e-07 & 0.9999999439465 \tabularnewline
36 & 1.89129001450443e-08 & 3.78258002900886e-08 & 0.9999999810871 \tabularnewline
37 & 6.84600340230841e-09 & 1.36920068046168e-08 & 0.999999993153997 \tabularnewline
38 & 1.95265987770946e-09 & 3.90531975541891e-09 & 0.99999999804734 \tabularnewline
39 & 7.20919758186604e-10 & 1.44183951637321e-09 & 0.99999999927908 \tabularnewline
40 & 3.95309271269926e-10 & 7.90618542539852e-10 & 0.99999999960469 \tabularnewline
41 & 1.09811182825528e-10 & 2.19622365651056e-10 & 0.999999999890189 \tabularnewline
42 & 2.89163939591948e-11 & 5.78327879183897e-11 & 0.999999999971084 \tabularnewline
43 & 8.62036255578048e-12 & 1.72407251115610e-11 & 0.99999999999138 \tabularnewline
44 & 2.8346291751815e-12 & 5.669258350363e-12 & 0.999999999997165 \tabularnewline
45 & 7.44509583512648e-13 & 1.48901916702530e-12 & 0.999999999999255 \tabularnewline
46 & 2.41387364993735e-13 & 4.82774729987469e-13 & 0.999999999999759 \tabularnewline
47 & 8.70927995227301e-14 & 1.74185599045460e-13 & 0.999999999999913 \tabularnewline
48 & 2.26835983943272e-14 & 4.53671967886544e-14 & 0.999999999999977 \tabularnewline
49 & 5.30788669405463e-15 & 1.06157733881093e-14 & 0.999999999999995 \tabularnewline
50 & 1.21352121072215e-15 & 2.42704242144430e-15 & 0.999999999999999 \tabularnewline
51 & 2.97582814913398e-16 & 5.95165629826796e-16 & 1 \tabularnewline
52 & 7.7227371287962e-17 & 1.54454742575924e-16 & 1 \tabularnewline
53 & 2.09141179857422e-17 & 4.18282359714844e-17 & 1 \tabularnewline
54 & 1.81884447192535e-17 & 3.6376889438507e-17 & 1 \tabularnewline
55 & 5.10508866666882e-17 & 1.02101773333376e-16 & 1 \tabularnewline
56 & 1.33023295492750e-16 & 2.66046590985501e-16 & 1 \tabularnewline
57 & 3.74520428257021e-16 & 7.49040856514042e-16 & 1 \tabularnewline
58 & 2.84361456800644e-15 & 5.68722913601288e-15 & 0.999999999999997 \tabularnewline
59 & 1.14725742282410e-14 & 2.29451484564820e-14 & 0.999999999999988 \tabularnewline
60 & 1.03024229898989e-13 & 2.06048459797978e-13 & 0.999999999999897 \tabularnewline
61 & 7.80693527698712e-12 & 1.56138705539742e-11 & 0.999999999992193 \tabularnewline
62 & 3.42127954605493e-10 & 6.84255909210985e-10 & 0.999999999657872 \tabularnewline
63 & 4.01580066247472e-09 & 8.03160132494944e-09 & 0.9999999959842 \tabularnewline
64 & 6.00672386271696e-08 & 1.20134477254339e-07 & 0.999999939932761 \tabularnewline
65 & 1.20860531602444e-06 & 2.41721063204888e-06 & 0.999998791394684 \tabularnewline
66 & 1.13061559802609e-06 & 2.26123119605219e-06 & 0.999998869384402 \tabularnewline
67 & 3.96449802128886e-06 & 7.92899604257773e-06 & 0.999996035501979 \tabularnewline
68 & 6.03236515514403e-06 & 1.20647303102881e-05 & 0.999993967634845 \tabularnewline
69 & 6.89319864193642e-06 & 1.37863972838728e-05 & 0.999993106801358 \tabularnewline
70 & 1.749948622714e-05 & 3.499897245428e-05 & 0.999982500513773 \tabularnewline
71 & 1.66147242562421e-05 & 3.32294485124842e-05 & 0.999983385275744 \tabularnewline
72 & 1.54148738241297e-05 & 3.08297476482594e-05 & 0.999984585126176 \tabularnewline
73 & 4.89413590913824e-05 & 9.78827181827647e-05 & 0.999951058640909 \tabularnewline
74 & 0.000221225720378729 & 0.000442451440757458 & 0.999778774279621 \tabularnewline
75 & 0.00149257859595102 & 0.00298515719190204 & 0.99850742140405 \tabularnewline
76 & 0.00185282725209932 & 0.00370565450419865 & 0.9981471727479 \tabularnewline
77 & 0.00225622172770083 & 0.00451244345540165 & 0.997743778272299 \tabularnewline
78 & 0.00326454264117569 & 0.00652908528235138 & 0.996735457358824 \tabularnewline
\hline
\end{tabular}
%Source: https://freestatistics.org/blog/index.php?pk=25802&T=5

[TABLE]
[ROW][C]Goldfeld-Quandt test for Heteroskedasticity[/C][/ROW]
[ROW][C]p-values[/C][C]Alternative Hypothesis[/C][/ROW]
[ROW][C]breakpoint index[/C][C]greater[/C][C]2-sided[/C][C]less[/C][/ROW]
[ROW][C]16[/C][C]0.314327656813306[/C][C]0.628655313626612[/C][C]0.685672343186694[/C][/ROW]
[ROW][C]17[/C][C]0.201319410231666[/C][C]0.402638820463333[/C][C]0.798680589768334[/C][/ROW]
[ROW][C]18[/C][C]0.112709150482457[/C][C]0.225418300964913[/C][C]0.887290849517543[/C][/ROW]
[ROW][C]19[/C][C]0.0551861205460129[/C][C]0.110372241092026[/C][C]0.944813879453987[/C][/ROW]
[ROW][C]20[/C][C]0.0265188744105748[/C][C]0.0530377488211496[/C][C]0.973481125589425[/C][/ROW]
[ROW][C]21[/C][C]0.0121499786299029[/C][C]0.0242999572598058[/C][C]0.987850021370097[/C][/ROW]
[ROW][C]22[/C][C]0.00512066356364845[/C][C]0.0102413271272969[/C][C]0.994879336436352[/C][/ROW]
[ROW][C]23[/C][C]0.00202535295531559[/C][C]0.00405070591063118[/C][C]0.997974647044684[/C][/ROW]
[ROW][C]24[/C][C]0.000852348781405411[/C][C]0.00170469756281082[/C][C]0.999147651218595[/C][/ROW]
[ROW][C]25[/C][C]0.000636781415941256[/C][C]0.00127356283188251[/C][C]0.99936321858406[/C][/ROW]
[ROW][C]26[/C][C]0.000309015981362028[/C][C]0.000618031962724057[/C][C]0.999690984018638[/C][/ROW]
[ROW][C]27[/C][C]0.000114011931619453[/C][C]0.000228023863238905[/C][C]0.99988598806838[/C][/ROW]
[ROW][C]28[/C][C]4.67560952385985e-05[/C][C]9.35121904771969e-05[/C][C]0.99995324390476[/C][/ROW]
[ROW][C]29[/C][C]2.03590224092023e-05[/C][C]4.07180448184045e-05[/C][C]0.99997964097759[/C][/ROW]
[ROW][C]30[/C][C]9.38931233570382e-06[/C][C]1.87786246714076e-05[/C][C]0.999990610687664[/C][/ROW]
[ROW][C]31[/C][C]3.10307502933647e-06[/C][C]6.20615005867295e-06[/C][C]0.99999689692497[/C][/ROW]
[ROW][C]32[/C][C]1.11493462809939e-06[/C][C]2.22986925619878e-06[/C][C]0.999998885065372[/C][/ROW]
[ROW][C]33[/C][C]4.66008386582517e-07[/C][C]9.32016773165033e-07[/C][C]0.999999533991613[/C][/ROW]
[ROW][C]34[/C][C]1.44308025583295e-07[/C][C]2.88616051166590e-07[/C][C]0.999999855691974[/C][/ROW]
[ROW][C]35[/C][C]5.60535005304867e-08[/C][C]1.12107001060973e-07[/C][C]0.9999999439465[/C][/ROW]
[ROW][C]36[/C][C]1.89129001450443e-08[/C][C]3.78258002900886e-08[/C][C]0.9999999810871[/C][/ROW]
[ROW][C]37[/C][C]6.84600340230841e-09[/C][C]1.36920068046168e-08[/C][C]0.999999993153997[/C][/ROW]
[ROW][C]38[/C][C]1.95265987770946e-09[/C][C]3.90531975541891e-09[/C][C]0.99999999804734[/C][/ROW]
[ROW][C]39[/C][C]7.20919758186604e-10[/C][C]1.44183951637321e-09[/C][C]0.99999999927908[/C][/ROW]
[ROW][C]40[/C][C]3.95309271269926e-10[/C][C]7.90618542539852e-10[/C][C]0.99999999960469[/C][/ROW]
[ROW][C]41[/C][C]1.09811182825528e-10[/C][C]2.19622365651056e-10[/C][C]0.999999999890189[/C][/ROW]
[ROW][C]42[/C][C]2.89163939591948e-11[/C][C]5.78327879183897e-11[/C][C]0.999999999971084[/C][/ROW]
[ROW][C]43[/C][C]8.62036255578048e-12[/C][C]1.72407251115610e-11[/C][C]0.99999999999138[/C][/ROW]
[ROW][C]44[/C][C]2.8346291751815e-12[/C][C]5.669258350363e-12[/C][C]0.999999999997165[/C][/ROW]
[ROW][C]45[/C][C]7.44509583512648e-13[/C][C]1.48901916702530e-12[/C][C]0.999999999999255[/C][/ROW]
[ROW][C]46[/C][C]2.41387364993735e-13[/C][C]4.82774729987469e-13[/C][C]0.999999999999759[/C][/ROW]
[ROW][C]47[/C][C]8.70927995227301e-14[/C][C]1.74185599045460e-13[/C][C]0.999999999999913[/C][/ROW]
[ROW][C]48[/C][C]2.26835983943272e-14[/C][C]4.53671967886544e-14[/C][C]0.999999999999977[/C][/ROW]
[ROW][C]49[/C][C]5.30788669405463e-15[/C][C]1.06157733881093e-14[/C][C]0.999999999999995[/C][/ROW]
[ROW][C]50[/C][C]1.21352121072215e-15[/C][C]2.42704242144430e-15[/C][C]0.999999999999999[/C][/ROW]
[ROW][C]51[/C][C]2.97582814913398e-16[/C][C]5.95165629826796e-16[/C][C]1[/C][/ROW]
[ROW][C]52[/C][C]7.7227371287962e-17[/C][C]1.54454742575924e-16[/C][C]1[/C][/ROW]
[ROW][C]53[/C][C]2.09141179857422e-17[/C][C]4.18282359714844e-17[/C][C]1[/C][/ROW]
[ROW][C]54[/C][C]1.81884447192535e-17[/C][C]3.6376889438507e-17[/C][C]1[/C][/ROW]
[ROW][C]55[/C][C]5.10508866666882e-17[/C][C]1.02101773333376e-16[/C][C]1[/C][/ROW]
[ROW][C]56[/C][C]1.33023295492750e-16[/C][C]2.66046590985501e-16[/C][C]1[/C][/ROW]
[ROW][C]57[/C][C]3.74520428257021e-16[/C][C]7.49040856514042e-16[/C][C]1[/C][/ROW]
[ROW][C]58[/C][C]2.84361456800644e-15[/C][C]5.68722913601288e-15[/C][C]0.999999999999997[/C][/ROW]
[ROW][C]59[/C][C]1.14725742282410e-14[/C][C]2.29451484564820e-14[/C][C]0.999999999999988[/C][/ROW]
[ROW][C]60[/C][C]1.03024229898989e-13[/C][C]2.06048459797978e-13[/C][C]0.999999999999897[/C][/ROW]
[ROW][C]61[/C][C]7.80693527698712e-12[/C][C]1.56138705539742e-11[/C][C]0.999999999992193[/C][/ROW]
[ROW][C]62[/C][C]3.42127954605493e-10[/C][C]6.84255909210985e-10[/C][C]0.999999999657872[/C][/ROW]
[ROW][C]63[/C][C]4.01580066247472e-09[/C][C]8.03160132494944e-09[/C][C]0.9999999959842[/C][/ROW]
[ROW][C]64[/C][C]6.00672386271696e-08[/C][C]1.20134477254339e-07[/C][C]0.999999939932761[/C][/ROW]
[ROW][C]65[/C][C]1.20860531602444e-06[/C][C]2.41721063204888e-06[/C][C]0.999998791394684[/C][/ROW]
[ROW][C]66[/C][C]1.13061559802609e-06[/C][C]2.26123119605219e-06[/C][C]0.999998869384402[/C][/ROW]
[ROW][C]67[/C][C]3.96449802128886e-06[/C][C]7.92899604257773e-06[/C][C]0.999996035501979[/C][/ROW]
[ROW][C]68[/C][C]6.03236515514403e-06[/C][C]1.20647303102881e-05[/C][C]0.999993967634845[/C][/ROW]
[ROW][C]69[/C][C]6.89319864193642e-06[/C][C]1.37863972838728e-05[/C][C]0.999993106801358[/C][/ROW]
[ROW][C]70[/C][C]1.749948622714e-05[/C][C]3.499897245428e-05[/C][C]0.999982500513773[/C][/ROW]
[ROW][C]71[/C][C]1.66147242562421e-05[/C][C]3.32294485124842e-05[/C][C]0.999983385275744[/C][/ROW]
[ROW][C]72[/C][C]1.54148738241297e-05[/C][C]3.08297476482594e-05[/C][C]0.999984585126176[/C][/ROW]
[ROW][C]73[/C][C]4.89413590913824e-05[/C][C]9.78827181827647e-05[/C][C]0.999951058640909[/C][/ROW]
[ROW][C]74[/C][C]0.000221225720378729[/C][C]0.000442451440757458[/C][C]0.999778774279621[/C][/ROW]
[ROW][C]75[/C][C]0.00149257859595102[/C][C]0.00298515719190204[/C][C]0.99850742140405[/C][/ROW]
[ROW][C]76[/C][C]0.00185282725209932[/C][C]0.00370565450419865[/C][C]0.9981471727479[/C][/ROW]
[ROW][C]77[/C][C]0.00225622172770083[/C][C]0.00451244345540165[/C][C]0.997743778272299[/C][/ROW]
[ROW][C]78[/C][C]0.00326454264117569[/C][C]0.00652908528235138[/C][C]0.996735457358824[/C][/ROW]
[/TABLE]
Source: https://freestatistics.org/blog/index.php?pk=25802&T=5

Globally Unique Identifier (entire table): ba.freestatistics.org/blog/index.php?pk=25802&T=5

As an alternative you can also use a QR Code:  

The GUIDs for individual cells are displayed in the table below:

Goldfeld-Quandt test for Heteroskedasticity
p-valuesAlternative Hypothesis
breakpoint indexgreater2-sidedless
160.3143276568133060.6286553136266120.685672343186694
170.2013194102316660.4026388204633330.798680589768334
180.1127091504824570.2254183009649130.887290849517543
190.05518612054601290.1103722410920260.944813879453987
200.02651887441057480.05303774882114960.973481125589425
210.01214997862990290.02429995725980580.987850021370097
220.005120663563648450.01024132712729690.994879336436352
230.002025352955315590.004050705910631180.997974647044684
240.0008523487814054110.001704697562810820.999147651218595
250.0006367814159412560.001273562831882510.99936321858406
260.0003090159813620280.0006180319627240570.999690984018638
270.0001140119316194530.0002280238632389050.99988598806838
284.67560952385985e-059.35121904771969e-050.99995324390476
292.03590224092023e-054.07180448184045e-050.99997964097759
309.38931233570382e-061.87786246714076e-050.999990610687664
313.10307502933647e-066.20615005867295e-060.99999689692497
321.11493462809939e-062.22986925619878e-060.999998885065372
334.66008386582517e-079.32016773165033e-070.999999533991613
341.44308025583295e-072.88616051166590e-070.999999855691974
355.60535005304867e-081.12107001060973e-070.9999999439465
361.89129001450443e-083.78258002900886e-080.9999999810871
376.84600340230841e-091.36920068046168e-080.999999993153997
381.95265987770946e-093.90531975541891e-090.99999999804734
397.20919758186604e-101.44183951637321e-090.99999999927908
403.95309271269926e-107.90618542539852e-100.99999999960469
411.09811182825528e-102.19622365651056e-100.999999999890189
422.89163939591948e-115.78327879183897e-110.999999999971084
438.62036255578048e-121.72407251115610e-110.99999999999138
442.8346291751815e-125.669258350363e-120.999999999997165
457.44509583512648e-131.48901916702530e-120.999999999999255
462.41387364993735e-134.82774729987469e-130.999999999999759
478.70927995227301e-141.74185599045460e-130.999999999999913
482.26835983943272e-144.53671967886544e-140.999999999999977
495.30788669405463e-151.06157733881093e-140.999999999999995
501.21352121072215e-152.42704242144430e-150.999999999999999
512.97582814913398e-165.95165629826796e-161
527.7227371287962e-171.54454742575924e-161
532.09141179857422e-174.18282359714844e-171
541.81884447192535e-173.6376889438507e-171
555.10508866666882e-171.02101773333376e-161
561.33023295492750e-162.66046590985501e-161
573.74520428257021e-167.49040856514042e-161
582.84361456800644e-155.68722913601288e-150.999999999999997
591.14725742282410e-142.29451484564820e-140.999999999999988
601.03024229898989e-132.06048459797978e-130.999999999999897
617.80693527698712e-121.56138705539742e-110.999999999992193
623.42127954605493e-106.84255909210985e-100.999999999657872
634.01580066247472e-098.03160132494944e-090.9999999959842
646.00672386271696e-081.20134477254339e-070.999999939932761
651.20860531602444e-062.41721063204888e-060.999998791394684
661.13061559802609e-062.26123119605219e-060.999998869384402
673.96449802128886e-067.92899604257773e-060.999996035501979
686.03236515514403e-061.20647303102881e-050.999993967634845
696.89319864193642e-061.37863972838728e-050.999993106801358
701.749948622714e-053.499897245428e-050.999982500513773
711.66147242562421e-053.32294485124842e-050.999983385275744
721.54148738241297e-053.08297476482594e-050.999984585126176
734.89413590913824e-059.78827181827647e-050.999951058640909
740.0002212257203787290.0004424514407574580.999778774279621
750.001492578595951020.002985157191902040.99850742140405
760.001852827252099320.003705654504198650.9981471727479
770.002256221727700830.004512443455401650.997743778272299
780.003264542641175690.006529085282351380.996735457358824


Meta Analysis of Goldfeld-Quandt test for Heteroskedasticity
Description# significant tests% significant testsOK/NOK
1% type I error level560.888888888888889NOK
5% type I error level580.92063492063492NOK
10% type I error level590.936507936507937NOK

\begin{tabular}{lllllllll}
\hline
Meta Analysis of Goldfeld-Quandt test for Heteroskedasticity \tabularnewline
Description & # significant tests & % significant tests & OK/NOK \tabularnewline
1% type I error level & 56 & 0.888888888888889 & NOK \tabularnewline
5% type I error level & 58 & 0.92063492063492 & NOK \tabularnewline
10% type I error level & 59 & 0.936507936507937 & NOK \tabularnewline
\hline
\end{tabular}
%Source: https://freestatistics.org/blog/index.php?pk=25802&T=6

[TABLE]
[ROW][C]Meta Analysis of Goldfeld-Quandt test for Heteroskedasticity[/C][/ROW]
[ROW][C]Description[/C][C]# significant tests[/C][C]% significant tests[/C][C]OK/NOK[/C][/ROW]
[ROW][C]1% type I error level[/C][C]56[/C][C]0.888888888888889[/C][C]NOK[/C][/ROW]
[ROW][C]5% type I error level[/C][C]58[/C][C]0.92063492063492[/C][C]NOK[/C][/ROW]
[ROW][C]10% type I error level[/C][C]59[/C][C]0.936507936507937[/C][C]NOK[/C][/ROW]
[/TABLE]
Source: https://freestatistics.org/blog/index.php?pk=25802&T=6

Globally Unique Identifier (entire table): ba.freestatistics.org/blog/index.php?pk=25802&T=6

As an alternative you can also use a QR Code:  

The GUIDs for individual cells are displayed in the table below:

Meta Analysis of Goldfeld-Quandt test for Heteroskedasticity
Description# significant tests% significant testsOK/NOK
1% type I error level560.888888888888889NOK
5% type I error level580.92063492063492NOK
10% type I error level590.936507936507937NOK


Parameters (Session):
par1 = 1 ; par2 = Include Monthly Dummies ; par3 = No Linear Trend ;
Parameters (R input):
par1 = 1 ; par2 = Include Monthly Dummies ; par3 = No Linear Trend ;
R code (references can be found in the software module):
library(lattice)
library(lmtest)
n25 <- 25 #minimum number of obs. for Goldfeld-Quandt test
par1 <- as.numeric(par1)
x <- t(y)
k <- length(x[1,])
n <- length(x[,1])
x1 <- cbind(x[,par1], x[,1:k!=par1])
mycolnames <- c(colnames(x)[par1], colnames(x)[1:k!=par1])
colnames(x1) <- mycolnames #colnames(x)[par1]
x <- x1
if (par3 == 'First Differences'){
x2 <- array(0, dim=c(n-1,k), dimnames=list(1:(n-1), paste('(1-B)',colnames(x),sep='')))
for (i in 1:n-1) {
for (j in 1:k) {
x2[i,j] <- x[i+1,j] - x[i,j]
}
}
x <- x2
}
if (par2 == 'Include Monthly Dummies'){
x2 <- array(0, dim=c(n,11), dimnames=list(1:n, paste('M', seq(1:11), sep ='')))
for (i in 1:11){
x2[seq(i,n,12),i] <- 1
}
x <- cbind(x, x2)
}
if (par2 == 'Include Quarterly Dummies'){
x2 <- array(0, dim=c(n,3), dimnames=list(1:n, paste('Q', seq(1:3), sep ='')))
for (i in 1:3){
x2[seq(i,n,4),i] <- 1
}
x <- cbind(x, x2)
}
k <- length(x[1,])
if (par3 == 'Linear Trend'){
x <- cbind(x, c(1:n))
colnames(x)[k+1] <- 't'
}
x
k <- length(x[1,])
df <- as.data.frame(x)
(mylm <- lm(df))
(mysum <- summary(mylm))
if (n > n25) {
kp3 <- k + 3
nmkm3 <- n - k - 3
gqarr <- array(NA, dim=c(nmkm3-kp3+1,3))
numgqtests <- 0
numsignificant1 <- 0
numsignificant5 <- 0
numsignificant10 <- 0
for (mypoint in kp3:nmkm3) {
j <- 0
numgqtests <- numgqtests + 1
for (myalt in c('greater', 'two.sided', 'less')) {
j <- j + 1
gqarr[mypoint-kp3+1,j] <- gqtest(mylm, point=mypoint, alternative=myalt)$p.value
}
if (gqarr[mypoint-kp3+1,2] < 0.01) numsignificant1 <- numsignificant1 + 1
if (gqarr[mypoint-kp3+1,2] < 0.05) numsignificant5 <- numsignificant5 + 1
if (gqarr[mypoint-kp3+1,2] < 0.10) numsignificant10 <- numsignificant10 + 1
}
gqarr
}
bitmap(file='test0.png')
plot(x[,1], type='l', main='Actuals and Interpolation', ylab='value of Actuals and Interpolation (dots)', xlab='time or index')
points(x[,1]-mysum$resid)
grid()
dev.off()
bitmap(file='test1.png')
plot(mysum$resid, type='b', pch=19, main='Residuals', ylab='value of Residuals', xlab='time or index')
grid()
dev.off()
bitmap(file='test2.png')
hist(mysum$resid, main='Residual Histogram', xlab='values of Residuals')
grid()
dev.off()
bitmap(file='test3.png')
densityplot(~mysum$resid,col='black',main='Residual Density Plot', xlab='values of Residuals')
dev.off()
bitmap(file='test4.png')
qqnorm(mysum$resid, main='Residual Normal Q-Q Plot')
qqline(mysum$resid)
grid()
dev.off()
(myerror <- as.ts(mysum$resid))
bitmap(file='test5.png')
dum <- cbind(lag(myerror,k=1),myerror)
dum
dum1 <- dum[2:length(myerror),]
dum1
z <- as.data.frame(dum1)
z
plot(z,main=paste('Residual Lag plot, lowess, and regression line'), ylab='values of Residuals', xlab='lagged values of Residuals')
lines(lowess(z))
abline(lm(z))
grid()
dev.off()
bitmap(file='test6.png')
acf(mysum$resid, lag.max=length(mysum$resid)/2, main='Residual Autocorrelation Function')
grid()
dev.off()
bitmap(file='test7.png')
pacf(mysum$resid, lag.max=length(mysum$resid)/2, main='Residual Partial Autocorrelation Function')
grid()
dev.off()
bitmap(file='test8.png')
opar <- par(mfrow = c(2,2), oma = c(0, 0, 1.1, 0))
plot(mylm, las = 1, sub='Residual Diagnostics')
par(opar)
dev.off()
if (n > n25) {
bitmap(file='test9.png')
plot(kp3:nmkm3,gqarr[,2], main='Goldfeld-Quandt test',ylab='2-sided p-value',xlab='breakpoint')
grid()
dev.off()
}
load(file='createtable')
a<-table.start()
a<-table.row.start(a)
a<-table.element(a, 'Multiple Linear Regression - Estimated Regression Equation', 1, TRUE)
a<-table.row.end(a)
myeq <- colnames(x)[1]
myeq <- paste(myeq, '[t] = ', sep='')
for (i in 1:k){
if (mysum$coefficients[i,1] > 0) myeq <- paste(myeq, '+', '')
myeq <- paste(myeq, mysum$coefficients[i,1], sep=' ')
if (rownames(mysum$coefficients)[i] != '(Intercept)') {
myeq <- paste(myeq, rownames(mysum$coefficients)[i], sep='')
if (rownames(mysum$coefficients)[i] != 't') myeq <- paste(myeq, '[t]', sep='')
}
}
myeq <- paste(myeq, ' + e[t]')
a<-table.row.start(a)
a<-table.element(a, myeq)
a<-table.row.end(a)
a<-table.end(a)
table.save(a,file='mytable1.tab')
a<-table.start()
a<-table.row.start(a)
a<-table.element(a,hyperlink('ols1.htm','Multiple Linear Regression - Ordinary Least Squares',''), 6, TRUE)
a<-table.row.end(a)
a<-table.row.start(a)
a<-table.element(a,'Variable',header=TRUE)
a<-table.element(a,'Parameter',header=TRUE)
a<-table.element(a,'S.D.',header=TRUE)
a<-table.element(a,'T-STAT
H0: parameter = 0',header=TRUE)
a<-table.element(a,'2-tail p-value',header=TRUE)
a<-table.element(a,'1-tail p-value',header=TRUE)
a<-table.row.end(a)
for (i in 1:k){
a<-table.row.start(a)
a<-table.element(a,rownames(mysum$coefficients)[i],header=TRUE)
a<-table.element(a,mysum$coefficients[i,1])
a<-table.element(a, round(mysum$coefficients[i,2],6))
a<-table.element(a, round(mysum$coefficients[i,3],4))
a<-table.element(a, round(mysum$coefficients[i,4],6))
a<-table.element(a, round(mysum$coefficients[i,4]/2,6))
a<-table.row.end(a)
}
a<-table.end(a)
table.save(a,file='mytable2.tab')
a<-table.start()
a<-table.row.start(a)
a<-table.element(a, 'Multiple Linear Regression - Regression Statistics', 2, TRUE)
a<-table.row.end(a)
a<-table.row.start(a)
a<-table.element(a, 'Multiple R',1,TRUE)
a<-table.element(a, sqrt(mysum$r.squared))
a<-table.row.end(a)
a<-table.row.start(a)
a<-table.element(a, 'R-squared',1,TRUE)
a<-table.element(a, mysum$r.squared)
a<-table.row.end(a)
a<-table.row.start(a)
a<-table.element(a, 'Adjusted R-squared',1,TRUE)
a<-table.element(a, mysum$adj.r.squared)
a<-table.row.end(a)
a<-table.row.start(a)
a<-table.element(a, 'F-TEST (value)',1,TRUE)
a<-table.element(a, mysum$fstatistic[1])
a<-table.row.end(a)
a<-table.row.start(a)
a<-table.element(a, 'F-TEST (DF numerator)',1,TRUE)
a<-table.element(a, mysum$fstatistic[2])
a<-table.row.end(a)
a<-table.row.start(a)
a<-table.element(a, 'F-TEST (DF denominator)',1,TRUE)
a<-table.element(a, mysum$fstatistic[3])
a<-table.row.end(a)
a<-table.row.start(a)
a<-table.element(a, 'p-value',1,TRUE)
a<-table.element(a, 1-pf(mysum$fstatistic[1],mysum$fstatistic[2],mysum$fstatistic[3]))
a<-table.row.end(a)
a<-table.row.start(a)
a<-table.element(a, 'Multiple Linear Regression - Residual Statistics', 2, TRUE)
a<-table.row.end(a)
a<-table.row.start(a)
a<-table.element(a, 'Residual Standard Deviation',1,TRUE)
a<-table.element(a, mysum$sigma)
a<-table.row.end(a)
a<-table.row.start(a)
a<-table.element(a, 'Sum Squared Residuals',1,TRUE)
a<-table.element(a, sum(myerror*myerror))
a<-table.row.end(a)
a<-table.end(a)
table.save(a,file='mytable3.tab')
a<-table.start()
a<-table.row.start(a)
a<-table.element(a, 'Multiple Linear Regression - Actuals, Interpolation, and Residuals', 4, TRUE)
a<-table.row.end(a)
a<-table.row.start(a)
a<-table.element(a, 'Time or Index', 1, TRUE)
a<-table.element(a, 'Actuals', 1, TRUE)
a<-table.element(a, 'Interpolation
Forecast', 1, TRUE)
a<-table.element(a, 'Residuals
Prediction Error', 1, TRUE)
a<-table.row.end(a)
for (i in 1:n) {
a<-table.row.start(a)
a<-table.element(a,i, 1, TRUE)
a<-table.element(a,x[i])
a<-table.element(a,x[i]-mysum$resid[i])
a<-table.element(a,mysum$resid[i])
a<-table.row.end(a)
}
a<-table.end(a)
table.save(a,file='mytable4.tab')
if (n > n25) {
a<-table.start()
a<-table.row.start(a)
a<-table.element(a,'Goldfeld-Quandt test for Heteroskedasticity',4,TRUE)
a<-table.row.end(a)
a<-table.row.start(a)
a<-table.element(a,'p-values',header=TRUE)
a<-table.element(a,'Alternative Hypothesis',3,header=TRUE)
a<-table.row.end(a)
a<-table.row.start(a)
a<-table.element(a,'breakpoint index',header=TRUE)
a<-table.element(a,'greater',header=TRUE)
a<-table.element(a,'2-sided',header=TRUE)
a<-table.element(a,'less',header=TRUE)
a<-table.row.end(a)
for (mypoint in kp3:nmkm3) {
a<-table.row.start(a)
a<-table.element(a,mypoint,header=TRUE)
a<-table.element(a,gqarr[mypoint-kp3+1,1])
a<-table.element(a,gqarr[mypoint-kp3+1,2])
a<-table.element(a,gqarr[mypoint-kp3+1,3])
a<-table.row.end(a)
}
a<-table.end(a)
table.save(a,file='mytable5.tab')
a<-table.start()
a<-table.row.start(a)
a<-table.element(a,'Meta Analysis of Goldfeld-Quandt test for Heteroskedasticity',4,TRUE)
a<-table.row.end(a)
a<-table.row.start(a)
a<-table.element(a,'Description',header=TRUE)
a<-table.element(a,'# significant tests',header=TRUE)
a<-table.element(a,'% significant tests',header=TRUE)
a<-table.element(a,'OK/NOK',header=TRUE)
a<-table.row.end(a)
a<-table.row.start(a)
a<-table.element(a,'1% type I error level',header=TRUE)
a<-table.element(a,numsignificant1)
a<-table.element(a,numsignificant1/numgqtests)
if (numsignificant1/numgqtests < 0.01) dum <- 'OK' else dum <- 'NOK'
a<-table.element(a,dum)
a<-table.row.end(a)
a<-table.row.start(a)
a<-table.element(a,'5% type I error level',header=TRUE)
a<-table.element(a,numsignificant5)
a<-table.element(a,numsignificant5/numgqtests)
if (numsignificant5/numgqtests < 0.05) dum <- 'OK' else dum <- 'NOK'
a<-table.element(a,dum)
a<-table.row.end(a)
a<-table.row.start(a)
a<-table.element(a,'10% type I error level',header=TRUE)
a<-table.element(a,numsignificant10)
a<-table.element(a,numsignificant10/numgqtests)
if (numsignificant10/numgqtests < 0.1) dum <- 'OK' else dum <- 'NOK'
a<-table.element(a,dum)
a<-table.row.end(a)
a<-table.end(a)
table.save(a,file='mytable6.tab')
}