Free Statistics

of Irreproducible Research!

Author's title

Author*The author of this computation has been verified*
R Software Modulerwasp_multipleregression.wasp
Title produced by softwareMultiple Regression
Date of computationThu, 27 Nov 2008 05:36:10 -0700
Cite this page as followsStatistical Computations at FreeStatistics.org, Office for Research Development and Education, URL https://freestatistics.org/blog/index.php?v=date/2008/Nov/27/t1227789497y26tib3099p5kqp.htm/, Retrieved Sun, 19 May 2024 10:22:37 +0000
Statistical Computations at FreeStatistics.org, Office for Research Development and Education, URL https://freestatistics.org/blog/index.php?pk=25780, Retrieved Sun, 19 May 2024 10:22:37 +0000
QR Codes:

Original text written by user:
IsPrivate?No (this computation is public)
User-defined keywords
Estimated Impact180
Family? (F = Feedback message, R = changed R code, M = changed R Module, P = changed Parameters, D = changed Data)
-     [Multiple Regression] [Case: the Seatbel...] [2008-11-26 16:42:24] [b6c777429d07a05453509ef079833861]
F R  D  [Multiple Regression] [Seatbelt Q3 Aok] [2008-11-27 12:29:10] [7849b5cbaea5f05923be73656f726e58]
F   PD      [Multiple Regression] [case seatbelt Q3 Bok] [2008-11-27 12:36:10] [c5d6d05aee6be5527ac4a30a8c3b8fe5] [Current]
Feedback Forum
2008-11-30 17:40:12 [5faab2fc6fb120339944528a32d48a04] [reply
Goed uitgewerkt, niet gedetailleerd genoeg. Eerste deel is overbodig.
Als we de P-waarde bekijken en vergelijken met de alpha-fout van 5% is de p-waarde groter dan de alpha fout wat geen significant verschil betekent. Daarnaast is het effect van de dummie niet op voorhand gekend en wordt er dus een tweezijdige toets gebruikt.Voor een betere interpretatie in verband met de significantie, kijken we naar de T-stat. Dit is een soort van normaalverdeling maar het heeft een hogere piek en een dikkere staart. Is de absolute t-waarde groter dan 2, dan is er sprake van significantie aangezien er minder dan 5% kans is om de nulhypothese foutief te verwerpen.
Er kan een duidelijkere dummie gebruikt worden.
Adjusted R-squared: hetgeen je van de variabiliteit of spreiding kan verklaren, hoog is zeer goed. Maar om te zien of dit aan toeval te wijten is moeten we de F-test (de verdeling) ook controleren. De p-value moet zo klein mogelijk zijn, dat is hier niet het geval (5), dus de berekeningen kunnen aan toeval te wijten zijn. De actuals and interpolations geeft ons een beeld van de stijgende trend.
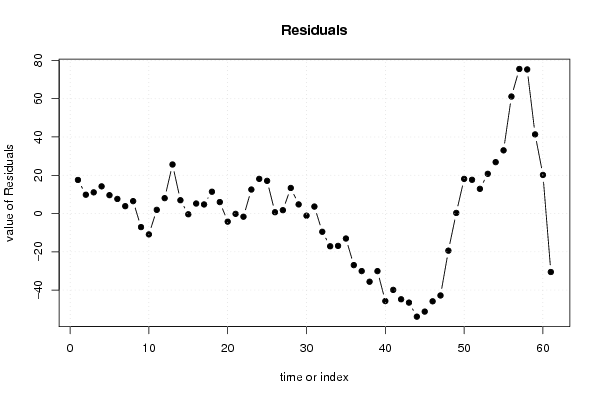
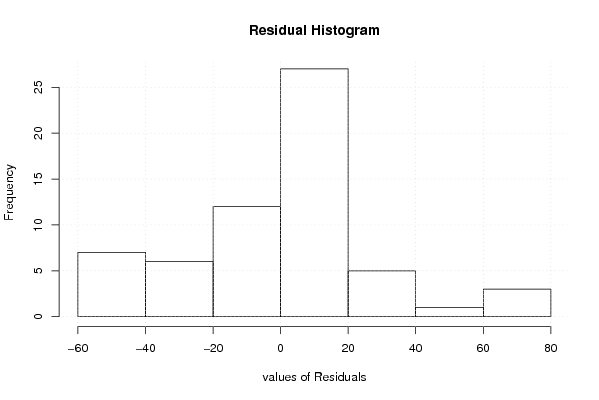
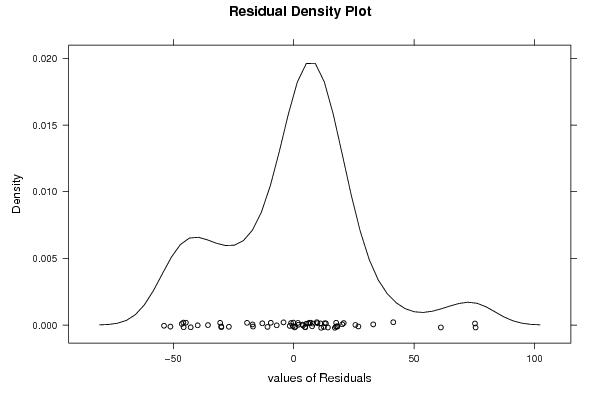
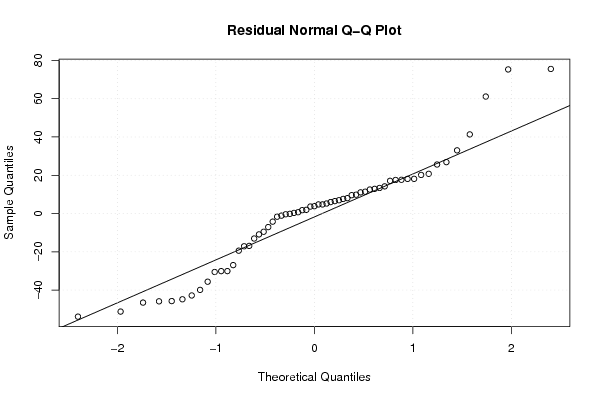
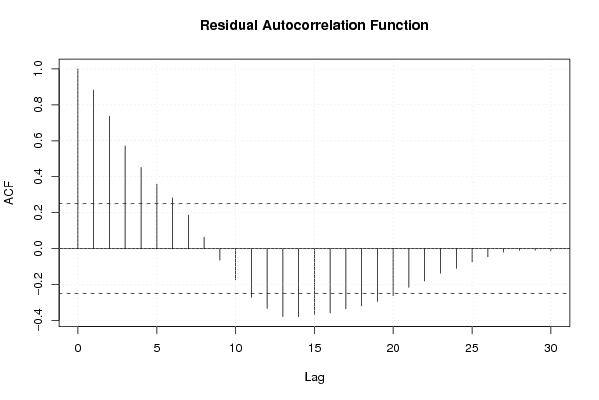
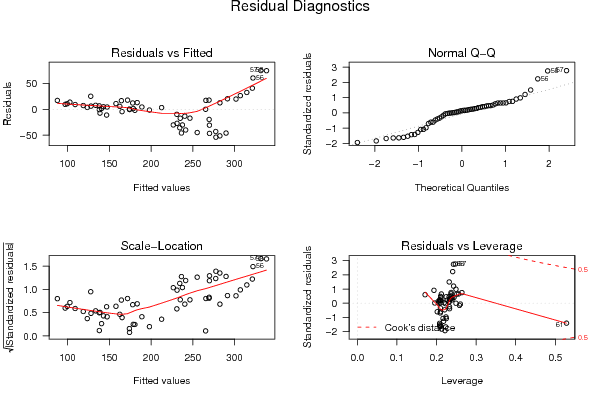
De residuals geeft een beeld van de voorspellingsfout, dit zou een mooi golvend patroon rond 0 moeten weergeven maar is hier niet het geval. Het histogram en het densityplot geven eveneens weer dat de residu's niet normaal verdeeld zijn.De qq-plot toont dat de quantielen van de residu’s niet goed aansluiten aan quantielen van een normaalverdeling. Hierbij toont de residual lag plot dat er sprake is van voorspelbaarheid vanwege de positieve correlatie tussen de voorspellingsfout op tijdstip t en t-1. De residual autocorrelatiefunctie geeft binnen de blauwe stippellijn het 95% betrouwbaarheidsinterval, alle verticale lijntjes buiten deze horizontale stippellijn zijn significant verschillend en dus ook niet te wijten aan toeval. Er is geen sprake van autocorrelatie.
Ook het algemeen besluit is correct, nl: Het model is nog niet helemaal in orde. Om aan de assumpties te voldoen:
•mag er geen patroon of geen autocorrelatie zijn; in orde
•moet het gemiddelde constant en nul zijn; niet in orde
2008-12-01 10:56:03 [Jessica Alves Pires] [reply
Hierboven is Q3 uitvoerig besproken. Ik ben het ermee eens. Ik vind het goed dat je vermeldt waarom je een tweezijdige test gebruikt. Je had wel iets kunnen zeggen over de t-verdeling (zie bovenstaande feedback). Ik vind dat je de grafieken goed gëïnterpreteerd hebt. Je had nog de volgende regressie assumpties kunnen vermelden : De verdeling moet normaal verdeeld zijn en de onzekerheid, dus de spreiding moet constant zijn.
2008-12-01 14:46:23 [Jules De Bruycker] [reply
Ik moet me ook aansluiten bij de eerste student. Dit is volgens mij een juiste interpretatie van Q3.
2008-12-01 16:25:18 [Nicolaj Wuyts] [reply
Bij deze vraag heb je de software niet correct gebruikt. Normaal gezien moet er naast de prijs van de grondstoffen die je invoert een O of 1 status staan, al naargelang je gebeurtenis. Je krijgt nu dus een model dat helemaan niet klopt en waarin je niet beschrijft wat je denkt te beschrijven. De keuze van gebeurtenis zou ook beter kunnen. Het inluiden van een nieuw jaar is volgens mij geen goede gebeurtenis. Eerder zou je beter de gebeurtenis die in dat jaar kunnen nemen als vergelijkingspunt. Als laatste zou ik nog willen opmerken dat het jaar dat je neemt om mee te vergelijken, niet eens in je datareeks is opgenomen. Hierdoor zou je bij de input van de gegevens de hele tijd status 1 moeten krijgen, als je het jaar 2000 als status 0 neemt. Volgens mij is dit niet de bedoeling bij het opstellen van dergelijk model.
2008-12-01 18:26:51 [Marlies Polfliet] [reply
Ik moet mij aansluiten bij de laatste student (Nicolaj Wuyts), als je het word document op het eerste zich bekijkt ziet het er allemaal heel goed uit en heb je een juiste interpretatie gegeven bij de grafieken en tabel. Maar je moest inderdaad naast de prijs van de grondstoffen die je invoert een 0 of 1 status staan, al naargelang de gebeurtenis voltrokken is of niet. En zo verkrijg je wel degelijk een model dat niet klopt. Desondanks deze foute interpretatie van de opdracht/ fout gebruik van de software, heeft de student zeker zijn/haar best gedaan de opdracht goed uit te voeren. De student werkte met de gegevens waarvan hij/zij dacht deze correct waren en heeft elke grafiek uitgebreid behandeld en correcte conclusies getrokken (voor de foutieve gegevens) zie de uitleg van de eerste student.

Post a new message
Dataseries X:
105.4	109.1
107.1	111.4
110.7	114.1
117.1	121.8
118.7	127.6
126.5	129.9
127.5	128
134.6	123.5
131.8	124
135.9	127.4
142.7	127.6
141.7	128.4
153.4	131.4
145	135.1
137.7	134
148.3	144.5
152.2	147.3
169.4	150.9
168.6	148.7
161.1	141.4
174.1	138.9
179	139.8
190.6	145.6
190	147.9
181.6	148.5
174.8	151.1
180.5	157.5
196.8	167.5
193.8	172.3
197	173.5
216.3	187.5
221.4	205.5
217.9	195.1
229.7	204.5
227.4	204.5
204.2	201.7
196.6	207
198.8	206.6
207.5	210.6
190.7	211.1
201.6	215
210.5	223.9
223.5	238.2
223.8	238.9
231.2	229.6
244	232.2
234.7	222.1
250.2	221.6
265.7	227.3
287.6	221
283.3	213.6
295.4	243.4
312.3	253.8
333.8	265.3
347.7	268.2
383.2	268.5
407.1	266.9
413.6	268.4
362.7	250.8
321.9	231.2
239.4	192


Summary of computational transaction
Raw Inputview raw input (R code)
Raw Outputview raw output of R engine
Computing time7 seconds
R Server'Herman Ole Andreas Wold' @ 193.190.124.10:1001

\begin{tabular}{lllllllll}
\hline
Summary of computational transaction \tabularnewline
Raw Input & view raw input (R code)  \tabularnewline
Raw Output & view raw output of R engine  \tabularnewline
Computing time & 7 seconds \tabularnewline
R Server & 'Herman Ole Andreas Wold' @ 193.190.124.10:1001 \tabularnewline
\hline
\end{tabular}
%Source: https://freestatistics.org/blog/index.php?pk=25780&T=0

[TABLE]
[ROW][C]Summary of computational transaction[/C][/ROW]
[ROW][C]Raw Input[/C][C]view raw input (R code) [/C][/ROW]
[ROW][C]Raw Output[/C][C]view raw output of R engine [/C][/ROW]
[ROW][C]Computing time[/C][C]7 seconds[/C][/ROW]
[ROW][C]R Server[/C][C]'Herman Ole Andreas Wold' @ 193.190.124.10:1001[/C][/ROW]
[/TABLE]
Source: https://freestatistics.org/blog/index.php?pk=25780&T=0

Globally Unique Identifier (entire table): ba.freestatistics.org/blog/index.php?pk=25780&T=0

As an alternative you can also use a QR Code:  

The GUIDs for individual cells are displayed in the table below:

Summary of computational transaction
Raw Inputview raw input (R code)
Raw Outputview raw output of R engine
Computing time7 seconds
R Server'Herman Ole Andreas Wold' @ 193.190.124.10:1001


Multiple Linear Regression - Estimated Regression Equation
alg_indexcijfer_grondstoffen[t] = + 28.6031604240415 + 0.613848589128495indexcijfer_industr_grondstoffen[t] -9.91563842933872M1[t] -4.10807717988457M2[t] -5.57956194365494M3[t] -9.2283344982305M4[t] -8.75579974377452M5[t] -2.59871104575340M6[t] + 1.16748553939799M7[t] + 6.1967995092808M8[t] + 14.4705898728474M9[t] + 18.1185448337778M10[t] + 9.77590364882332M11[t] + 2.18674406177216t + e[t]

\begin{tabular}{lllllllll}
\hline
Multiple Linear Regression - Estimated Regression Equation \tabularnewline
alg_indexcijfer_grondstoffen[t] =  +  28.6031604240415 +  0.613848589128495indexcijfer_industr_grondstoffen[t] -9.91563842933872M1[t] -4.10807717988457M2[t] -5.57956194365494M3[t] -9.2283344982305M4[t] -8.75579974377452M5[t] -2.59871104575340M6[t] +  1.16748553939799M7[t] +  6.1967995092808M8[t] +  14.4705898728474M9[t] +  18.1185448337778M10[t] +  9.77590364882332M11[t] +  2.18674406177216t  + e[t] \tabularnewline
\hline
\end{tabular}
%Source: https://freestatistics.org/blog/index.php?pk=25780&T=1

[TABLE]
[ROW][C]Multiple Linear Regression - Estimated Regression Equation[/C][/ROW]
[ROW][C]alg_indexcijfer_grondstoffen[t] =  +  28.6031604240415 +  0.613848589128495indexcijfer_industr_grondstoffen[t] -9.91563842933872M1[t] -4.10807717988457M2[t] -5.57956194365494M3[t] -9.2283344982305M4[t] -8.75579974377452M5[t] -2.59871104575340M6[t] +  1.16748553939799M7[t] +  6.1967995092808M8[t] +  14.4705898728474M9[t] +  18.1185448337778M10[t] +  9.77590364882332M11[t] +  2.18674406177216t  + e[t][/C][/ROW]
[/TABLE]
Source: https://freestatistics.org/blog/index.php?pk=25780&T=1

Globally Unique Identifier (entire table): ba.freestatistics.org/blog/index.php?pk=25780&T=1

As an alternative you can also use a QR Code:  

The GUIDs for individual cells are displayed in the table below:

Multiple Linear Regression - Estimated Regression Equation
alg_indexcijfer_grondstoffen[t] = + 28.6031604240415 + 0.613848589128495indexcijfer_industr_grondstoffen[t] -9.91563842933872M1[t] -4.10807717988457M2[t] -5.57956194365494M3[t] -9.2283344982305M4[t] -8.75579974377452M5[t] -2.59871104575340M6[t] + 1.16748553939799M7[t] + 6.1967995092808M8[t] + 14.4705898728474M9[t] + 18.1185448337778M10[t] + 9.77590364882332M11[t] + 2.18674406177216t + e[t]


Multiple Linear Regression - Ordinary Least Squares
VariableParameterS.D.T-STATH0: parameter = 02-tail p-value1-tail p-value
(Intercept)28.603160424041532.9578180.86790.3898740.194937
indexcijfer_industr_grondstoffen0.6138485891284950.3131351.96030.05590.02795
M1-9.9156384293387219.149104-0.51780.6070180.303509
M2-4.1080771798845720.127389-0.20410.8391540.419577
M3-5.5795619436549420.065291-0.27810.7821780.391089
M4-9.228334498230520.396-0.45250.6530210.32651
M5-8.7557997437745220.571324-0.42560.6723190.33616
M6-2.5987110457534020.784164-0.1250.9010310.450515
M71.1674855393979921.0278330.05550.9559590.477979
M86.196799509280820.9014970.29650.7681730.384086
M914.470589872847420.3270710.71190.4800530.240027
M1018.118544833777820.3788650.88910.3784850.189243
M119.7759036488233220.0336340.4880.6278370.313918
t2.186744061772160.8571082.55130.0140460.007023

\begin{tabular}{lllllllll}
\hline
Multiple Linear Regression - Ordinary Least Squares \tabularnewline
Variable & Parameter & S.D. & T-STATH0: parameter = 0 & 2-tail p-value & 1-tail p-value \tabularnewline
(Intercept) & 28.6031604240415 & 32.957818 & 0.8679 & 0.389874 & 0.194937 \tabularnewline
indexcijfer_industr_grondstoffen & 0.613848589128495 & 0.313135 & 1.9603 & 0.0559 & 0.02795 \tabularnewline
M1 & -9.91563842933872 & 19.149104 & -0.5178 & 0.607018 & 0.303509 \tabularnewline
M2 & -4.10807717988457 & 20.127389 & -0.2041 & 0.839154 & 0.419577 \tabularnewline
M3 & -5.57956194365494 & 20.065291 & -0.2781 & 0.782178 & 0.391089 \tabularnewline
M4 & -9.2283344982305 & 20.396 & -0.4525 & 0.653021 & 0.32651 \tabularnewline
M5 & -8.75579974377452 & 20.571324 & -0.4256 & 0.672319 & 0.33616 \tabularnewline
M6 & -2.59871104575340 & 20.784164 & -0.125 & 0.901031 & 0.450515 \tabularnewline
M7 & 1.16748553939799 & 21.027833 & 0.0555 & 0.955959 & 0.477979 \tabularnewline
M8 & 6.1967995092808 & 20.901497 & 0.2965 & 0.768173 & 0.384086 \tabularnewline
M9 & 14.4705898728474 & 20.327071 & 0.7119 & 0.480053 & 0.240027 \tabularnewline
M10 & 18.1185448337778 & 20.378865 & 0.8891 & 0.378485 & 0.189243 \tabularnewline
M11 & 9.77590364882332 & 20.033634 & 0.488 & 0.627837 & 0.313918 \tabularnewline
t & 2.18674406177216 & 0.857108 & 2.5513 & 0.014046 & 0.007023 \tabularnewline
\hline
\end{tabular}
%Source: https://freestatistics.org/blog/index.php?pk=25780&T=2

[TABLE]
[ROW][C]Multiple Linear Regression - Ordinary Least Squares[/C][/ROW]
[ROW][C]Variable[/C][C]Parameter[/C][C]S.D.[/C][C]T-STATH0: parameter = 0[/C][C]2-tail p-value[/C][C]1-tail p-value[/C][/ROW]
[ROW][C](Intercept)[/C][C]28.6031604240415[/C][C]32.957818[/C][C]0.8679[/C][C]0.389874[/C][C]0.194937[/C][/ROW]
[ROW][C]indexcijfer_industr_grondstoffen[/C][C]0.613848589128495[/C][C]0.313135[/C][C]1.9603[/C][C]0.0559[/C][C]0.02795[/C][/ROW]
[ROW][C]M1[/C][C]-9.91563842933872[/C][C]19.149104[/C][C]-0.5178[/C][C]0.607018[/C][C]0.303509[/C][/ROW]
[ROW][C]M2[/C][C]-4.10807717988457[/C][C]20.127389[/C][C]-0.2041[/C][C]0.839154[/C][C]0.419577[/C][/ROW]
[ROW][C]M3[/C][C]-5.57956194365494[/C][C]20.065291[/C][C]-0.2781[/C][C]0.782178[/C][C]0.391089[/C][/ROW]
[ROW][C]M4[/C][C]-9.2283344982305[/C][C]20.396[/C][C]-0.4525[/C][C]0.653021[/C][C]0.32651[/C][/ROW]
[ROW][C]M5[/C][C]-8.75579974377452[/C][C]20.571324[/C][C]-0.4256[/C][C]0.672319[/C][C]0.33616[/C][/ROW]
[ROW][C]M6[/C][C]-2.59871104575340[/C][C]20.784164[/C][C]-0.125[/C][C]0.901031[/C][C]0.450515[/C][/ROW]
[ROW][C]M7[/C][C]1.16748553939799[/C][C]21.027833[/C][C]0.0555[/C][C]0.955959[/C][C]0.477979[/C][/ROW]
[ROW][C]M8[/C][C]6.1967995092808[/C][C]20.901497[/C][C]0.2965[/C][C]0.768173[/C][C]0.384086[/C][/ROW]
[ROW][C]M9[/C][C]14.4705898728474[/C][C]20.327071[/C][C]0.7119[/C][C]0.480053[/C][C]0.240027[/C][/ROW]
[ROW][C]M10[/C][C]18.1185448337778[/C][C]20.378865[/C][C]0.8891[/C][C]0.378485[/C][C]0.189243[/C][/ROW]
[ROW][C]M11[/C][C]9.77590364882332[/C][C]20.033634[/C][C]0.488[/C][C]0.627837[/C][C]0.313918[/C][/ROW]
[ROW][C]t[/C][C]2.18674406177216[/C][C]0.857108[/C][C]2.5513[/C][C]0.014046[/C][C]0.007023[/C][/ROW]
[/TABLE]
Source: https://freestatistics.org/blog/index.php?pk=25780&T=2

Globally Unique Identifier (entire table): ba.freestatistics.org/blog/index.php?pk=25780&T=2

As an alternative you can also use a QR Code:  

The GUIDs for individual cells are displayed in the table below:

Multiple Linear Regression - Ordinary Least Squares
VariableParameterS.D.T-STATH0: parameter = 02-tail p-value1-tail p-value
(Intercept)28.603160424041532.9578180.86790.3898740.194937
indexcijfer_industr_grondstoffen0.6138485891284950.3131351.96030.05590.02795
M1-9.9156384293387219.149104-0.51780.6070180.303509
M2-4.1080771798845720.127389-0.20410.8391540.419577
M3-5.5795619436549420.065291-0.27810.7821780.391089
M4-9.228334498230520.396-0.45250.6530210.32651
M5-8.7557997437745220.571324-0.42560.6723190.33616
M6-2.5987110457534020.784164-0.1250.9010310.450515
M71.1674855393979921.0278330.05550.9559590.477979
M86.196799509280820.9014970.29650.7681730.384086
M914.470589872847420.3270710.71190.4800530.240027
M1018.118544833777820.3788650.88910.3784850.189243
M119.7759036488233220.0336340.4880.6278370.313918
t2.186744061772160.8571082.55130.0140460.007023


Multiple Linear Regression - Regression Statistics
Multiple R0.928902481768124
R-squared0.86285982063498
Adjusted R-squared0.824927430597848
F-TEST (value)22.7473096156162
F-TEST (DF numerator)13
F-TEST (DF denominator)47
p-value5.55111512312578e-16
Multiple Linear Regression - Residual Statistics
Residual Standard Deviation31.5050895272108
Sum Squared Residuals46650.8213075257

\begin{tabular}{lllllllll}
\hline
Multiple Linear Regression - Regression Statistics \tabularnewline
Multiple R & 0.928902481768124 \tabularnewline
R-squared & 0.86285982063498 \tabularnewline
Adjusted R-squared & 0.824927430597848 \tabularnewline
F-TEST (value) & 22.7473096156162 \tabularnewline
F-TEST (DF numerator) & 13 \tabularnewline
F-TEST (DF denominator) & 47 \tabularnewline
p-value & 5.55111512312578e-16 \tabularnewline
Multiple Linear Regression - Residual Statistics \tabularnewline
Residual Standard Deviation & 31.5050895272108 \tabularnewline
Sum Squared Residuals & 46650.8213075257 \tabularnewline
\hline
\end{tabular}
%Source: https://freestatistics.org/blog/index.php?pk=25780&T=3

[TABLE]
[ROW][C]Multiple Linear Regression - Regression Statistics[/C][/ROW]
[ROW][C]Multiple R[/C][C]0.928902481768124[/C][/ROW]
[ROW][C]R-squared[/C][C]0.86285982063498[/C][/ROW]
[ROW][C]Adjusted R-squared[/C][C]0.824927430597848[/C][/ROW]
[ROW][C]F-TEST (value)[/C][C]22.7473096156162[/C][/ROW]
[ROW][C]F-TEST (DF numerator)[/C][C]13[/C][/ROW]
[ROW][C]F-TEST (DF denominator)[/C][C]47[/C][/ROW]
[ROW][C]p-value[/C][C]5.55111512312578e-16[/C][/ROW]
[ROW][C]Multiple Linear Regression - Residual Statistics[/C][/ROW]
[ROW][C]Residual Standard Deviation[/C][C]31.5050895272108[/C][/ROW]
[ROW][C]Sum Squared Residuals[/C][C]46650.8213075257[/C][/ROW]
[/TABLE]
Source: https://freestatistics.org/blog/index.php?pk=25780&T=3

Globally Unique Identifier (entire table): ba.freestatistics.org/blog/index.php?pk=25780&T=3

As an alternative you can also use a QR Code:  

The GUIDs for individual cells are displayed in the table below:

Multiple Linear Regression - Regression Statistics
Multiple R0.928902481768124
R-squared0.86285982063498
Adjusted R-squared0.824927430597848
F-TEST (value)22.7473096156162
F-TEST (DF numerator)13
F-TEST (DF denominator)47
p-value5.55111512312578e-16
Multiple Linear Regression - Residual Statistics
Residual Standard Deviation31.5050895272108
Sum Squared Residuals46650.8213075257


Multiple Linear Regression - Actuals, Interpolation, and Residuals
Time or IndexActualsInterpolationForecastResidualsPrediction Error
1105.487.845147130393817.5548528696062
2107.197.25130419661579.84869580338425
3110.799.623954685264411.0760453147356
4117.1102.88856032875014.2114396712496
5118.7109.1081609619249.5918390380762
6126.5118.8638454767137.63615452328737
7127.5123.6504738042923.84952619570795
8134.6128.1042131848696.49578681513122
9131.8138.871671904772-7.07167190477182
10135.9146.793456130511-10.8934561305113
11142.7140.7603287251551.93967127484537
12141.7133.6622480094068.03775199059373
13153.4127.77489940922525.6251005907748
14145138.0404445002276.95955549977308
15137.7138.080470350187-0.380470350187385
16148.3143.0638520432335.23614795676683
17152.2147.4419069090214.75809309097889
18169.4157.99559458967711.4044054103230
19168.6162.5980683405186.00193165948218
20161.1165.333031671535-4.23303167153478
21174.1174.258944624052-0.158944624052340
22179180.646107376971-1.64610737697053
23190.6178.05053207073312.5494679292665
24190171.87322423867818.1267757613222
25181.6164.51263902458817.0873609754116
26174.8174.1029506675490.69704933245124
27180.5178.7468409359731.75315906402706
28196.8183.42329833445413.3767016655455
29193.8189.0290503784994.7709496215006
30197198.109501445247-1.10950144524688
31216.3212.6563223399693.64367766003065
32221.4230.921654975937-9.52165497593724
33217.9234.998164074340-17.0981640743397
34229.7246.60303983485-16.9030398348501
35227.4240.447142711668-13.0471427116677
36204.2231.139207075057-26.9392070750568
37196.6226.663710229871-30.0637102298713
38198.8234.412476105446-35.6124761054462
39207.5237.583129759962-30.0831297599620
40190.7236.428025561723-45.7280255617228
41201.6241.481313875552-39.8813138755521
42210.5255.288399078589-44.7883990785889
43223.5270.01937455005-46.51937455005
44223.8277.665126594095-53.8651265940949
45231.2282.416869140539-51.2168691405387
46244289.847574494975-45.8475744949753
47234.7277.491806621595-42.7918066215952
48250.2269.59572273998-19.3957227399798
49265.7265.3657653304460.334234669554334
50287.6269.49282453016218.1071754698376
51283.3265.66560426861317.6343957313867
52295.4282.49626373183912.9037362681609
53312.3291.53956787500420.7604321249964
54333.8306.94265940977526.8573405902254
55347.7314.67576096517133.0242390348292
56383.2322.07597357356461.1240264264357
57407.1331.55435025629775.5456497437025
58413.6338.30982216269375.2901778373072
59362.7321.35018987084941.3498101291510
60321.9301.72959793687920.1704020631207
61239.4269.937838875476-30.5378388754757

\begin{tabular}{lllllllll}
\hline
Multiple Linear Regression - Actuals, Interpolation, and Residuals \tabularnewline
Time or Index & Actuals & InterpolationForecast & ResidualsPrediction Error \tabularnewline
1 & 105.4 & 87.8451471303938 & 17.5548528696062 \tabularnewline
2 & 107.1 & 97.2513041966157 & 9.84869580338425 \tabularnewline
3 & 110.7 & 99.6239546852644 & 11.0760453147356 \tabularnewline
4 & 117.1 & 102.888560328750 & 14.2114396712496 \tabularnewline
5 & 118.7 & 109.108160961924 & 9.5918390380762 \tabularnewline
6 & 126.5 & 118.863845476713 & 7.63615452328737 \tabularnewline
7 & 127.5 & 123.650473804292 & 3.84952619570795 \tabularnewline
8 & 134.6 & 128.104213184869 & 6.49578681513122 \tabularnewline
9 & 131.8 & 138.871671904772 & -7.07167190477182 \tabularnewline
10 & 135.9 & 146.793456130511 & -10.8934561305113 \tabularnewline
11 & 142.7 & 140.760328725155 & 1.93967127484537 \tabularnewline
12 & 141.7 & 133.662248009406 & 8.03775199059373 \tabularnewline
13 & 153.4 & 127.774899409225 & 25.6251005907748 \tabularnewline
14 & 145 & 138.040444500227 & 6.95955549977308 \tabularnewline
15 & 137.7 & 138.080470350187 & -0.380470350187385 \tabularnewline
16 & 148.3 & 143.063852043233 & 5.23614795676683 \tabularnewline
17 & 152.2 & 147.441906909021 & 4.75809309097889 \tabularnewline
18 & 169.4 & 157.995594589677 & 11.4044054103230 \tabularnewline
19 & 168.6 & 162.598068340518 & 6.00193165948218 \tabularnewline
20 & 161.1 & 165.333031671535 & -4.23303167153478 \tabularnewline
21 & 174.1 & 174.258944624052 & -0.158944624052340 \tabularnewline
22 & 179 & 180.646107376971 & -1.64610737697053 \tabularnewline
23 & 190.6 & 178.050532070733 & 12.5494679292665 \tabularnewline
24 & 190 & 171.873224238678 & 18.1267757613222 \tabularnewline
25 & 181.6 & 164.512639024588 & 17.0873609754116 \tabularnewline
26 & 174.8 & 174.102950667549 & 0.69704933245124 \tabularnewline
27 & 180.5 & 178.746840935973 & 1.75315906402706 \tabularnewline
28 & 196.8 & 183.423298334454 & 13.3767016655455 \tabularnewline
29 & 193.8 & 189.029050378499 & 4.7709496215006 \tabularnewline
30 & 197 & 198.109501445247 & -1.10950144524688 \tabularnewline
31 & 216.3 & 212.656322339969 & 3.64367766003065 \tabularnewline
32 & 221.4 & 230.921654975937 & -9.52165497593724 \tabularnewline
33 & 217.9 & 234.998164074340 & -17.0981640743397 \tabularnewline
34 & 229.7 & 246.60303983485 & -16.9030398348501 \tabularnewline
35 & 227.4 & 240.447142711668 & -13.0471427116677 \tabularnewline
36 & 204.2 & 231.139207075057 & -26.9392070750568 \tabularnewline
37 & 196.6 & 226.663710229871 & -30.0637102298713 \tabularnewline
38 & 198.8 & 234.412476105446 & -35.6124761054462 \tabularnewline
39 & 207.5 & 237.583129759962 & -30.0831297599620 \tabularnewline
40 & 190.7 & 236.428025561723 & -45.7280255617228 \tabularnewline
41 & 201.6 & 241.481313875552 & -39.8813138755521 \tabularnewline
42 & 210.5 & 255.288399078589 & -44.7883990785889 \tabularnewline
43 & 223.5 & 270.01937455005 & -46.51937455005 \tabularnewline
44 & 223.8 & 277.665126594095 & -53.8651265940949 \tabularnewline
45 & 231.2 & 282.416869140539 & -51.2168691405387 \tabularnewline
46 & 244 & 289.847574494975 & -45.8475744949753 \tabularnewline
47 & 234.7 & 277.491806621595 & -42.7918066215952 \tabularnewline
48 & 250.2 & 269.59572273998 & -19.3957227399798 \tabularnewline
49 & 265.7 & 265.365765330446 & 0.334234669554334 \tabularnewline
50 & 287.6 & 269.492824530162 & 18.1071754698376 \tabularnewline
51 & 283.3 & 265.665604268613 & 17.6343957313867 \tabularnewline
52 & 295.4 & 282.496263731839 & 12.9037362681609 \tabularnewline
53 & 312.3 & 291.539567875004 & 20.7604321249964 \tabularnewline
54 & 333.8 & 306.942659409775 & 26.8573405902254 \tabularnewline
55 & 347.7 & 314.675760965171 & 33.0242390348292 \tabularnewline
56 & 383.2 & 322.075973573564 & 61.1240264264357 \tabularnewline
57 & 407.1 & 331.554350256297 & 75.5456497437025 \tabularnewline
58 & 413.6 & 338.309822162693 & 75.2901778373072 \tabularnewline
59 & 362.7 & 321.350189870849 & 41.3498101291510 \tabularnewline
60 & 321.9 & 301.729597936879 & 20.1704020631207 \tabularnewline
61 & 239.4 & 269.937838875476 & -30.5378388754757 \tabularnewline
\hline
\end{tabular}
%Source: https://freestatistics.org/blog/index.php?pk=25780&T=4

[TABLE]
[ROW][C]Multiple Linear Regression - Actuals, Interpolation, and Residuals[/C][/ROW]
[ROW][C]Time or Index[/C][C]Actuals[/C][C]InterpolationForecast[/C][C]ResidualsPrediction Error[/C][/ROW]
[ROW][C]1[/C][C]105.4[/C][C]87.8451471303938[/C][C]17.5548528696062[/C][/ROW]
[ROW][C]2[/C][C]107.1[/C][C]97.2513041966157[/C][C]9.84869580338425[/C][/ROW]
[ROW][C]3[/C][C]110.7[/C][C]99.6239546852644[/C][C]11.0760453147356[/C][/ROW]
[ROW][C]4[/C][C]117.1[/C][C]102.888560328750[/C][C]14.2114396712496[/C][/ROW]
[ROW][C]5[/C][C]118.7[/C][C]109.108160961924[/C][C]9.5918390380762[/C][/ROW]
[ROW][C]6[/C][C]126.5[/C][C]118.863845476713[/C][C]7.63615452328737[/C][/ROW]
[ROW][C]7[/C][C]127.5[/C][C]123.650473804292[/C][C]3.84952619570795[/C][/ROW]
[ROW][C]8[/C][C]134.6[/C][C]128.104213184869[/C][C]6.49578681513122[/C][/ROW]
[ROW][C]9[/C][C]131.8[/C][C]138.871671904772[/C][C]-7.07167190477182[/C][/ROW]
[ROW][C]10[/C][C]135.9[/C][C]146.793456130511[/C][C]-10.8934561305113[/C][/ROW]
[ROW][C]11[/C][C]142.7[/C][C]140.760328725155[/C][C]1.93967127484537[/C][/ROW]
[ROW][C]12[/C][C]141.7[/C][C]133.662248009406[/C][C]8.03775199059373[/C][/ROW]
[ROW][C]13[/C][C]153.4[/C][C]127.774899409225[/C][C]25.6251005907748[/C][/ROW]
[ROW][C]14[/C][C]145[/C][C]138.040444500227[/C][C]6.95955549977308[/C][/ROW]
[ROW][C]15[/C][C]137.7[/C][C]138.080470350187[/C][C]-0.380470350187385[/C][/ROW]
[ROW][C]16[/C][C]148.3[/C][C]143.063852043233[/C][C]5.23614795676683[/C][/ROW]
[ROW][C]17[/C][C]152.2[/C][C]147.441906909021[/C][C]4.75809309097889[/C][/ROW]
[ROW][C]18[/C][C]169.4[/C][C]157.995594589677[/C][C]11.4044054103230[/C][/ROW]
[ROW][C]19[/C][C]168.6[/C][C]162.598068340518[/C][C]6.00193165948218[/C][/ROW]
[ROW][C]20[/C][C]161.1[/C][C]165.333031671535[/C][C]-4.23303167153478[/C][/ROW]
[ROW][C]21[/C][C]174.1[/C][C]174.258944624052[/C][C]-0.158944624052340[/C][/ROW]
[ROW][C]22[/C][C]179[/C][C]180.646107376971[/C][C]-1.64610737697053[/C][/ROW]
[ROW][C]23[/C][C]190.6[/C][C]178.050532070733[/C][C]12.5494679292665[/C][/ROW]
[ROW][C]24[/C][C]190[/C][C]171.873224238678[/C][C]18.1267757613222[/C][/ROW]
[ROW][C]25[/C][C]181.6[/C][C]164.512639024588[/C][C]17.0873609754116[/C][/ROW]
[ROW][C]26[/C][C]174.8[/C][C]174.102950667549[/C][C]0.69704933245124[/C][/ROW]
[ROW][C]27[/C][C]180.5[/C][C]178.746840935973[/C][C]1.75315906402706[/C][/ROW]
[ROW][C]28[/C][C]196.8[/C][C]183.423298334454[/C][C]13.3767016655455[/C][/ROW]
[ROW][C]29[/C][C]193.8[/C][C]189.029050378499[/C][C]4.7709496215006[/C][/ROW]
[ROW][C]30[/C][C]197[/C][C]198.109501445247[/C][C]-1.10950144524688[/C][/ROW]
[ROW][C]31[/C][C]216.3[/C][C]212.656322339969[/C][C]3.64367766003065[/C][/ROW]
[ROW][C]32[/C][C]221.4[/C][C]230.921654975937[/C][C]-9.52165497593724[/C][/ROW]
[ROW][C]33[/C][C]217.9[/C][C]234.998164074340[/C][C]-17.0981640743397[/C][/ROW]
[ROW][C]34[/C][C]229.7[/C][C]246.60303983485[/C][C]-16.9030398348501[/C][/ROW]
[ROW][C]35[/C][C]227.4[/C][C]240.447142711668[/C][C]-13.0471427116677[/C][/ROW]
[ROW][C]36[/C][C]204.2[/C][C]231.139207075057[/C][C]-26.9392070750568[/C][/ROW]
[ROW][C]37[/C][C]196.6[/C][C]226.663710229871[/C][C]-30.0637102298713[/C][/ROW]
[ROW][C]38[/C][C]198.8[/C][C]234.412476105446[/C][C]-35.6124761054462[/C][/ROW]
[ROW][C]39[/C][C]207.5[/C][C]237.583129759962[/C][C]-30.0831297599620[/C][/ROW]
[ROW][C]40[/C][C]190.7[/C][C]236.428025561723[/C][C]-45.7280255617228[/C][/ROW]
[ROW][C]41[/C][C]201.6[/C][C]241.481313875552[/C][C]-39.8813138755521[/C][/ROW]
[ROW][C]42[/C][C]210.5[/C][C]255.288399078589[/C][C]-44.7883990785889[/C][/ROW]
[ROW][C]43[/C][C]223.5[/C][C]270.01937455005[/C][C]-46.51937455005[/C][/ROW]
[ROW][C]44[/C][C]223.8[/C][C]277.665126594095[/C][C]-53.8651265940949[/C][/ROW]
[ROW][C]45[/C][C]231.2[/C][C]282.416869140539[/C][C]-51.2168691405387[/C][/ROW]
[ROW][C]46[/C][C]244[/C][C]289.847574494975[/C][C]-45.8475744949753[/C][/ROW]
[ROW][C]47[/C][C]234.7[/C][C]277.491806621595[/C][C]-42.7918066215952[/C][/ROW]
[ROW][C]48[/C][C]250.2[/C][C]269.59572273998[/C][C]-19.3957227399798[/C][/ROW]
[ROW][C]49[/C][C]265.7[/C][C]265.365765330446[/C][C]0.334234669554334[/C][/ROW]
[ROW][C]50[/C][C]287.6[/C][C]269.492824530162[/C][C]18.1071754698376[/C][/ROW]
[ROW][C]51[/C][C]283.3[/C][C]265.665604268613[/C][C]17.6343957313867[/C][/ROW]
[ROW][C]52[/C][C]295.4[/C][C]282.496263731839[/C][C]12.9037362681609[/C][/ROW]
[ROW][C]53[/C][C]312.3[/C][C]291.539567875004[/C][C]20.7604321249964[/C][/ROW]
[ROW][C]54[/C][C]333.8[/C][C]306.942659409775[/C][C]26.8573405902254[/C][/ROW]
[ROW][C]55[/C][C]347.7[/C][C]314.675760965171[/C][C]33.0242390348292[/C][/ROW]
[ROW][C]56[/C][C]383.2[/C][C]322.075973573564[/C][C]61.1240264264357[/C][/ROW]
[ROW][C]57[/C][C]407.1[/C][C]331.554350256297[/C][C]75.5456497437025[/C][/ROW]
[ROW][C]58[/C][C]413.6[/C][C]338.309822162693[/C][C]75.2901778373072[/C][/ROW]
[ROW][C]59[/C][C]362.7[/C][C]321.350189870849[/C][C]41.3498101291510[/C][/ROW]
[ROW][C]60[/C][C]321.9[/C][C]301.729597936879[/C][C]20.1704020631207[/C][/ROW]
[ROW][C]61[/C][C]239.4[/C][C]269.937838875476[/C][C]-30.5378388754757[/C][/ROW]
[/TABLE]
Source: https://freestatistics.org/blog/index.php?pk=25780&T=4

Globally Unique Identifier (entire table): ba.freestatistics.org/blog/index.php?pk=25780&T=4

As an alternative you can also use a QR Code:  

The GUIDs for individual cells are displayed in the table below:

Multiple Linear Regression - Actuals, Interpolation, and Residuals
Time or IndexActualsInterpolationForecastResidualsPrediction Error
1105.487.845147130393817.5548528696062
2107.197.25130419661579.84869580338425
3110.799.623954685264411.0760453147356
4117.1102.88856032875014.2114396712496
5118.7109.1081609619249.5918390380762
6126.5118.8638454767137.63615452328737
7127.5123.6504738042923.84952619570795
8134.6128.1042131848696.49578681513122
9131.8138.871671904772-7.07167190477182
10135.9146.793456130511-10.8934561305113
11142.7140.7603287251551.93967127484537
12141.7133.6622480094068.03775199059373
13153.4127.77489940922525.6251005907748
14145138.0404445002276.95955549977308
15137.7138.080470350187-0.380470350187385
16148.3143.0638520432335.23614795676683
17152.2147.4419069090214.75809309097889
18169.4157.99559458967711.4044054103230
19168.6162.5980683405186.00193165948218
20161.1165.333031671535-4.23303167153478
21174.1174.258944624052-0.158944624052340
22179180.646107376971-1.64610737697053
23190.6178.05053207073312.5494679292665
24190171.87322423867818.1267757613222
25181.6164.51263902458817.0873609754116
26174.8174.1029506675490.69704933245124
27180.5178.7468409359731.75315906402706
28196.8183.42329833445413.3767016655455
29193.8189.0290503784994.7709496215006
30197198.109501445247-1.10950144524688
31216.3212.6563223399693.64367766003065
32221.4230.921654975937-9.52165497593724
33217.9234.998164074340-17.0981640743397
34229.7246.60303983485-16.9030398348501
35227.4240.447142711668-13.0471427116677
36204.2231.139207075057-26.9392070750568
37196.6226.663710229871-30.0637102298713
38198.8234.412476105446-35.6124761054462
39207.5237.583129759962-30.0831297599620
40190.7236.428025561723-45.7280255617228
41201.6241.481313875552-39.8813138755521
42210.5255.288399078589-44.7883990785889
43223.5270.01937455005-46.51937455005
44223.8277.665126594095-53.8651265940949
45231.2282.416869140539-51.2168691405387
46244289.847574494975-45.8475744949753
47234.7277.491806621595-42.7918066215952
48250.2269.59572273998-19.3957227399798
49265.7265.3657653304460.334234669554334
50287.6269.49282453016218.1071754698376
51283.3265.66560426861317.6343957313867
52295.4282.49626373183912.9037362681609
53312.3291.53956787500420.7604321249964
54333.8306.94265940977526.8573405902254
55347.7314.67576096517133.0242390348292
56383.2322.07597357356461.1240264264357
57407.1331.55435025629775.5456497437025
58413.6338.30982216269375.2901778373072
59362.7321.35018987084941.3498101291510
60321.9301.72959793687920.1704020631207
61239.4269.937838875476-30.5378388754757


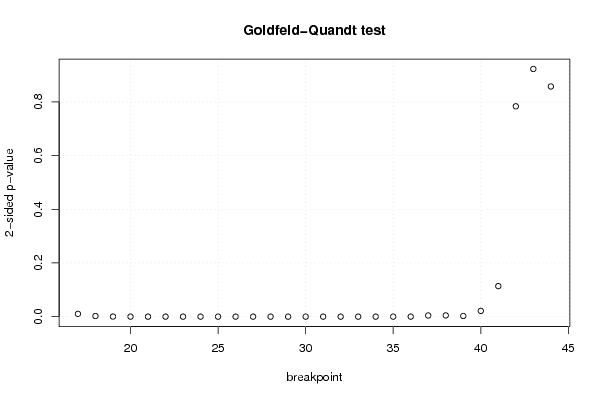
Goldfeld-Quandt test for Heteroskedasticity
p-valuesAlternative Hypothesis
breakpoint indexgreater2-sidedless
170.00519076923135370.01038153846270740.994809230768646
180.001142260872198280.002284521744396560.998857739127802
190.0001906249480413610.0003812498960827220.999809375051959
202.70235227881552e-055.40470455763104e-050.999972976477212
211.19124389000211e-052.38248778000421e-050.9999880875611
222.08652895471236e-064.17305790942473e-060.999997913471045
236.19333239308848e-071.23866647861770e-060.99999938066676
242.11642467713562e-074.23284935427124e-070.999999788357532
257.29114405679078e-081.45822881135816e-070.99999992708856
262.30454429736844e-084.60908859473688e-080.999999976954557
273.9747525883582e-097.9495051767164e-090.999999996025247
281.98450848333520e-093.96901696667041e-090.999999998015492
295.46777540508333e-101.09355508101667e-090.999999999453222
304.54001606226605e-109.0800321245321e-100.999999999545998
319.78292855875066e-101.95658571175013e-090.999999999021707
326.63917070037311e-101.32783414007462e-090.999999999336083
339.0249954260305e-101.8049990852061e-090.9999999990975
341.79012231676239e-093.58024463352479e-090.999999998209878
355.12076498740364e-081.02415299748073e-070.99999994879235
364.70582224234419e-059.41164448468838e-050.999952941777577
370.002157026198652590.004314052397305180.997842973801347
380.002273770622570200.004547541245140400.99772622937743
390.001297527968033520.002595055936067040.998702472031966
400.01077022619859970.02154045239719930.9892297738014
410.05689428822664990.1137885764533000.94310571177335
420.3919704234816140.7839408469632280.608029576518386
430.4615791947226590.9231583894453170.538420805277341
440.4289374751956730.8578749503913470.571062524804327

\begin{tabular}{lllllllll}
\hline
Goldfeld-Quandt test for Heteroskedasticity \tabularnewline
p-values & Alternative Hypothesis \tabularnewline
breakpoint index & greater & 2-sided & less \tabularnewline
17 & 0.0051907692313537 & 0.0103815384627074 & 0.994809230768646 \tabularnewline
18 & 0.00114226087219828 & 0.00228452174439656 & 0.998857739127802 \tabularnewline
19 & 0.000190624948041361 & 0.000381249896082722 & 0.999809375051959 \tabularnewline
20 & 2.70235227881552e-05 & 5.40470455763104e-05 & 0.999972976477212 \tabularnewline
21 & 1.19124389000211e-05 & 2.38248778000421e-05 & 0.9999880875611 \tabularnewline
22 & 2.08652895471236e-06 & 4.17305790942473e-06 & 0.999997913471045 \tabularnewline
23 & 6.19333239308848e-07 & 1.23866647861770e-06 & 0.99999938066676 \tabularnewline
24 & 2.11642467713562e-07 & 4.23284935427124e-07 & 0.999999788357532 \tabularnewline
25 & 7.29114405679078e-08 & 1.45822881135816e-07 & 0.99999992708856 \tabularnewline
26 & 2.30454429736844e-08 & 4.60908859473688e-08 & 0.999999976954557 \tabularnewline
27 & 3.9747525883582e-09 & 7.9495051767164e-09 & 0.999999996025247 \tabularnewline
28 & 1.98450848333520e-09 & 3.96901696667041e-09 & 0.999999998015492 \tabularnewline
29 & 5.46777540508333e-10 & 1.09355508101667e-09 & 0.999999999453222 \tabularnewline
30 & 4.54001606226605e-10 & 9.0800321245321e-10 & 0.999999999545998 \tabularnewline
31 & 9.78292855875066e-10 & 1.95658571175013e-09 & 0.999999999021707 \tabularnewline
32 & 6.63917070037311e-10 & 1.32783414007462e-09 & 0.999999999336083 \tabularnewline
33 & 9.0249954260305e-10 & 1.8049990852061e-09 & 0.9999999990975 \tabularnewline
34 & 1.79012231676239e-09 & 3.58024463352479e-09 & 0.999999998209878 \tabularnewline
35 & 5.12076498740364e-08 & 1.02415299748073e-07 & 0.99999994879235 \tabularnewline
36 & 4.70582224234419e-05 & 9.41164448468838e-05 & 0.999952941777577 \tabularnewline
37 & 0.00215702619865259 & 0.00431405239730518 & 0.997842973801347 \tabularnewline
38 & 0.00227377062257020 & 0.00454754124514040 & 0.99772622937743 \tabularnewline
39 & 0.00129752796803352 & 0.00259505593606704 & 0.998702472031966 \tabularnewline
40 & 0.0107702261985997 & 0.0215404523971993 & 0.9892297738014 \tabularnewline
41 & 0.0568942882266499 & 0.113788576453300 & 0.94310571177335 \tabularnewline
42 & 0.391970423481614 & 0.783940846963228 & 0.608029576518386 \tabularnewline
43 & 0.461579194722659 & 0.923158389445317 & 0.538420805277341 \tabularnewline
44 & 0.428937475195673 & 0.857874950391347 & 0.571062524804327 \tabularnewline
\hline
\end{tabular}
%Source: https://freestatistics.org/blog/index.php?pk=25780&T=5

[TABLE]
[ROW][C]Goldfeld-Quandt test for Heteroskedasticity[/C][/ROW]
[ROW][C]p-values[/C][C]Alternative Hypothesis[/C][/ROW]
[ROW][C]breakpoint index[/C][C]greater[/C][C]2-sided[/C][C]less[/C][/ROW]
[ROW][C]17[/C][C]0.0051907692313537[/C][C]0.0103815384627074[/C][C]0.994809230768646[/C][/ROW]
[ROW][C]18[/C][C]0.00114226087219828[/C][C]0.00228452174439656[/C][C]0.998857739127802[/C][/ROW]
[ROW][C]19[/C][C]0.000190624948041361[/C][C]0.000381249896082722[/C][C]0.999809375051959[/C][/ROW]
[ROW][C]20[/C][C]2.70235227881552e-05[/C][C]5.40470455763104e-05[/C][C]0.999972976477212[/C][/ROW]
[ROW][C]21[/C][C]1.19124389000211e-05[/C][C]2.38248778000421e-05[/C][C]0.9999880875611[/C][/ROW]
[ROW][C]22[/C][C]2.08652895471236e-06[/C][C]4.17305790942473e-06[/C][C]0.999997913471045[/C][/ROW]
[ROW][C]23[/C][C]6.19333239308848e-07[/C][C]1.23866647861770e-06[/C][C]0.99999938066676[/C][/ROW]
[ROW][C]24[/C][C]2.11642467713562e-07[/C][C]4.23284935427124e-07[/C][C]0.999999788357532[/C][/ROW]
[ROW][C]25[/C][C]7.29114405679078e-08[/C][C]1.45822881135816e-07[/C][C]0.99999992708856[/C][/ROW]
[ROW][C]26[/C][C]2.30454429736844e-08[/C][C]4.60908859473688e-08[/C][C]0.999999976954557[/C][/ROW]
[ROW][C]27[/C][C]3.9747525883582e-09[/C][C]7.9495051767164e-09[/C][C]0.999999996025247[/C][/ROW]
[ROW][C]28[/C][C]1.98450848333520e-09[/C][C]3.96901696667041e-09[/C][C]0.999999998015492[/C][/ROW]
[ROW][C]29[/C][C]5.46777540508333e-10[/C][C]1.09355508101667e-09[/C][C]0.999999999453222[/C][/ROW]
[ROW][C]30[/C][C]4.54001606226605e-10[/C][C]9.0800321245321e-10[/C][C]0.999999999545998[/C][/ROW]
[ROW][C]31[/C][C]9.78292855875066e-10[/C][C]1.95658571175013e-09[/C][C]0.999999999021707[/C][/ROW]
[ROW][C]32[/C][C]6.63917070037311e-10[/C][C]1.32783414007462e-09[/C][C]0.999999999336083[/C][/ROW]
[ROW][C]33[/C][C]9.0249954260305e-10[/C][C]1.8049990852061e-09[/C][C]0.9999999990975[/C][/ROW]
[ROW][C]34[/C][C]1.79012231676239e-09[/C][C]3.58024463352479e-09[/C][C]0.999999998209878[/C][/ROW]
[ROW][C]35[/C][C]5.12076498740364e-08[/C][C]1.02415299748073e-07[/C][C]0.99999994879235[/C][/ROW]
[ROW][C]36[/C][C]4.70582224234419e-05[/C][C]9.41164448468838e-05[/C][C]0.999952941777577[/C][/ROW]
[ROW][C]37[/C][C]0.00215702619865259[/C][C]0.00431405239730518[/C][C]0.997842973801347[/C][/ROW]
[ROW][C]38[/C][C]0.00227377062257020[/C][C]0.00454754124514040[/C][C]0.99772622937743[/C][/ROW]
[ROW][C]39[/C][C]0.00129752796803352[/C][C]0.00259505593606704[/C][C]0.998702472031966[/C][/ROW]
[ROW][C]40[/C][C]0.0107702261985997[/C][C]0.0215404523971993[/C][C]0.9892297738014[/C][/ROW]
[ROW][C]41[/C][C]0.0568942882266499[/C][C]0.113788576453300[/C][C]0.94310571177335[/C][/ROW]
[ROW][C]42[/C][C]0.391970423481614[/C][C]0.783940846963228[/C][C]0.608029576518386[/C][/ROW]
[ROW][C]43[/C][C]0.461579194722659[/C][C]0.923158389445317[/C][C]0.538420805277341[/C][/ROW]
[ROW][C]44[/C][C]0.428937475195673[/C][C]0.857874950391347[/C][C]0.571062524804327[/C][/ROW]
[/TABLE]
Source: https://freestatistics.org/blog/index.php?pk=25780&T=5

Globally Unique Identifier (entire table): ba.freestatistics.org/blog/index.php?pk=25780&T=5

As an alternative you can also use a QR Code:  

The GUIDs for individual cells are displayed in the table below:

Goldfeld-Quandt test for Heteroskedasticity
p-valuesAlternative Hypothesis
breakpoint indexgreater2-sidedless
170.00519076923135370.01038153846270740.994809230768646
180.001142260872198280.002284521744396560.998857739127802
190.0001906249480413610.0003812498960827220.999809375051959
202.70235227881552e-055.40470455763104e-050.999972976477212
211.19124389000211e-052.38248778000421e-050.9999880875611
222.08652895471236e-064.17305790942473e-060.999997913471045
236.19333239308848e-071.23866647861770e-060.99999938066676
242.11642467713562e-074.23284935427124e-070.999999788357532
257.29114405679078e-081.45822881135816e-070.99999992708856
262.30454429736844e-084.60908859473688e-080.999999976954557
273.9747525883582e-097.9495051767164e-090.999999996025247
281.98450848333520e-093.96901696667041e-090.999999998015492
295.46777540508333e-101.09355508101667e-090.999999999453222
304.54001606226605e-109.0800321245321e-100.999999999545998
319.78292855875066e-101.95658571175013e-090.999999999021707
326.63917070037311e-101.32783414007462e-090.999999999336083
339.0249954260305e-101.8049990852061e-090.9999999990975
341.79012231676239e-093.58024463352479e-090.999999998209878
355.12076498740364e-081.02415299748073e-070.99999994879235
364.70582224234419e-059.41164448468838e-050.999952941777577
370.002157026198652590.004314052397305180.997842973801347
380.002273770622570200.004547541245140400.99772622937743
390.001297527968033520.002595055936067040.998702472031966
400.01077022619859970.02154045239719930.9892297738014
410.05689428822664990.1137885764533000.94310571177335
420.3919704234816140.7839408469632280.608029576518386
430.4615791947226590.9231583894453170.538420805277341
440.4289374751956730.8578749503913470.571062524804327


Meta Analysis of Goldfeld-Quandt test for Heteroskedasticity
Description# significant tests% significant testsOK/NOK
1% type I error level220.785714285714286NOK
5% type I error level240.857142857142857NOK
10% type I error level240.857142857142857NOK

\begin{tabular}{lllllllll}
\hline
Meta Analysis of Goldfeld-Quandt test for Heteroskedasticity \tabularnewline
Description & # significant tests & % significant tests & OK/NOK \tabularnewline
1% type I error level & 22 & 0.785714285714286 & NOK \tabularnewline
5% type I error level & 24 & 0.857142857142857 & NOK \tabularnewline
10% type I error level & 24 & 0.857142857142857 & NOK \tabularnewline
\hline
\end{tabular}
%Source: https://freestatistics.org/blog/index.php?pk=25780&T=6

[TABLE]
[ROW][C]Meta Analysis of Goldfeld-Quandt test for Heteroskedasticity[/C][/ROW]
[ROW][C]Description[/C][C]# significant tests[/C][C]% significant tests[/C][C]OK/NOK[/C][/ROW]
[ROW][C]1% type I error level[/C][C]22[/C][C]0.785714285714286[/C][C]NOK[/C][/ROW]
[ROW][C]5% type I error level[/C][C]24[/C][C]0.857142857142857[/C][C]NOK[/C][/ROW]
[ROW][C]10% type I error level[/C][C]24[/C][C]0.857142857142857[/C][C]NOK[/C][/ROW]
[/TABLE]
Source: https://freestatistics.org/blog/index.php?pk=25780&T=6

Globally Unique Identifier (entire table): ba.freestatistics.org/blog/index.php?pk=25780&T=6

As an alternative you can also use a QR Code:  

The GUIDs for individual cells are displayed in the table below:

Meta Analysis of Goldfeld-Quandt test for Heteroskedasticity
Description# significant tests% significant testsOK/NOK
1% type I error level220.785714285714286NOK
5% type I error level240.857142857142857NOK
10% type I error level240.857142857142857NOK


Parameters (Session):
par1 = 1 ; par2 = Include Monthly Dummies ; par3 = Linear Trend ;
Parameters (R input):
par1 = 1 ; par2 = Include Monthly Dummies ; par3 = Linear Trend ;
R code (references can be found in the software module):
library(lattice)
library(lmtest)
n25 <- 25 #minimum number of obs. for Goldfeld-Quandt test
par1 <- as.numeric(par1)
x <- t(y)
k <- length(x[1,])
n <- length(x[,1])
x1 <- cbind(x[,par1], x[,1:k!=par1])
mycolnames <- c(colnames(x)[par1], colnames(x)[1:k!=par1])
colnames(x1) <- mycolnames #colnames(x)[par1]
x <- x1
if (par3 == 'First Differences'){
x2 <- array(0, dim=c(n-1,k), dimnames=list(1:(n-1), paste('(1-B)',colnames(x),sep='')))
for (i in 1:n-1) {
for (j in 1:k) {
x2[i,j] <- x[i+1,j] - x[i,j]
}
}
x <- x2
}
if (par2 == 'Include Monthly Dummies'){
x2 <- array(0, dim=c(n,11), dimnames=list(1:n, paste('M', seq(1:11), sep ='')))
for (i in 1:11){
x2[seq(i,n,12),i] <- 1
}
x <- cbind(x, x2)
}
if (par2 == 'Include Quarterly Dummies'){
x2 <- array(0, dim=c(n,3), dimnames=list(1:n, paste('Q', seq(1:3), sep ='')))
for (i in 1:3){
x2[seq(i,n,4),i] <- 1
}
x <- cbind(x, x2)
}
k <- length(x[1,])
if (par3 == 'Linear Trend'){
x <- cbind(x, c(1:n))
colnames(x)[k+1] <- 't'
}
x
k <- length(x[1,])
df <- as.data.frame(x)
(mylm <- lm(df))
(mysum <- summary(mylm))
if (n > n25) {
kp3 <- k + 3
nmkm3 <- n - k - 3
gqarr <- array(NA, dim=c(nmkm3-kp3+1,3))
numgqtests <- 0
numsignificant1 <- 0
numsignificant5 <- 0
numsignificant10 <- 0
for (mypoint in kp3:nmkm3) {
j <- 0
numgqtests <- numgqtests + 1
for (myalt in c('greater', 'two.sided', 'less')) {
j <- j + 1
gqarr[mypoint-kp3+1,j] <- gqtest(mylm, point=mypoint, alternative=myalt)$p.value
}
if (gqarr[mypoint-kp3+1,2] < 0.01) numsignificant1 <- numsignificant1 + 1
if (gqarr[mypoint-kp3+1,2] < 0.05) numsignificant5 <- numsignificant5 + 1
if (gqarr[mypoint-kp3+1,2] < 0.10) numsignificant10 <- numsignificant10 + 1
}
gqarr
}
bitmap(file='test0.png')
plot(x[,1], type='l', main='Actuals and Interpolation', ylab='value of Actuals and Interpolation (dots)', xlab='time or index')
points(x[,1]-mysum$resid)
grid()
dev.off()
bitmap(file='test1.png')
plot(mysum$resid, type='b', pch=19, main='Residuals', ylab='value of Residuals', xlab='time or index')
grid()
dev.off()
bitmap(file='test2.png')
hist(mysum$resid, main='Residual Histogram', xlab='values of Residuals')
grid()
dev.off()
bitmap(file='test3.png')
densityplot(~mysum$resid,col='black',main='Residual Density Plot', xlab='values of Residuals')
dev.off()
bitmap(file='test4.png')
qqnorm(mysum$resid, main='Residual Normal Q-Q Plot')
qqline(mysum$resid)
grid()
dev.off()
(myerror <- as.ts(mysum$resid))
bitmap(file='test5.png')
dum <- cbind(lag(myerror,k=1),myerror)
dum
dum1 <- dum[2:length(myerror),]
dum1
z <- as.data.frame(dum1)
z
plot(z,main=paste('Residual Lag plot, lowess, and regression line'), ylab='values of Residuals', xlab='lagged values of Residuals')
lines(lowess(z))
abline(lm(z))
grid()
dev.off()
bitmap(file='test6.png')
acf(mysum$resid, lag.max=length(mysum$resid)/2, main='Residual Autocorrelation Function')
grid()
dev.off()
bitmap(file='test7.png')
pacf(mysum$resid, lag.max=length(mysum$resid)/2, main='Residual Partial Autocorrelation Function')
grid()
dev.off()
bitmap(file='test8.png')
opar <- par(mfrow = c(2,2), oma = c(0, 0, 1.1, 0))
plot(mylm, las = 1, sub='Residual Diagnostics')
par(opar)
dev.off()
if (n > n25) {
bitmap(file='test9.png')
plot(kp3:nmkm3,gqarr[,2], main='Goldfeld-Quandt test',ylab='2-sided p-value',xlab='breakpoint')
grid()
dev.off()
}
load(file='createtable')
a<-table.start()
a<-table.row.start(a)
a<-table.element(a, 'Multiple Linear Regression - Estimated Regression Equation', 1, TRUE)
a<-table.row.end(a)
myeq <- colnames(x)[1]
myeq <- paste(myeq, '[t] = ', sep='')
for (i in 1:k){
if (mysum$coefficients[i,1] > 0) myeq <- paste(myeq, '+', '')
myeq <- paste(myeq, mysum$coefficients[i,1], sep=' ')
if (rownames(mysum$coefficients)[i] != '(Intercept)') {
myeq <- paste(myeq, rownames(mysum$coefficients)[i], sep='')
if (rownames(mysum$coefficients)[i] != 't') myeq <- paste(myeq, '[t]', sep='')
}
}
myeq <- paste(myeq, ' + e[t]')
a<-table.row.start(a)
a<-table.element(a, myeq)
a<-table.row.end(a)
a<-table.end(a)
table.save(a,file='mytable1.tab')
a<-table.start()
a<-table.row.start(a)
a<-table.element(a,hyperlink('ols1.htm','Multiple Linear Regression - Ordinary Least Squares',''), 6, TRUE)
a<-table.row.end(a)
a<-table.row.start(a)
a<-table.element(a,'Variable',header=TRUE)
a<-table.element(a,'Parameter',header=TRUE)
a<-table.element(a,'S.D.',header=TRUE)
a<-table.element(a,'T-STAT
H0: parameter = 0',header=TRUE)
a<-table.element(a,'2-tail p-value',header=TRUE)
a<-table.element(a,'1-tail p-value',header=TRUE)
a<-table.row.end(a)
for (i in 1:k){
a<-table.row.start(a)
a<-table.element(a,rownames(mysum$coefficients)[i],header=TRUE)
a<-table.element(a,mysum$coefficients[i,1])
a<-table.element(a, round(mysum$coefficients[i,2],6))
a<-table.element(a, round(mysum$coefficients[i,3],4))
a<-table.element(a, round(mysum$coefficients[i,4],6))
a<-table.element(a, round(mysum$coefficients[i,4]/2,6))
a<-table.row.end(a)
}
a<-table.end(a)
table.save(a,file='mytable2.tab')
a<-table.start()
a<-table.row.start(a)
a<-table.element(a, 'Multiple Linear Regression - Regression Statistics', 2, TRUE)
a<-table.row.end(a)
a<-table.row.start(a)
a<-table.element(a, 'Multiple R',1,TRUE)
a<-table.element(a, sqrt(mysum$r.squared))
a<-table.row.end(a)
a<-table.row.start(a)
a<-table.element(a, 'R-squared',1,TRUE)
a<-table.element(a, mysum$r.squared)
a<-table.row.end(a)
a<-table.row.start(a)
a<-table.element(a, 'Adjusted R-squared',1,TRUE)
a<-table.element(a, mysum$adj.r.squared)
a<-table.row.end(a)
a<-table.row.start(a)
a<-table.element(a, 'F-TEST (value)',1,TRUE)
a<-table.element(a, mysum$fstatistic[1])
a<-table.row.end(a)
a<-table.row.start(a)
a<-table.element(a, 'F-TEST (DF numerator)',1,TRUE)
a<-table.element(a, mysum$fstatistic[2])
a<-table.row.end(a)
a<-table.row.start(a)
a<-table.element(a, 'F-TEST (DF denominator)',1,TRUE)
a<-table.element(a, mysum$fstatistic[3])
a<-table.row.end(a)
a<-table.row.start(a)
a<-table.element(a, 'p-value',1,TRUE)
a<-table.element(a, 1-pf(mysum$fstatistic[1],mysum$fstatistic[2],mysum$fstatistic[3]))
a<-table.row.end(a)
a<-table.row.start(a)
a<-table.element(a, 'Multiple Linear Regression - Residual Statistics', 2, TRUE)
a<-table.row.end(a)
a<-table.row.start(a)
a<-table.element(a, 'Residual Standard Deviation',1,TRUE)
a<-table.element(a, mysum$sigma)
a<-table.row.end(a)
a<-table.row.start(a)
a<-table.element(a, 'Sum Squared Residuals',1,TRUE)
a<-table.element(a, sum(myerror*myerror))
a<-table.row.end(a)
a<-table.end(a)
table.save(a,file='mytable3.tab')
a<-table.start()
a<-table.row.start(a)
a<-table.element(a, 'Multiple Linear Regression - Actuals, Interpolation, and Residuals', 4, TRUE)
a<-table.row.end(a)
a<-table.row.start(a)
a<-table.element(a, 'Time or Index', 1, TRUE)
a<-table.element(a, 'Actuals', 1, TRUE)
a<-table.element(a, 'Interpolation
Forecast', 1, TRUE)
a<-table.element(a, 'Residuals
Prediction Error', 1, TRUE)
a<-table.row.end(a)
for (i in 1:n) {
a<-table.row.start(a)
a<-table.element(a,i, 1, TRUE)
a<-table.element(a,x[i])
a<-table.element(a,x[i]-mysum$resid[i])
a<-table.element(a,mysum$resid[i])
a<-table.row.end(a)
}
a<-table.end(a)
table.save(a,file='mytable4.tab')
if (n > n25) {
a<-table.start()
a<-table.row.start(a)
a<-table.element(a,'Goldfeld-Quandt test for Heteroskedasticity',4,TRUE)
a<-table.row.end(a)
a<-table.row.start(a)
a<-table.element(a,'p-values',header=TRUE)
a<-table.element(a,'Alternative Hypothesis',3,header=TRUE)
a<-table.row.end(a)
a<-table.row.start(a)
a<-table.element(a,'breakpoint index',header=TRUE)
a<-table.element(a,'greater',header=TRUE)
a<-table.element(a,'2-sided',header=TRUE)
a<-table.element(a,'less',header=TRUE)
a<-table.row.end(a)
for (mypoint in kp3:nmkm3) {
a<-table.row.start(a)
a<-table.element(a,mypoint,header=TRUE)
a<-table.element(a,gqarr[mypoint-kp3+1,1])
a<-table.element(a,gqarr[mypoint-kp3+1,2])
a<-table.element(a,gqarr[mypoint-kp3+1,3])
a<-table.row.end(a)
}
a<-table.end(a)
table.save(a,file='mytable5.tab')
a<-table.start()
a<-table.row.start(a)
a<-table.element(a,'Meta Analysis of Goldfeld-Quandt test for Heteroskedasticity',4,TRUE)
a<-table.row.end(a)
a<-table.row.start(a)
a<-table.element(a,'Description',header=TRUE)
a<-table.element(a,'# significant tests',header=TRUE)
a<-table.element(a,'% significant tests',header=TRUE)
a<-table.element(a,'OK/NOK',header=TRUE)
a<-table.row.end(a)
a<-table.row.start(a)
a<-table.element(a,'1% type I error level',header=TRUE)
a<-table.element(a,numsignificant1)
a<-table.element(a,numsignificant1/numgqtests)
if (numsignificant1/numgqtests < 0.01) dum <- 'OK' else dum <- 'NOK'
a<-table.element(a,dum)
a<-table.row.end(a)
a<-table.row.start(a)
a<-table.element(a,'5% type I error level',header=TRUE)
a<-table.element(a,numsignificant5)
a<-table.element(a,numsignificant5/numgqtests)
if (numsignificant5/numgqtests < 0.05) dum <- 'OK' else dum <- 'NOK'
a<-table.element(a,dum)
a<-table.row.end(a)
a<-table.row.start(a)
a<-table.element(a,'10% type I error level',header=TRUE)
a<-table.element(a,numsignificant10)
a<-table.element(a,numsignificant10/numgqtests)
if (numsignificant10/numgqtests < 0.1) dum <- 'OK' else dum <- 'NOK'
a<-table.element(a,dum)
a<-table.row.end(a)
a<-table.end(a)
table.save(a,file='mytable6.tab')
}