Free Statistics

of Irreproducible Research!

Author's title

Author*The author of this computation has been verified*
R Software Modulerwasp_multipleregression.wasp
Title produced by softwareMultiple Regression
Date of computationThu, 27 Nov 2008 05:29:10 -0700
Cite this page as followsStatistical Computations at FreeStatistics.org, Office for Research Development and Education, URL https://freestatistics.org/blog/index.php?v=date/2008/Nov/27/t1227789028k7vt3xsqndk1c3j.htm/, Retrieved Sun, 19 May 2024 08:54:53 +0000
Statistical Computations at FreeStatistics.org, Office for Research Development and Education, URL https://freestatistics.org/blog/index.php?pk=25773, Retrieved Sun, 19 May 2024 08:54:53 +0000
QR Codes:

Original text written by user:
IsPrivate?No (this computation is public)
User-defined keywords
Estimated Impact158
Family? (F = Feedback message, R = changed R code, M = changed R Module, P = changed Parameters, D = changed Data)
-     [Multiple Regression] [Case: the Seatbel...] [2008-11-26 16:42:24] [b6c777429d07a05453509ef079833861]
F R  D    [Multiple Regression] [Seatbelt Q3 Aok] [2008-11-27 12:29:10] [c5d6d05aee6be5527ac4a30a8c3b8fe5] [Current]
F   PD      [Multiple Regression] [case seatbelt Q3 Bok] [2008-11-27 12:36:10] [7849b5cbaea5f05923be73656f726e58]
Feedback Forum
2008-12-01 10:49:42 [Jessica Alves Pires] [reply
Goed dat je ook een berekening hebt gemaakt zonder dummies en linear trend, maar eigenlijk is dit overbodig.

Post a new message
Dataseries X:
105,4	109,1
107,1	111,4
110,7	114,1
117,1	121,8
118,7	127,6
126,5	129,9
127,5	128
134,6	123,5
131,8	124
135,9	127,4
142,7	127,6
141,7	128,4
153,4	131,4
145	135,1
137,7	134
148,3	144,5
152,2	147,3
169,4	150,9
168,6	148,7
161,1	141,4
174,1	138,9
179	139,8
190,6	145,6
190	147,9
181,6	148,5
174,8	151,1
180,5	157,5
196,8	167,5
193,8	172,3
197	173,5
216,3	187,5
221,4	205,5
217,9	195,1
229,7	204,5
227,4	204,5
204,2	201,7
196,6	207
198,8	206,6
207,5	210,6
190,7	211,1
201,6	215
210,5	223,9
223,5	238,2
223,8	238,9
231,2	229,6
244	232,2
234,7	222,1
250,2	221,6
265,7	227,3
287,6	221
283,3	213,6
295,4	243,4
312,3	253,8
333,8	265,3
347,7	268,2
383,2	268,5
407,1	266,9
413,6	268,4
362,7	250,8
321,9	231,2
239,4	192


Summary of computational transaction
Raw Inputview raw input (R code)
Raw Outputview raw output of R engine
Computing time5 seconds
R Server'George Udny Yule' @ 72.249.76.132

\begin{tabular}{lllllllll}
\hline
Summary of computational transaction \tabularnewline
Raw Input & view raw input (R code)  \tabularnewline
Raw Output & view raw output of R engine  \tabularnewline
Computing time & 5 seconds \tabularnewline
R Server & 'George Udny Yule' @ 72.249.76.132 \tabularnewline
\hline
\end{tabular}
%Source: https://freestatistics.org/blog/index.php?pk=25773&T=0

[TABLE]
[ROW][C]Summary of computational transaction[/C][/ROW]
[ROW][C]Raw Input[/C][C]view raw input (R code) [/C][/ROW]
[ROW][C]Raw Output[/C][C]view raw output of R engine [/C][/ROW]
[ROW][C]Computing time[/C][C]5 seconds[/C][/ROW]
[ROW][C]R Server[/C][C]'George Udny Yule' @ 72.249.76.132[/C][/ROW]
[/TABLE]
Source: https://freestatistics.org/blog/index.php?pk=25773&T=0

Globally Unique Identifier (entire table): ba.freestatistics.org/blog/index.php?pk=25773&T=0

As an alternative you can also use a QR Code:  

The GUIDs for individual cells are displayed in the table below:

Summary of computational transaction
Raw Inputview raw input (R code)
Raw Outputview raw output of R engine
Computing time5 seconds
R Server'George Udny Yule' @ 72.249.76.132


Multiple Linear Regression - Estimated Regression Equation
alg_indexcijfer_grondstoffen[t] = -46.0196124318757 + 1.39462324342885indexcijfer_industr_grondstoffen[t] + e[t]

\begin{tabular}{lllllllll}
\hline
Multiple Linear Regression - Estimated Regression Equation \tabularnewline
alg_indexcijfer_grondstoffen[t] =  -46.0196124318757 +  1.39462324342885indexcijfer_industr_grondstoffen[t]  + e[t] \tabularnewline
\hline
\end{tabular}
%Source: https://freestatistics.org/blog/index.php?pk=25773&T=1

[TABLE]
[ROW][C]Multiple Linear Regression - Estimated Regression Equation[/C][/ROW]
[ROW][C]alg_indexcijfer_grondstoffen[t] =  -46.0196124318757 +  1.39462324342885indexcijfer_industr_grondstoffen[t]  + e[t][/C][/ROW]
[/TABLE]
Source: https://freestatistics.org/blog/index.php?pk=25773&T=1

Globally Unique Identifier (entire table): ba.freestatistics.org/blog/index.php?pk=25773&T=1

As an alternative you can also use a QR Code:  

The GUIDs for individual cells are displayed in the table below:

Multiple Linear Regression - Estimated Regression Equation
alg_indexcijfer_grondstoffen[t] = -46.0196124318757 + 1.39462324342885indexcijfer_industr_grondstoffen[t] + e[t]


Multiple Linear Regression - Ordinary Least Squares
VariableParameterS.D.T-STATH0: parameter = 02-tail p-value1-tail p-value
(Intercept)-46.019612431875715.708824-2.92950.004820.00241
indexcijfer_industr_grondstoffen1.394623243428850.08287116.828800

\begin{tabular}{lllllllll}
\hline
Multiple Linear Regression - Ordinary Least Squares \tabularnewline
Variable & Parameter & S.D. & T-STATH0: parameter = 0 & 2-tail p-value & 1-tail p-value \tabularnewline
(Intercept) & -46.0196124318757 & 15.708824 & -2.9295 & 0.00482 & 0.00241 \tabularnewline
indexcijfer_industr_grondstoffen & 1.39462324342885 & 0.082871 & 16.8288 & 0 & 0 \tabularnewline
\hline
\end{tabular}
%Source: https://freestatistics.org/blog/index.php?pk=25773&T=2

[TABLE]
[ROW][C]Multiple Linear Regression - Ordinary Least Squares[/C][/ROW]
[ROW][C]Variable[/C][C]Parameter[/C][C]S.D.[/C][C]T-STATH0: parameter = 0[/C][C]2-tail p-value[/C][C]1-tail p-value[/C][/ROW]
[ROW][C](Intercept)[/C][C]-46.0196124318757[/C][C]15.708824[/C][C]-2.9295[/C][C]0.00482[/C][C]0.00241[/C][/ROW]
[ROW][C]indexcijfer_industr_grondstoffen[/C][C]1.39462324342885[/C][C]0.082871[/C][C]16.8288[/C][C]0[/C][C]0[/C][/ROW]
[/TABLE]
Source: https://freestatistics.org/blog/index.php?pk=25773&T=2

Globally Unique Identifier (entire table): ba.freestatistics.org/blog/index.php?pk=25773&T=2

As an alternative you can also use a QR Code:  

The GUIDs for individual cells are displayed in the table below:

Multiple Linear Regression - Ordinary Least Squares
VariableParameterS.D.T-STATH0: parameter = 02-tail p-value1-tail p-value
(Intercept)-46.019612431875715.708824-2.92950.004820.00241
indexcijfer_industr_grondstoffen1.394623243428850.08287116.828800


Multiple Linear Regression - Regression Statistics
Multiple R0.90972043899777
R-squared0.827591277130294
Adjusted R-squared0.82466909538674
F-TEST (value)283.210063493064
F-TEST (DF numerator)1
F-TEST (DF denominator)59
p-value0
Multiple Linear Regression - Residual Statistics
Residual Standard Deviation31.5283252453648
Sum Squared Residuals58648.0822738731

\begin{tabular}{lllllllll}
\hline
Multiple Linear Regression - Regression Statistics \tabularnewline
Multiple R & 0.90972043899777 \tabularnewline
R-squared & 0.827591277130294 \tabularnewline
Adjusted R-squared & 0.82466909538674 \tabularnewline
F-TEST (value) & 283.210063493064 \tabularnewline
F-TEST (DF numerator) & 1 \tabularnewline
F-TEST (DF denominator) & 59 \tabularnewline
p-value & 0 \tabularnewline
Multiple Linear Regression - Residual Statistics \tabularnewline
Residual Standard Deviation & 31.5283252453648 \tabularnewline
Sum Squared Residuals & 58648.0822738731 \tabularnewline
\hline
\end{tabular}
%Source: https://freestatistics.org/blog/index.php?pk=25773&T=3

[TABLE]
[ROW][C]Multiple Linear Regression - Regression Statistics[/C][/ROW]
[ROW][C]Multiple R[/C][C]0.90972043899777[/C][/ROW]
[ROW][C]R-squared[/C][C]0.827591277130294[/C][/ROW]
[ROW][C]Adjusted R-squared[/C][C]0.82466909538674[/C][/ROW]
[ROW][C]F-TEST (value)[/C][C]283.210063493064[/C][/ROW]
[ROW][C]F-TEST (DF numerator)[/C][C]1[/C][/ROW]
[ROW][C]F-TEST (DF denominator)[/C][C]59[/C][/ROW]
[ROW][C]p-value[/C][C]0[/C][/ROW]
[ROW][C]Multiple Linear Regression - Residual Statistics[/C][/ROW]
[ROW][C]Residual Standard Deviation[/C][C]31.5283252453648[/C][/ROW]
[ROW][C]Sum Squared Residuals[/C][C]58648.0822738731[/C][/ROW]
[/TABLE]
Source: https://freestatistics.org/blog/index.php?pk=25773&T=3

Globally Unique Identifier (entire table): ba.freestatistics.org/blog/index.php?pk=25773&T=3

As an alternative you can also use a QR Code:  

The GUIDs for individual cells are displayed in the table below:

Multiple Linear Regression - Regression Statistics
Multiple R0.90972043899777
R-squared0.827591277130294
Adjusted R-squared0.82466909538674
F-TEST (value)283.210063493064
F-TEST (DF numerator)1
F-TEST (DF denominator)59
p-value0
Multiple Linear Regression - Residual Statistics
Residual Standard Deviation31.5283252453648
Sum Squared Residuals58648.0822738731


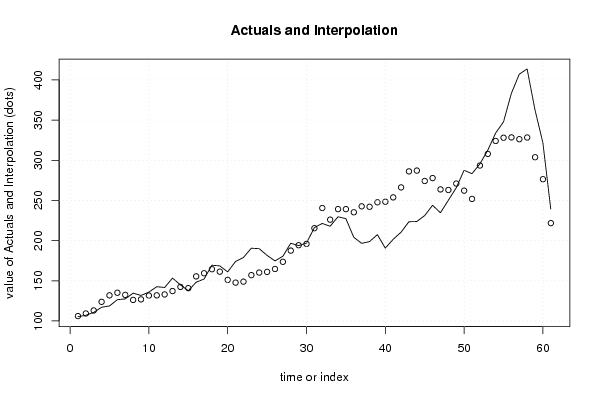
Multiple Linear Regression - Actuals, Interpolation, and Residuals
Time or IndexActualsInterpolationForecastResidualsPrediction Error
1105.4106.133783426212-0.73378342621179
2107.1109.341416886099-2.24141688609858
3110.7113.106899643357-2.40689964335655
4117.1123.845498617759-6.74549861775874
5118.7131.934313429646-13.2343134296461
6126.5135.141946889532-8.64194688953247
7127.5132.492162727018-4.99216272701765
8134.6126.2163581315888.3836418684122
9131.8126.9136697533024.88633024669779
10135.9131.6553887809604.24461121903968
11142.7131.93431342964610.7656865703539
12141.7133.0500120243898.6499879756108
13153.4137.23388175467616.1661182453243
14145142.3939877553632.60601224463750
15137.7140.859902187591-3.15990218759078
16148.3155.503446243594-7.20344624359373
17152.2159.408391325195-7.20839132519456
18169.4164.4290350015384.97096499846159
19168.6161.3608638659957.23913613400508
20161.1151.1801141889649.9198858110357
21174.1147.69355608039226.4064439196078
22179148.94871699947830.0512830005219
23190.6157.03753181136533.5624681886345
24190160.24516527125229.7548347287482
25181.6161.08193921730920.5180607826908
26174.8164.70795965022410.0920403497758
27180.5173.6335484081696.86645159183115
28196.8187.5797808424579.22021915754262
29193.8194.273972410916-0.473972410915902
30197195.9475203030311.05247969696948
31216.3215.4722457110340.827754288965523
32221.4240.575464092754-19.1754640927539
33217.9226.071382361094-8.17138236109377
34229.7239.180840849325-9.48084084932503
35227.4239.180840849325-11.780840849325
36204.2235.275895767724-31.0758957677242
37196.6242.667398957897-46.0673989578971
38198.8242.109549660526-43.3095496605256
39207.5247.688042634241-40.188042634241
40190.7248.385354255955-57.6853542559555
41201.6253.824384905328-52.224384905328
42210.5266.236531771845-55.7365317718448
43223.5286.179644152877-62.6796441528774
44223.8287.155880423278-63.3558804232776
45231.2274.185884259389-42.9858842593893
46244277.811904692304-33.8119046923043
47234.7263.726209933673-29.0262099336729
48250.2263.028898311958-12.8288983119584
49265.7270.978250799503-5.27825079950293
50287.6262.19212436590125.4078756340989
51283.3251.87191236452831.4280876354724
52295.4293.4316850187071.96831498129251
53312.3307.9357667503684.36423324963245
54333.8323.9739340497999.82606595020063
55347.7328.01834145574319.6816585442570
56383.2328.43672842877254.7632715712283
57407.1326.20533123928580.8946687607145
58413.6328.29726610442985.3027338955713
59362.7303.75189702008158.948102979919
60321.9276.41728144887545.4827185511246
61239.4221.74805030646417.6519496935357

\begin{tabular}{lllllllll}
\hline
Multiple Linear Regression - Actuals, Interpolation, and Residuals \tabularnewline
Time or Index & Actuals & InterpolationForecast & ResidualsPrediction Error \tabularnewline
1 & 105.4 & 106.133783426212 & -0.73378342621179 \tabularnewline
2 & 107.1 & 109.341416886099 & -2.24141688609858 \tabularnewline
3 & 110.7 & 113.106899643357 & -2.40689964335655 \tabularnewline
4 & 117.1 & 123.845498617759 & -6.74549861775874 \tabularnewline
5 & 118.7 & 131.934313429646 & -13.2343134296461 \tabularnewline
6 & 126.5 & 135.141946889532 & -8.64194688953247 \tabularnewline
7 & 127.5 & 132.492162727018 & -4.99216272701765 \tabularnewline
8 & 134.6 & 126.216358131588 & 8.3836418684122 \tabularnewline
9 & 131.8 & 126.913669753302 & 4.88633024669779 \tabularnewline
10 & 135.9 & 131.655388780960 & 4.24461121903968 \tabularnewline
11 & 142.7 & 131.934313429646 & 10.7656865703539 \tabularnewline
12 & 141.7 & 133.050012024389 & 8.6499879756108 \tabularnewline
13 & 153.4 & 137.233881754676 & 16.1661182453243 \tabularnewline
14 & 145 & 142.393987755363 & 2.60601224463750 \tabularnewline
15 & 137.7 & 140.859902187591 & -3.15990218759078 \tabularnewline
16 & 148.3 & 155.503446243594 & -7.20344624359373 \tabularnewline
17 & 152.2 & 159.408391325195 & -7.20839132519456 \tabularnewline
18 & 169.4 & 164.429035001538 & 4.97096499846159 \tabularnewline
19 & 168.6 & 161.360863865995 & 7.23913613400508 \tabularnewline
20 & 161.1 & 151.180114188964 & 9.9198858110357 \tabularnewline
21 & 174.1 & 147.693556080392 & 26.4064439196078 \tabularnewline
22 & 179 & 148.948716999478 & 30.0512830005219 \tabularnewline
23 & 190.6 & 157.037531811365 & 33.5624681886345 \tabularnewline
24 & 190 & 160.245165271252 & 29.7548347287482 \tabularnewline
25 & 181.6 & 161.081939217309 & 20.5180607826908 \tabularnewline
26 & 174.8 & 164.707959650224 & 10.0920403497758 \tabularnewline
27 & 180.5 & 173.633548408169 & 6.86645159183115 \tabularnewline
28 & 196.8 & 187.579780842457 & 9.22021915754262 \tabularnewline
29 & 193.8 & 194.273972410916 & -0.473972410915902 \tabularnewline
30 & 197 & 195.947520303031 & 1.05247969696948 \tabularnewline
31 & 216.3 & 215.472245711034 & 0.827754288965523 \tabularnewline
32 & 221.4 & 240.575464092754 & -19.1754640927539 \tabularnewline
33 & 217.9 & 226.071382361094 & -8.17138236109377 \tabularnewline
34 & 229.7 & 239.180840849325 & -9.48084084932503 \tabularnewline
35 & 227.4 & 239.180840849325 & -11.780840849325 \tabularnewline
36 & 204.2 & 235.275895767724 & -31.0758957677242 \tabularnewline
37 & 196.6 & 242.667398957897 & -46.0673989578971 \tabularnewline
38 & 198.8 & 242.109549660526 & -43.3095496605256 \tabularnewline
39 & 207.5 & 247.688042634241 & -40.188042634241 \tabularnewline
40 & 190.7 & 248.385354255955 & -57.6853542559555 \tabularnewline
41 & 201.6 & 253.824384905328 & -52.224384905328 \tabularnewline
42 & 210.5 & 266.236531771845 & -55.7365317718448 \tabularnewline
43 & 223.5 & 286.179644152877 & -62.6796441528774 \tabularnewline
44 & 223.8 & 287.155880423278 & -63.3558804232776 \tabularnewline
45 & 231.2 & 274.185884259389 & -42.9858842593893 \tabularnewline
46 & 244 & 277.811904692304 & -33.8119046923043 \tabularnewline
47 & 234.7 & 263.726209933673 & -29.0262099336729 \tabularnewline
48 & 250.2 & 263.028898311958 & -12.8288983119584 \tabularnewline
49 & 265.7 & 270.978250799503 & -5.27825079950293 \tabularnewline
50 & 287.6 & 262.192124365901 & 25.4078756340989 \tabularnewline
51 & 283.3 & 251.871912364528 & 31.4280876354724 \tabularnewline
52 & 295.4 & 293.431685018707 & 1.96831498129251 \tabularnewline
53 & 312.3 & 307.935766750368 & 4.36423324963245 \tabularnewline
54 & 333.8 & 323.973934049799 & 9.82606595020063 \tabularnewline
55 & 347.7 & 328.018341455743 & 19.6816585442570 \tabularnewline
56 & 383.2 & 328.436728428772 & 54.7632715712283 \tabularnewline
57 & 407.1 & 326.205331239285 & 80.8946687607145 \tabularnewline
58 & 413.6 & 328.297266104429 & 85.3027338955713 \tabularnewline
59 & 362.7 & 303.751897020081 & 58.948102979919 \tabularnewline
60 & 321.9 & 276.417281448875 & 45.4827185511246 \tabularnewline
61 & 239.4 & 221.748050306464 & 17.6519496935357 \tabularnewline
\hline
\end{tabular}
%Source: https://freestatistics.org/blog/index.php?pk=25773&T=4

[TABLE]
[ROW][C]Multiple Linear Regression - Actuals, Interpolation, and Residuals[/C][/ROW]
[ROW][C]Time or Index[/C][C]Actuals[/C][C]InterpolationForecast[/C][C]ResidualsPrediction Error[/C][/ROW]
[ROW][C]1[/C][C]105.4[/C][C]106.133783426212[/C][C]-0.73378342621179[/C][/ROW]
[ROW][C]2[/C][C]107.1[/C][C]109.341416886099[/C][C]-2.24141688609858[/C][/ROW]
[ROW][C]3[/C][C]110.7[/C][C]113.106899643357[/C][C]-2.40689964335655[/C][/ROW]
[ROW][C]4[/C][C]117.1[/C][C]123.845498617759[/C][C]-6.74549861775874[/C][/ROW]
[ROW][C]5[/C][C]118.7[/C][C]131.934313429646[/C][C]-13.2343134296461[/C][/ROW]
[ROW][C]6[/C][C]126.5[/C][C]135.141946889532[/C][C]-8.64194688953247[/C][/ROW]
[ROW][C]7[/C][C]127.5[/C][C]132.492162727018[/C][C]-4.99216272701765[/C][/ROW]
[ROW][C]8[/C][C]134.6[/C][C]126.216358131588[/C][C]8.3836418684122[/C][/ROW]
[ROW][C]9[/C][C]131.8[/C][C]126.913669753302[/C][C]4.88633024669779[/C][/ROW]
[ROW][C]10[/C][C]135.9[/C][C]131.655388780960[/C][C]4.24461121903968[/C][/ROW]
[ROW][C]11[/C][C]142.7[/C][C]131.934313429646[/C][C]10.7656865703539[/C][/ROW]
[ROW][C]12[/C][C]141.7[/C][C]133.050012024389[/C][C]8.6499879756108[/C][/ROW]
[ROW][C]13[/C][C]153.4[/C][C]137.233881754676[/C][C]16.1661182453243[/C][/ROW]
[ROW][C]14[/C][C]145[/C][C]142.393987755363[/C][C]2.60601224463750[/C][/ROW]
[ROW][C]15[/C][C]137.7[/C][C]140.859902187591[/C][C]-3.15990218759078[/C][/ROW]
[ROW][C]16[/C][C]148.3[/C][C]155.503446243594[/C][C]-7.20344624359373[/C][/ROW]
[ROW][C]17[/C][C]152.2[/C][C]159.408391325195[/C][C]-7.20839132519456[/C][/ROW]
[ROW][C]18[/C][C]169.4[/C][C]164.429035001538[/C][C]4.97096499846159[/C][/ROW]
[ROW][C]19[/C][C]168.6[/C][C]161.360863865995[/C][C]7.23913613400508[/C][/ROW]
[ROW][C]20[/C][C]161.1[/C][C]151.180114188964[/C][C]9.9198858110357[/C][/ROW]
[ROW][C]21[/C][C]174.1[/C][C]147.693556080392[/C][C]26.4064439196078[/C][/ROW]
[ROW][C]22[/C][C]179[/C][C]148.948716999478[/C][C]30.0512830005219[/C][/ROW]
[ROW][C]23[/C][C]190.6[/C][C]157.037531811365[/C][C]33.5624681886345[/C][/ROW]
[ROW][C]24[/C][C]190[/C][C]160.245165271252[/C][C]29.7548347287482[/C][/ROW]
[ROW][C]25[/C][C]181.6[/C][C]161.081939217309[/C][C]20.5180607826908[/C][/ROW]
[ROW][C]26[/C][C]174.8[/C][C]164.707959650224[/C][C]10.0920403497758[/C][/ROW]
[ROW][C]27[/C][C]180.5[/C][C]173.633548408169[/C][C]6.86645159183115[/C][/ROW]
[ROW][C]28[/C][C]196.8[/C][C]187.579780842457[/C][C]9.22021915754262[/C][/ROW]
[ROW][C]29[/C][C]193.8[/C][C]194.273972410916[/C][C]-0.473972410915902[/C][/ROW]
[ROW][C]30[/C][C]197[/C][C]195.947520303031[/C][C]1.05247969696948[/C][/ROW]
[ROW][C]31[/C][C]216.3[/C][C]215.472245711034[/C][C]0.827754288965523[/C][/ROW]
[ROW][C]32[/C][C]221.4[/C][C]240.575464092754[/C][C]-19.1754640927539[/C][/ROW]
[ROW][C]33[/C][C]217.9[/C][C]226.071382361094[/C][C]-8.17138236109377[/C][/ROW]
[ROW][C]34[/C][C]229.7[/C][C]239.180840849325[/C][C]-9.48084084932503[/C][/ROW]
[ROW][C]35[/C][C]227.4[/C][C]239.180840849325[/C][C]-11.780840849325[/C][/ROW]
[ROW][C]36[/C][C]204.2[/C][C]235.275895767724[/C][C]-31.0758957677242[/C][/ROW]
[ROW][C]37[/C][C]196.6[/C][C]242.667398957897[/C][C]-46.0673989578971[/C][/ROW]
[ROW][C]38[/C][C]198.8[/C][C]242.109549660526[/C][C]-43.3095496605256[/C][/ROW]
[ROW][C]39[/C][C]207.5[/C][C]247.688042634241[/C][C]-40.188042634241[/C][/ROW]
[ROW][C]40[/C][C]190.7[/C][C]248.385354255955[/C][C]-57.6853542559555[/C][/ROW]
[ROW][C]41[/C][C]201.6[/C][C]253.824384905328[/C][C]-52.224384905328[/C][/ROW]
[ROW][C]42[/C][C]210.5[/C][C]266.236531771845[/C][C]-55.7365317718448[/C][/ROW]
[ROW][C]43[/C][C]223.5[/C][C]286.179644152877[/C][C]-62.6796441528774[/C][/ROW]
[ROW][C]44[/C][C]223.8[/C][C]287.155880423278[/C][C]-63.3558804232776[/C][/ROW]
[ROW][C]45[/C][C]231.2[/C][C]274.185884259389[/C][C]-42.9858842593893[/C][/ROW]
[ROW][C]46[/C][C]244[/C][C]277.811904692304[/C][C]-33.8119046923043[/C][/ROW]
[ROW][C]47[/C][C]234.7[/C][C]263.726209933673[/C][C]-29.0262099336729[/C][/ROW]
[ROW][C]48[/C][C]250.2[/C][C]263.028898311958[/C][C]-12.8288983119584[/C][/ROW]
[ROW][C]49[/C][C]265.7[/C][C]270.978250799503[/C][C]-5.27825079950293[/C][/ROW]
[ROW][C]50[/C][C]287.6[/C][C]262.192124365901[/C][C]25.4078756340989[/C][/ROW]
[ROW][C]51[/C][C]283.3[/C][C]251.871912364528[/C][C]31.4280876354724[/C][/ROW]
[ROW][C]52[/C][C]295.4[/C][C]293.431685018707[/C][C]1.96831498129251[/C][/ROW]
[ROW][C]53[/C][C]312.3[/C][C]307.935766750368[/C][C]4.36423324963245[/C][/ROW]
[ROW][C]54[/C][C]333.8[/C][C]323.973934049799[/C][C]9.82606595020063[/C][/ROW]
[ROW][C]55[/C][C]347.7[/C][C]328.018341455743[/C][C]19.6816585442570[/C][/ROW]
[ROW][C]56[/C][C]383.2[/C][C]328.436728428772[/C][C]54.7632715712283[/C][/ROW]
[ROW][C]57[/C][C]407.1[/C][C]326.205331239285[/C][C]80.8946687607145[/C][/ROW]
[ROW][C]58[/C][C]413.6[/C][C]328.297266104429[/C][C]85.3027338955713[/C][/ROW]
[ROW][C]59[/C][C]362.7[/C][C]303.751897020081[/C][C]58.948102979919[/C][/ROW]
[ROW][C]60[/C][C]321.9[/C][C]276.417281448875[/C][C]45.4827185511246[/C][/ROW]
[ROW][C]61[/C][C]239.4[/C][C]221.748050306464[/C][C]17.6519496935357[/C][/ROW]
[/TABLE]
Source: https://freestatistics.org/blog/index.php?pk=25773&T=4

Globally Unique Identifier (entire table): ba.freestatistics.org/blog/index.php?pk=25773&T=4

As an alternative you can also use a QR Code:  

The GUIDs for individual cells are displayed in the table below:

Multiple Linear Regression - Actuals, Interpolation, and Residuals
Time or IndexActualsInterpolationForecastResidualsPrediction Error
1105.4106.133783426212-0.73378342621179
2107.1109.341416886099-2.24141688609858
3110.7113.106899643357-2.40689964335655
4117.1123.845498617759-6.74549861775874
5118.7131.934313429646-13.2343134296461
6126.5135.141946889532-8.64194688953247
7127.5132.492162727018-4.99216272701765
8134.6126.2163581315888.3836418684122
9131.8126.9136697533024.88633024669779
10135.9131.6553887809604.24461121903968
11142.7131.93431342964610.7656865703539
12141.7133.0500120243898.6499879756108
13153.4137.23388175467616.1661182453243
14145142.3939877553632.60601224463750
15137.7140.859902187591-3.15990218759078
16148.3155.503446243594-7.20344624359373
17152.2159.408391325195-7.20839132519456
18169.4164.4290350015384.97096499846159
19168.6161.3608638659957.23913613400508
20161.1151.1801141889649.9198858110357
21174.1147.69355608039226.4064439196078
22179148.94871699947830.0512830005219
23190.6157.03753181136533.5624681886345
24190160.24516527125229.7548347287482
25181.6161.08193921730920.5180607826908
26174.8164.70795965022410.0920403497758
27180.5173.6335484081696.86645159183115
28196.8187.5797808424579.22021915754262
29193.8194.273972410916-0.473972410915902
30197195.9475203030311.05247969696948
31216.3215.4722457110340.827754288965523
32221.4240.575464092754-19.1754640927539
33217.9226.071382361094-8.17138236109377
34229.7239.180840849325-9.48084084932503
35227.4239.180840849325-11.780840849325
36204.2235.275895767724-31.0758957677242
37196.6242.667398957897-46.0673989578971
38198.8242.109549660526-43.3095496605256
39207.5247.688042634241-40.188042634241
40190.7248.385354255955-57.6853542559555
41201.6253.824384905328-52.224384905328
42210.5266.236531771845-55.7365317718448
43223.5286.179644152877-62.6796441528774
44223.8287.155880423278-63.3558804232776
45231.2274.185884259389-42.9858842593893
46244277.811904692304-33.8119046923043
47234.7263.726209933673-29.0262099336729
48250.2263.028898311958-12.8288983119584
49265.7270.978250799503-5.27825079950293
50287.6262.19212436590125.4078756340989
51283.3251.87191236452831.4280876354724
52295.4293.4316850187071.96831498129251
53312.3307.9357667503684.36423324963245
54333.8323.9739340497999.82606595020063
55347.7328.01834145574319.6816585442570
56383.2328.43672842877254.7632715712283
57407.1326.20533123928580.8946687607145
58413.6328.29726610442985.3027338955713
59362.7303.75189702008158.948102979919
60321.9276.41728144887545.4827185511246
61239.4221.74805030646417.6519496935357


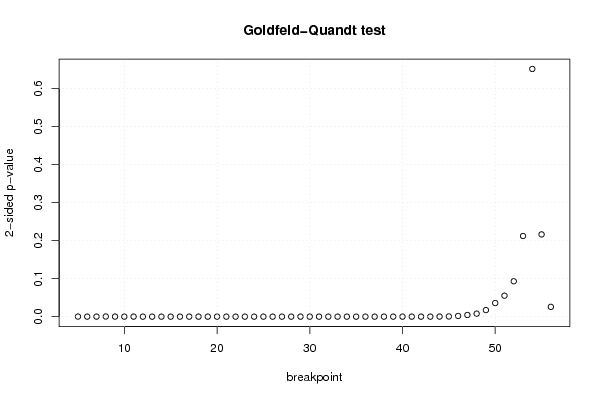
Goldfeld-Quandt test for Heteroskedasticity
p-valuesAlternative Hypothesis
breakpoint indexgreater2-sidedless
59.79366649014987e-050.0001958733298029970.999902063335099
63.34077388126155e-056.6815477625231e-050.999966592261187
71.14616522796924e-052.29233045593849e-050.99998853834772
80.000193936946218350.00038787389243670.999806063053782
98.78284510821172e-050.0001756569021642340.999912171548918
103.12837374503535e-056.2567474900707e-050.99996871626255
112.64459797185769e-055.28919594371539e-050.999973554020281
121.04917060290666e-052.09834120581331e-050.99998950829397
139.4411557009979e-061.88823114019958e-050.9999905588443
142.16304822716597e-064.32609645433194e-060.999997836951773
156.13286060792786e-071.22657212158557e-060.99999938671394
162.44295627108289e-074.88591254216578e-070.999999755704373
176.94293904947602e-081.38858780989520e-070.99999993057061
181.88391831878756e-083.76783663757512e-080.999999981160817
195.32240306430435e-091.06448061286087e-080.999999994677597
201.84404823565633e-093.68809647131266e-090.999999998155952
211.44229884334388e-082.88459768668777e-080.999999985577012
227.76688344821844e-081.55337668964369e-070.999999922331166
232.7096618484922e-075.4193236969844e-070.999999729033815
243.24846517708548e-076.49693035417095e-070.999999675153482
251.72841311521649e-073.45682623043297e-070.999999827158689
268.01598416518198e-081.60319683303640e-070.999999919840158
274.80830254906791e-089.61660509813583e-080.999999951916974
283.20725038102145e-086.41450076204289e-080.999999967927496
293.65060512975315e-087.3012102595063e-080.999999963493949
303.48788380584725e-086.9757676116945e-080.999999965121162
312.95398154571691e-085.90796309143381e-080.999999970460185
326.52123628428886e-081.30424725685777e-070.999999934787637
333.97527160176032e-087.95054320352063e-080.999999960247284
341.93599042781608e-083.87198085563217e-080.999999980640096
359.52679980036306e-091.90535996007261e-080.9999999904732
361.64310271953090e-083.28620543906179e-080.999999983568973
377.72395909598805e-081.54479181919761e-070.99999992276041
381.16751180241692e-072.33502360483384e-070.99999988324882
399.06000714040414e-081.81200142808083e-070.999999909399929
403.01997942270462e-076.03995884540925e-070.999999698002058
414.10647727708522e-078.21295455417044e-070.999999589352272
428.12433894456334e-071.62486778891267e-060.999999187566106
435.83774677883556e-061.16754935576711e-050.999994162253221
449.3201000972674e-050.0001864020019453480.999906798999027
450.0002822009923856440.0005644019847712890.999717799007614
460.0009265061041549860.001853012208309970.999073493895845
470.002238011990587600.004476023981175190.997761988009412
480.003958789595931260.007917579191862510.996041210404069
490.00866006398936180.01732012797872360.991339936010638
500.01790912705414890.03581825410829770.982090872945851
510.02756706289476180.05513412578952360.972432937105238
520.04653522515751370.09307045031502750.953464774842486
530.1060465394125300.2120930788250590.89395346058747
540.3257505664095310.6515011328190630.674249433590469
550.8918003812010180.2163992375979640.108199618798982
560.9870801232186370.02583975356272690.0129198767813634

\begin{tabular}{lllllllll}
\hline
Goldfeld-Quandt test for Heteroskedasticity \tabularnewline
p-values & Alternative Hypothesis \tabularnewline
breakpoint index & greater & 2-sided & less \tabularnewline
5 & 9.79366649014987e-05 & 0.000195873329802997 & 0.999902063335099 \tabularnewline
6 & 3.34077388126155e-05 & 6.6815477625231e-05 & 0.999966592261187 \tabularnewline
7 & 1.14616522796924e-05 & 2.29233045593849e-05 & 0.99998853834772 \tabularnewline
8 & 0.00019393694621835 & 0.0003878738924367 & 0.999806063053782 \tabularnewline
9 & 8.78284510821172e-05 & 0.000175656902164234 & 0.999912171548918 \tabularnewline
10 & 3.12837374503535e-05 & 6.2567474900707e-05 & 0.99996871626255 \tabularnewline
11 & 2.64459797185769e-05 & 5.28919594371539e-05 & 0.999973554020281 \tabularnewline
12 & 1.04917060290666e-05 & 2.09834120581331e-05 & 0.99998950829397 \tabularnewline
13 & 9.4411557009979e-06 & 1.88823114019958e-05 & 0.9999905588443 \tabularnewline
14 & 2.16304822716597e-06 & 4.32609645433194e-06 & 0.999997836951773 \tabularnewline
15 & 6.13286060792786e-07 & 1.22657212158557e-06 & 0.99999938671394 \tabularnewline
16 & 2.44295627108289e-07 & 4.88591254216578e-07 & 0.999999755704373 \tabularnewline
17 & 6.94293904947602e-08 & 1.38858780989520e-07 & 0.99999993057061 \tabularnewline
18 & 1.88391831878756e-08 & 3.76783663757512e-08 & 0.999999981160817 \tabularnewline
19 & 5.32240306430435e-09 & 1.06448061286087e-08 & 0.999999994677597 \tabularnewline
20 & 1.84404823565633e-09 & 3.68809647131266e-09 & 0.999999998155952 \tabularnewline
21 & 1.44229884334388e-08 & 2.88459768668777e-08 & 0.999999985577012 \tabularnewline
22 & 7.76688344821844e-08 & 1.55337668964369e-07 & 0.999999922331166 \tabularnewline
23 & 2.7096618484922e-07 & 5.4193236969844e-07 & 0.999999729033815 \tabularnewline
24 & 3.24846517708548e-07 & 6.49693035417095e-07 & 0.999999675153482 \tabularnewline
25 & 1.72841311521649e-07 & 3.45682623043297e-07 & 0.999999827158689 \tabularnewline
26 & 8.01598416518198e-08 & 1.60319683303640e-07 & 0.999999919840158 \tabularnewline
27 & 4.80830254906791e-08 & 9.61660509813583e-08 & 0.999999951916974 \tabularnewline
28 & 3.20725038102145e-08 & 6.41450076204289e-08 & 0.999999967927496 \tabularnewline
29 & 3.65060512975315e-08 & 7.3012102595063e-08 & 0.999999963493949 \tabularnewline
30 & 3.48788380584725e-08 & 6.9757676116945e-08 & 0.999999965121162 \tabularnewline
31 & 2.95398154571691e-08 & 5.90796309143381e-08 & 0.999999970460185 \tabularnewline
32 & 6.52123628428886e-08 & 1.30424725685777e-07 & 0.999999934787637 \tabularnewline
33 & 3.97527160176032e-08 & 7.95054320352063e-08 & 0.999999960247284 \tabularnewline
34 & 1.93599042781608e-08 & 3.87198085563217e-08 & 0.999999980640096 \tabularnewline
35 & 9.52679980036306e-09 & 1.90535996007261e-08 & 0.9999999904732 \tabularnewline
36 & 1.64310271953090e-08 & 3.28620543906179e-08 & 0.999999983568973 \tabularnewline
37 & 7.72395909598805e-08 & 1.54479181919761e-07 & 0.99999992276041 \tabularnewline
38 & 1.16751180241692e-07 & 2.33502360483384e-07 & 0.99999988324882 \tabularnewline
39 & 9.06000714040414e-08 & 1.81200142808083e-07 & 0.999999909399929 \tabularnewline
40 & 3.01997942270462e-07 & 6.03995884540925e-07 & 0.999999698002058 \tabularnewline
41 & 4.10647727708522e-07 & 8.21295455417044e-07 & 0.999999589352272 \tabularnewline
42 & 8.12433894456334e-07 & 1.62486778891267e-06 & 0.999999187566106 \tabularnewline
43 & 5.83774677883556e-06 & 1.16754935576711e-05 & 0.999994162253221 \tabularnewline
44 & 9.3201000972674e-05 & 0.000186402001945348 & 0.999906798999027 \tabularnewline
45 & 0.000282200992385644 & 0.000564401984771289 & 0.999717799007614 \tabularnewline
46 & 0.000926506104154986 & 0.00185301220830997 & 0.999073493895845 \tabularnewline
47 & 0.00223801199058760 & 0.00447602398117519 & 0.997761988009412 \tabularnewline
48 & 0.00395878959593126 & 0.00791757919186251 & 0.996041210404069 \tabularnewline
49 & 0.0086600639893618 & 0.0173201279787236 & 0.991339936010638 \tabularnewline
50 & 0.0179091270541489 & 0.0358182541082977 & 0.982090872945851 \tabularnewline
51 & 0.0275670628947618 & 0.0551341257895236 & 0.972432937105238 \tabularnewline
52 & 0.0465352251575137 & 0.0930704503150275 & 0.953464774842486 \tabularnewline
53 & 0.106046539412530 & 0.212093078825059 & 0.89395346058747 \tabularnewline
54 & 0.325750566409531 & 0.651501132819063 & 0.674249433590469 \tabularnewline
55 & 0.891800381201018 & 0.216399237597964 & 0.108199618798982 \tabularnewline
56 & 0.987080123218637 & 0.0258397535627269 & 0.0129198767813634 \tabularnewline
\hline
\end{tabular}
%Source: https://freestatistics.org/blog/index.php?pk=25773&T=5

[TABLE]
[ROW][C]Goldfeld-Quandt test for Heteroskedasticity[/C][/ROW]
[ROW][C]p-values[/C][C]Alternative Hypothesis[/C][/ROW]
[ROW][C]breakpoint index[/C][C]greater[/C][C]2-sided[/C][C]less[/C][/ROW]
[ROW][C]5[/C][C]9.79366649014987e-05[/C][C]0.000195873329802997[/C][C]0.999902063335099[/C][/ROW]
[ROW][C]6[/C][C]3.34077388126155e-05[/C][C]6.6815477625231e-05[/C][C]0.999966592261187[/C][/ROW]
[ROW][C]7[/C][C]1.14616522796924e-05[/C][C]2.29233045593849e-05[/C][C]0.99998853834772[/C][/ROW]
[ROW][C]8[/C][C]0.00019393694621835[/C][C]0.0003878738924367[/C][C]0.999806063053782[/C][/ROW]
[ROW][C]9[/C][C]8.78284510821172e-05[/C][C]0.000175656902164234[/C][C]0.999912171548918[/C][/ROW]
[ROW][C]10[/C][C]3.12837374503535e-05[/C][C]6.2567474900707e-05[/C][C]0.99996871626255[/C][/ROW]
[ROW][C]11[/C][C]2.64459797185769e-05[/C][C]5.28919594371539e-05[/C][C]0.999973554020281[/C][/ROW]
[ROW][C]12[/C][C]1.04917060290666e-05[/C][C]2.09834120581331e-05[/C][C]0.99998950829397[/C][/ROW]
[ROW][C]13[/C][C]9.4411557009979e-06[/C][C]1.88823114019958e-05[/C][C]0.9999905588443[/C][/ROW]
[ROW][C]14[/C][C]2.16304822716597e-06[/C][C]4.32609645433194e-06[/C][C]0.999997836951773[/C][/ROW]
[ROW][C]15[/C][C]6.13286060792786e-07[/C][C]1.22657212158557e-06[/C][C]0.99999938671394[/C][/ROW]
[ROW][C]16[/C][C]2.44295627108289e-07[/C][C]4.88591254216578e-07[/C][C]0.999999755704373[/C][/ROW]
[ROW][C]17[/C][C]6.94293904947602e-08[/C][C]1.38858780989520e-07[/C][C]0.99999993057061[/C][/ROW]
[ROW][C]18[/C][C]1.88391831878756e-08[/C][C]3.76783663757512e-08[/C][C]0.999999981160817[/C][/ROW]
[ROW][C]19[/C][C]5.32240306430435e-09[/C][C]1.06448061286087e-08[/C][C]0.999999994677597[/C][/ROW]
[ROW][C]20[/C][C]1.84404823565633e-09[/C][C]3.68809647131266e-09[/C][C]0.999999998155952[/C][/ROW]
[ROW][C]21[/C][C]1.44229884334388e-08[/C][C]2.88459768668777e-08[/C][C]0.999999985577012[/C][/ROW]
[ROW][C]22[/C][C]7.76688344821844e-08[/C][C]1.55337668964369e-07[/C][C]0.999999922331166[/C][/ROW]
[ROW][C]23[/C][C]2.7096618484922e-07[/C][C]5.4193236969844e-07[/C][C]0.999999729033815[/C][/ROW]
[ROW][C]24[/C][C]3.24846517708548e-07[/C][C]6.49693035417095e-07[/C][C]0.999999675153482[/C][/ROW]
[ROW][C]25[/C][C]1.72841311521649e-07[/C][C]3.45682623043297e-07[/C][C]0.999999827158689[/C][/ROW]
[ROW][C]26[/C][C]8.01598416518198e-08[/C][C]1.60319683303640e-07[/C][C]0.999999919840158[/C][/ROW]
[ROW][C]27[/C][C]4.80830254906791e-08[/C][C]9.61660509813583e-08[/C][C]0.999999951916974[/C][/ROW]
[ROW][C]28[/C][C]3.20725038102145e-08[/C][C]6.41450076204289e-08[/C][C]0.999999967927496[/C][/ROW]
[ROW][C]29[/C][C]3.65060512975315e-08[/C][C]7.3012102595063e-08[/C][C]0.999999963493949[/C][/ROW]
[ROW][C]30[/C][C]3.48788380584725e-08[/C][C]6.9757676116945e-08[/C][C]0.999999965121162[/C][/ROW]
[ROW][C]31[/C][C]2.95398154571691e-08[/C][C]5.90796309143381e-08[/C][C]0.999999970460185[/C][/ROW]
[ROW][C]32[/C][C]6.52123628428886e-08[/C][C]1.30424725685777e-07[/C][C]0.999999934787637[/C][/ROW]
[ROW][C]33[/C][C]3.97527160176032e-08[/C][C]7.95054320352063e-08[/C][C]0.999999960247284[/C][/ROW]
[ROW][C]34[/C][C]1.93599042781608e-08[/C][C]3.87198085563217e-08[/C][C]0.999999980640096[/C][/ROW]
[ROW][C]35[/C][C]9.52679980036306e-09[/C][C]1.90535996007261e-08[/C][C]0.9999999904732[/C][/ROW]
[ROW][C]36[/C][C]1.64310271953090e-08[/C][C]3.28620543906179e-08[/C][C]0.999999983568973[/C][/ROW]
[ROW][C]37[/C][C]7.72395909598805e-08[/C][C]1.54479181919761e-07[/C][C]0.99999992276041[/C][/ROW]
[ROW][C]38[/C][C]1.16751180241692e-07[/C][C]2.33502360483384e-07[/C][C]0.99999988324882[/C][/ROW]
[ROW][C]39[/C][C]9.06000714040414e-08[/C][C]1.81200142808083e-07[/C][C]0.999999909399929[/C][/ROW]
[ROW][C]40[/C][C]3.01997942270462e-07[/C][C]6.03995884540925e-07[/C][C]0.999999698002058[/C][/ROW]
[ROW][C]41[/C][C]4.10647727708522e-07[/C][C]8.21295455417044e-07[/C][C]0.999999589352272[/C][/ROW]
[ROW][C]42[/C][C]8.12433894456334e-07[/C][C]1.62486778891267e-06[/C][C]0.999999187566106[/C][/ROW]
[ROW][C]43[/C][C]5.83774677883556e-06[/C][C]1.16754935576711e-05[/C][C]0.999994162253221[/C][/ROW]
[ROW][C]44[/C][C]9.3201000972674e-05[/C][C]0.000186402001945348[/C][C]0.999906798999027[/C][/ROW]
[ROW][C]45[/C][C]0.000282200992385644[/C][C]0.000564401984771289[/C][C]0.999717799007614[/C][/ROW]
[ROW][C]46[/C][C]0.000926506104154986[/C][C]0.00185301220830997[/C][C]0.999073493895845[/C][/ROW]
[ROW][C]47[/C][C]0.00223801199058760[/C][C]0.00447602398117519[/C][C]0.997761988009412[/C][/ROW]
[ROW][C]48[/C][C]0.00395878959593126[/C][C]0.00791757919186251[/C][C]0.996041210404069[/C][/ROW]
[ROW][C]49[/C][C]0.0086600639893618[/C][C]0.0173201279787236[/C][C]0.991339936010638[/C][/ROW]
[ROW][C]50[/C][C]0.0179091270541489[/C][C]0.0358182541082977[/C][C]0.982090872945851[/C][/ROW]
[ROW][C]51[/C][C]0.0275670628947618[/C][C]0.0551341257895236[/C][C]0.972432937105238[/C][/ROW]
[ROW][C]52[/C][C]0.0465352251575137[/C][C]0.0930704503150275[/C][C]0.953464774842486[/C][/ROW]
[ROW][C]53[/C][C]0.106046539412530[/C][C]0.212093078825059[/C][C]0.89395346058747[/C][/ROW]
[ROW][C]54[/C][C]0.325750566409531[/C][C]0.651501132819063[/C][C]0.674249433590469[/C][/ROW]
[ROW][C]55[/C][C]0.891800381201018[/C][C]0.216399237597964[/C][C]0.108199618798982[/C][/ROW]
[ROW][C]56[/C][C]0.987080123218637[/C][C]0.0258397535627269[/C][C]0.0129198767813634[/C][/ROW]
[/TABLE]
Source: https://freestatistics.org/blog/index.php?pk=25773&T=5

Globally Unique Identifier (entire table): ba.freestatistics.org/blog/index.php?pk=25773&T=5

As an alternative you can also use a QR Code:  

The GUIDs for individual cells are displayed in the table below:

Goldfeld-Quandt test for Heteroskedasticity
p-valuesAlternative Hypothesis
breakpoint indexgreater2-sidedless
59.79366649014987e-050.0001958733298029970.999902063335099
63.34077388126155e-056.6815477625231e-050.999966592261187
71.14616522796924e-052.29233045593849e-050.99998853834772
80.000193936946218350.00038787389243670.999806063053782
98.78284510821172e-050.0001756569021642340.999912171548918
103.12837374503535e-056.2567474900707e-050.99996871626255
112.64459797185769e-055.28919594371539e-050.999973554020281
121.04917060290666e-052.09834120581331e-050.99998950829397
139.4411557009979e-061.88823114019958e-050.9999905588443
142.16304822716597e-064.32609645433194e-060.999997836951773
156.13286060792786e-071.22657212158557e-060.99999938671394
162.44295627108289e-074.88591254216578e-070.999999755704373
176.94293904947602e-081.38858780989520e-070.99999993057061
181.88391831878756e-083.76783663757512e-080.999999981160817
195.32240306430435e-091.06448061286087e-080.999999994677597
201.84404823565633e-093.68809647131266e-090.999999998155952
211.44229884334388e-082.88459768668777e-080.999999985577012
227.76688344821844e-081.55337668964369e-070.999999922331166
232.7096618484922e-075.4193236969844e-070.999999729033815
243.24846517708548e-076.49693035417095e-070.999999675153482
251.72841311521649e-073.45682623043297e-070.999999827158689
268.01598416518198e-081.60319683303640e-070.999999919840158
274.80830254906791e-089.61660509813583e-080.999999951916974
283.20725038102145e-086.41450076204289e-080.999999967927496
293.65060512975315e-087.3012102595063e-080.999999963493949
303.48788380584725e-086.9757676116945e-080.999999965121162
312.95398154571691e-085.90796309143381e-080.999999970460185
326.52123628428886e-081.30424725685777e-070.999999934787637
333.97527160176032e-087.95054320352063e-080.999999960247284
341.93599042781608e-083.87198085563217e-080.999999980640096
359.52679980036306e-091.90535996007261e-080.9999999904732
361.64310271953090e-083.28620543906179e-080.999999983568973
377.72395909598805e-081.54479181919761e-070.99999992276041
381.16751180241692e-072.33502360483384e-070.99999988324882
399.06000714040414e-081.81200142808083e-070.999999909399929
403.01997942270462e-076.03995884540925e-070.999999698002058
414.10647727708522e-078.21295455417044e-070.999999589352272
428.12433894456334e-071.62486778891267e-060.999999187566106
435.83774677883556e-061.16754935576711e-050.999994162253221
449.3201000972674e-050.0001864020019453480.999906798999027
450.0002822009923856440.0005644019847712890.999717799007614
460.0009265061041549860.001853012208309970.999073493895845
470.002238011990587600.004476023981175190.997761988009412
480.003958789595931260.007917579191862510.996041210404069
490.00866006398936180.01732012797872360.991339936010638
500.01790912705414890.03581825410829770.982090872945851
510.02756706289476180.05513412578952360.972432937105238
520.04653522515751370.09307045031502750.953464774842486
530.1060465394125300.2120930788250590.89395346058747
540.3257505664095310.6515011328190630.674249433590469
550.8918003812010180.2163992375979640.108199618798982
560.9870801232186370.02583975356272690.0129198767813634


Meta Analysis of Goldfeld-Quandt test for Heteroskedasticity
Description# significant tests% significant testsOK/NOK
1% type I error level440.846153846153846NOK
5% type I error level470.903846153846154NOK
10% type I error level490.942307692307692NOK

\begin{tabular}{lllllllll}
\hline
Meta Analysis of Goldfeld-Quandt test for Heteroskedasticity \tabularnewline
Description & # significant tests & % significant tests & OK/NOK \tabularnewline
1% type I error level & 44 & 0.846153846153846 & NOK \tabularnewline
5% type I error level & 47 & 0.903846153846154 & NOK \tabularnewline
10% type I error level & 49 & 0.942307692307692 & NOK \tabularnewline
\hline
\end{tabular}
%Source: https://freestatistics.org/blog/index.php?pk=25773&T=6

[TABLE]
[ROW][C]Meta Analysis of Goldfeld-Quandt test for Heteroskedasticity[/C][/ROW]
[ROW][C]Description[/C][C]# significant tests[/C][C]% significant tests[/C][C]OK/NOK[/C][/ROW]
[ROW][C]1% type I error level[/C][C]44[/C][C]0.846153846153846[/C][C]NOK[/C][/ROW]
[ROW][C]5% type I error level[/C][C]47[/C][C]0.903846153846154[/C][C]NOK[/C][/ROW]
[ROW][C]10% type I error level[/C][C]49[/C][C]0.942307692307692[/C][C]NOK[/C][/ROW]
[/TABLE]
Source: https://freestatistics.org/blog/index.php?pk=25773&T=6

Globally Unique Identifier (entire table): ba.freestatistics.org/blog/index.php?pk=25773&T=6

As an alternative you can also use a QR Code:  

The GUIDs for individual cells are displayed in the table below:

Meta Analysis of Goldfeld-Quandt test for Heteroskedasticity
Description# significant tests% significant testsOK/NOK
1% type I error level440.846153846153846NOK
5% type I error level470.903846153846154NOK
10% type I error level490.942307692307692NOK


Parameters (Session):
par1 = 1 ; par2 = Do not include Seasonal Dummies ; par3 = No Linear Trend ;
Parameters (R input):
par1 = 1 ; par2 = Do not include Seasonal Dummies ; par3 = No Linear Trend ;
R code (references can be found in the software module):
library(lattice)
library(lmtest)
n25 <- 25 #minimum number of obs. for Goldfeld-Quandt test
par1 <- as.numeric(par1)
x <- t(y)
k <- length(x[1,])
n <- length(x[,1])
x1 <- cbind(x[,par1], x[,1:k!=par1])
mycolnames <- c(colnames(x)[par1], colnames(x)[1:k!=par1])
colnames(x1) <- mycolnames #colnames(x)[par1]
x <- x1
if (par3 == 'First Differences'){
x2 <- array(0, dim=c(n-1,k), dimnames=list(1:(n-1), paste('(1-B)',colnames(x),sep='')))
for (i in 1:n-1) {
for (j in 1:k) {
x2[i,j] <- x[i+1,j] - x[i,j]
}
}
x <- x2
}
if (par2 == 'Include Monthly Dummies'){
x2 <- array(0, dim=c(n,11), dimnames=list(1:n, paste('M', seq(1:11), sep ='')))
for (i in 1:11){
x2[seq(i,n,12),i] <- 1
}
x <- cbind(x, x2)
}
if (par2 == 'Include Quarterly Dummies'){
x2 <- array(0, dim=c(n,3), dimnames=list(1:n, paste('Q', seq(1:3), sep ='')))
for (i in 1:3){
x2[seq(i,n,4),i] <- 1
}
x <- cbind(x, x2)
}
k <- length(x[1,])
if (par3 == 'Linear Trend'){
x <- cbind(x, c(1:n))
colnames(x)[k+1] <- 't'
}
x
k <- length(x[1,])
df <- as.data.frame(x)
(mylm <- lm(df))
(mysum <- summary(mylm))
if (n > n25) {
kp3 <- k + 3
nmkm3 <- n - k - 3
gqarr <- array(NA, dim=c(nmkm3-kp3+1,3))
numgqtests <- 0
numsignificant1 <- 0
numsignificant5 <- 0
numsignificant10 <- 0
for (mypoint in kp3:nmkm3) {
j <- 0
numgqtests <- numgqtests + 1
for (myalt in c('greater', 'two.sided', 'less')) {
j <- j + 1
gqarr[mypoint-kp3+1,j] <- gqtest(mylm, point=mypoint, alternative=myalt)$p.value
}
if (gqarr[mypoint-kp3+1,2] < 0.01) numsignificant1 <- numsignificant1 + 1
if (gqarr[mypoint-kp3+1,2] < 0.05) numsignificant5 <- numsignificant5 + 1
if (gqarr[mypoint-kp3+1,2] < 0.10) numsignificant10 <- numsignificant10 + 1
}
gqarr
}
bitmap(file='test0.png')
plot(x[,1], type='l', main='Actuals and Interpolation', ylab='value of Actuals and Interpolation (dots)', xlab='time or index')
points(x[,1]-mysum$resid)
grid()
dev.off()
bitmap(file='test1.png')
plot(mysum$resid, type='b', pch=19, main='Residuals', ylab='value of Residuals', xlab='time or index')
grid()
dev.off()
bitmap(file='test2.png')
hist(mysum$resid, main='Residual Histogram', xlab='values of Residuals')
grid()
dev.off()
bitmap(file='test3.png')
densityplot(~mysum$resid,col='black',main='Residual Density Plot', xlab='values of Residuals')
dev.off()
bitmap(file='test4.png')
qqnorm(mysum$resid, main='Residual Normal Q-Q Plot')
qqline(mysum$resid)
grid()
dev.off()
(myerror <- as.ts(mysum$resid))
bitmap(file='test5.png')
dum <- cbind(lag(myerror,k=1),myerror)
dum
dum1 <- dum[2:length(myerror),]
dum1
z <- as.data.frame(dum1)
z
plot(z,main=paste('Residual Lag plot, lowess, and regression line'), ylab='values of Residuals', xlab='lagged values of Residuals')
lines(lowess(z))
abline(lm(z))
grid()
dev.off()
bitmap(file='test6.png')
acf(mysum$resid, lag.max=length(mysum$resid)/2, main='Residual Autocorrelation Function')
grid()
dev.off()
bitmap(file='test7.png')
pacf(mysum$resid, lag.max=length(mysum$resid)/2, main='Residual Partial Autocorrelation Function')
grid()
dev.off()
bitmap(file='test8.png')
opar <- par(mfrow = c(2,2), oma = c(0, 0, 1.1, 0))
plot(mylm, las = 1, sub='Residual Diagnostics')
par(opar)
dev.off()
if (n > n25) {
bitmap(file='test9.png')
plot(kp3:nmkm3,gqarr[,2], main='Goldfeld-Quandt test',ylab='2-sided p-value',xlab='breakpoint')
grid()
dev.off()
}
load(file='createtable')
a<-table.start()
a<-table.row.start(a)
a<-table.element(a, 'Multiple Linear Regression - Estimated Regression Equation', 1, TRUE)
a<-table.row.end(a)
myeq <- colnames(x)[1]
myeq <- paste(myeq, '[t] = ', sep='')
for (i in 1:k){
if (mysum$coefficients[i,1] > 0) myeq <- paste(myeq, '+', '')
myeq <- paste(myeq, mysum$coefficients[i,1], sep=' ')
if (rownames(mysum$coefficients)[i] != '(Intercept)') {
myeq <- paste(myeq, rownames(mysum$coefficients)[i], sep='')
if (rownames(mysum$coefficients)[i] != 't') myeq <- paste(myeq, '[t]', sep='')
}
}
myeq <- paste(myeq, ' + e[t]')
a<-table.row.start(a)
a<-table.element(a, myeq)
a<-table.row.end(a)
a<-table.end(a)
table.save(a,file='mytable1.tab')
a<-table.start()
a<-table.row.start(a)
a<-table.element(a,hyperlink('ols1.htm','Multiple Linear Regression - Ordinary Least Squares',''), 6, TRUE)
a<-table.row.end(a)
a<-table.row.start(a)
a<-table.element(a,'Variable',header=TRUE)
a<-table.element(a,'Parameter',header=TRUE)
a<-table.element(a,'S.D.',header=TRUE)
a<-table.element(a,'T-STAT
H0: parameter = 0',header=TRUE)
a<-table.element(a,'2-tail p-value',header=TRUE)
a<-table.element(a,'1-tail p-value',header=TRUE)
a<-table.row.end(a)
for (i in 1:k){
a<-table.row.start(a)
a<-table.element(a,rownames(mysum$coefficients)[i],header=TRUE)
a<-table.element(a,mysum$coefficients[i,1])
a<-table.element(a, round(mysum$coefficients[i,2],6))
a<-table.element(a, round(mysum$coefficients[i,3],4))
a<-table.element(a, round(mysum$coefficients[i,4],6))
a<-table.element(a, round(mysum$coefficients[i,4]/2,6))
a<-table.row.end(a)
}
a<-table.end(a)
table.save(a,file='mytable2.tab')
a<-table.start()
a<-table.row.start(a)
a<-table.element(a, 'Multiple Linear Regression - Regression Statistics', 2, TRUE)
a<-table.row.end(a)
a<-table.row.start(a)
a<-table.element(a, 'Multiple R',1,TRUE)
a<-table.element(a, sqrt(mysum$r.squared))
a<-table.row.end(a)
a<-table.row.start(a)
a<-table.element(a, 'R-squared',1,TRUE)
a<-table.element(a, mysum$r.squared)
a<-table.row.end(a)
a<-table.row.start(a)
a<-table.element(a, 'Adjusted R-squared',1,TRUE)
a<-table.element(a, mysum$adj.r.squared)
a<-table.row.end(a)
a<-table.row.start(a)
a<-table.element(a, 'F-TEST (value)',1,TRUE)
a<-table.element(a, mysum$fstatistic[1])
a<-table.row.end(a)
a<-table.row.start(a)
a<-table.element(a, 'F-TEST (DF numerator)',1,TRUE)
a<-table.element(a, mysum$fstatistic[2])
a<-table.row.end(a)
a<-table.row.start(a)
a<-table.element(a, 'F-TEST (DF denominator)',1,TRUE)
a<-table.element(a, mysum$fstatistic[3])
a<-table.row.end(a)
a<-table.row.start(a)
a<-table.element(a, 'p-value',1,TRUE)
a<-table.element(a, 1-pf(mysum$fstatistic[1],mysum$fstatistic[2],mysum$fstatistic[3]))
a<-table.row.end(a)
a<-table.row.start(a)
a<-table.element(a, 'Multiple Linear Regression - Residual Statistics', 2, TRUE)
a<-table.row.end(a)
a<-table.row.start(a)
a<-table.element(a, 'Residual Standard Deviation',1,TRUE)
a<-table.element(a, mysum$sigma)
a<-table.row.end(a)
a<-table.row.start(a)
a<-table.element(a, 'Sum Squared Residuals',1,TRUE)
a<-table.element(a, sum(myerror*myerror))
a<-table.row.end(a)
a<-table.end(a)
table.save(a,file='mytable3.tab')
a<-table.start()
a<-table.row.start(a)
a<-table.element(a, 'Multiple Linear Regression - Actuals, Interpolation, and Residuals', 4, TRUE)
a<-table.row.end(a)
a<-table.row.start(a)
a<-table.element(a, 'Time or Index', 1, TRUE)
a<-table.element(a, 'Actuals', 1, TRUE)
a<-table.element(a, 'Interpolation
Forecast', 1, TRUE)
a<-table.element(a, 'Residuals
Prediction Error', 1, TRUE)
a<-table.row.end(a)
for (i in 1:n) {
a<-table.row.start(a)
a<-table.element(a,i, 1, TRUE)
a<-table.element(a,x[i])
a<-table.element(a,x[i]-mysum$resid[i])
a<-table.element(a,mysum$resid[i])
a<-table.row.end(a)
}
a<-table.end(a)
table.save(a,file='mytable4.tab')
if (n > n25) {
a<-table.start()
a<-table.row.start(a)
a<-table.element(a,'Goldfeld-Quandt test for Heteroskedasticity',4,TRUE)
a<-table.row.end(a)
a<-table.row.start(a)
a<-table.element(a,'p-values',header=TRUE)
a<-table.element(a,'Alternative Hypothesis',3,header=TRUE)
a<-table.row.end(a)
a<-table.row.start(a)
a<-table.element(a,'breakpoint index',header=TRUE)
a<-table.element(a,'greater',header=TRUE)
a<-table.element(a,'2-sided',header=TRUE)
a<-table.element(a,'less',header=TRUE)
a<-table.row.end(a)
for (mypoint in kp3:nmkm3) {
a<-table.row.start(a)
a<-table.element(a,mypoint,header=TRUE)
a<-table.element(a,gqarr[mypoint-kp3+1,1])
a<-table.element(a,gqarr[mypoint-kp3+1,2])
a<-table.element(a,gqarr[mypoint-kp3+1,3])
a<-table.row.end(a)
}
a<-table.end(a)
table.save(a,file='mytable5.tab')
a<-table.start()
a<-table.row.start(a)
a<-table.element(a,'Meta Analysis of Goldfeld-Quandt test for Heteroskedasticity',4,TRUE)
a<-table.row.end(a)
a<-table.row.start(a)
a<-table.element(a,'Description',header=TRUE)
a<-table.element(a,'# significant tests',header=TRUE)
a<-table.element(a,'% significant tests',header=TRUE)
a<-table.element(a,'OK/NOK',header=TRUE)
a<-table.row.end(a)
a<-table.row.start(a)
a<-table.element(a,'1% type I error level',header=TRUE)
a<-table.element(a,numsignificant1)
a<-table.element(a,numsignificant1/numgqtests)
if (numsignificant1/numgqtests < 0.01) dum <- 'OK' else dum <- 'NOK'
a<-table.element(a,dum)
a<-table.row.end(a)
a<-table.row.start(a)
a<-table.element(a,'5% type I error level',header=TRUE)
a<-table.element(a,numsignificant5)
a<-table.element(a,numsignificant5/numgqtests)
if (numsignificant5/numgqtests < 0.05) dum <- 'OK' else dum <- 'NOK'
a<-table.element(a,dum)
a<-table.row.end(a)
a<-table.row.start(a)
a<-table.element(a,'10% type I error level',header=TRUE)
a<-table.element(a,numsignificant10)
a<-table.element(a,numsignificant10/numgqtests)
if (numsignificant10/numgqtests < 0.1) dum <- 'OK' else dum <- 'NOK'
a<-table.element(a,dum)
a<-table.row.end(a)
a<-table.end(a)
table.save(a,file='mytable6.tab')
}