Free Statistics

of Irreproducible Research!

Author's title

Author*Unverified author*
R Software Modulerwasp_multipleregression.wasp
Title produced by softwareMultiple Regression
Date of computationThu, 27 Nov 2008 03:16:48 -0700
Cite this page as followsStatistical Computations at FreeStatistics.org, Office for Research Development and Education, URL https://freestatistics.org/blog/index.php?v=date/2008/Nov/27/t12277810862bc3eosbl9bml3e.htm/, Retrieved Sun, 19 May 2024 08:47:54 +0000
Statistical Computations at FreeStatistics.org, Office for Research Development and Education, URL https://freestatistics.org/blog/index.php?pk=25747, Retrieved Sun, 19 May 2024 08:47:54 +0000
QR Codes:

Original text written by user:
IsPrivate?No (this computation is public)
User-defined keywords
Estimated Impact169
Family? (F = Feedback message, R = changed R code, M = changed R Module, P = changed Parameters, D = changed Data)
-     [Multiple Regression] [final] [2008-11-27 10:04:18] [1b742211e88d1643c42c5773474321b2]
F   PD    [Multiple Regression] [final] [2008-11-27 10:16:48] [607bd9e9685911f7e343f7bc0bf7bdf9] [Current]
Feedback Forum
2008-11-30 15:43:32 [5faab2fc6fb120339944528a32d48a04] [reply
Goede gegevens gekozen.
Als we de P-waarde bekijken en vgl met de alpha-fout van 5% is de p-waarde groter dan de alpha fout wat geen significant verschil betekent. Met andere woorden is het verschil te wijten aan toeval.
Daarnaast is het correct dat je een eenzijdige toets kan gebruiken omdat de financiële crisis enkel negatieve gevolgen kan hebben.
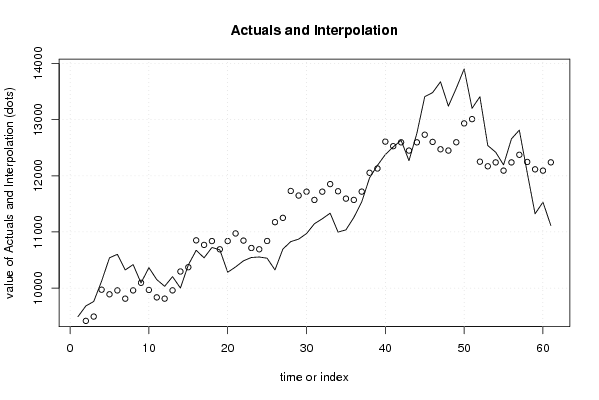
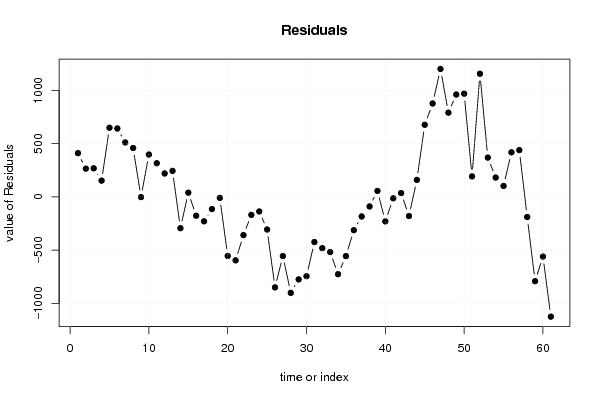
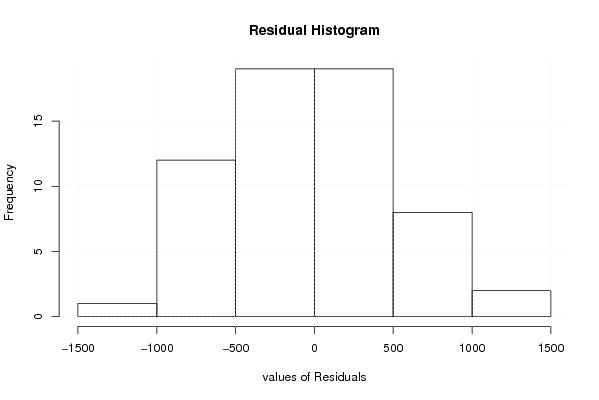
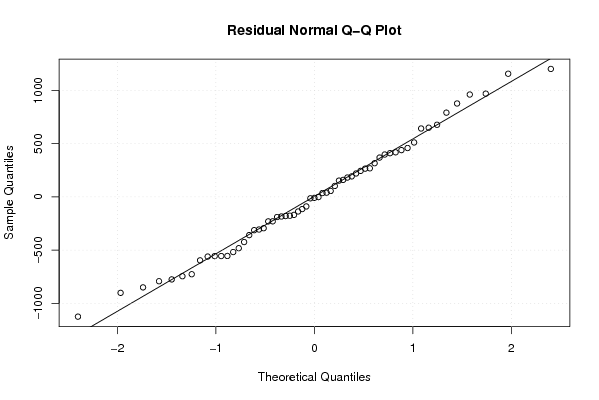
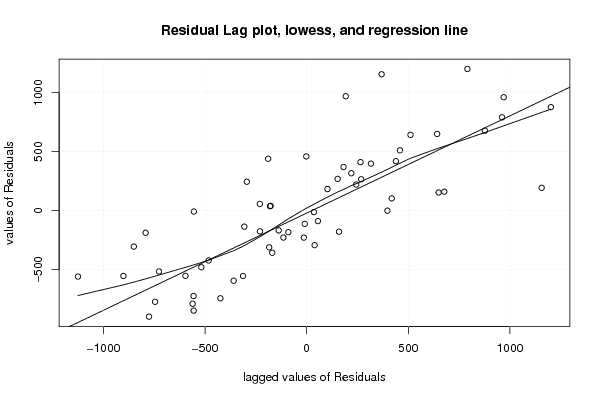
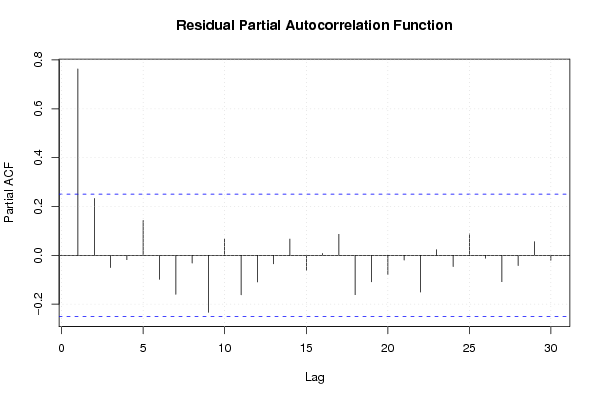
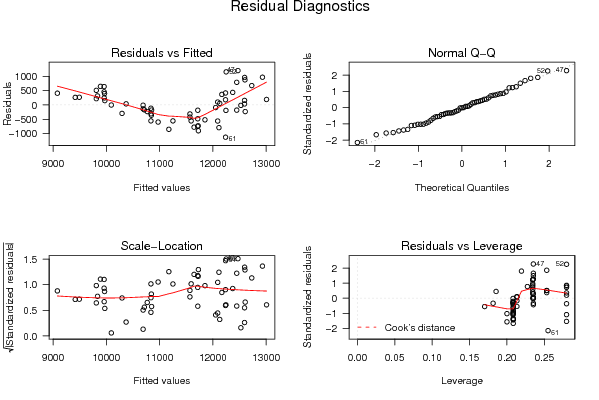
Adjusted R-squared: hetgeen je van de variabiliteit of spreiding kan verklaren, hoog is zeer goed.Maar als we de betrouwbaarheid ervan bekijken is de P-waarde van de F-test te hoog waardoor de berekening door toeval deze uitkomsten kan geven. De actuals and interpolations geeft ons een beeld van de stijgende trend gevolgd door een dalende trend, die het gevolg is van de financiële crisis. Residuals geeft een beeld van de voorspellingsfout, dit zou een mooi golvend patroon rond 0 moeten weergeven maar is hier niet het geval. Het histogram en het densityplot geven eveneens weer dat de residu's niet normaal verdeeld zijn.De qq-plot toont dat de quantielen van de residu’s relatief goed aansluiten aan quantielen van een normaalverdeling, enkel de staarten vertonen extremen.Hierbij toont de residual lag plot dat er sprake is van voorspelbaarheid vanwege de positieve correlatie tussen de voorspellingsfout op tijdstip t en t-1. De residual autocorrelatiefunctie geeft binnen de blauwe stippellijn het 95% betrouwbaarheidsinterval, alle verticale lijntjes buiten deze horizontale stippellijn zijn significant verschillend en dus ook niet te wijten aan toeval. Er is geen sprake van autocorrelatie.
Er werd geen algemeen besluit gemaakt, nl: Het model is nog niet helemaal in orde. Om aan de assumpties te voldoen:
•mag er geen patroon of geen autocorrelatie zijn; in orde
•moet het gemiddelde constant en nul zijn; niet in orde
2008-12-01 17:50:02 [Gert-Jan Geudens] [reply
Het antwoord van de student(e) is correct. Ook hier is de interpretatie van de residual lag plot, lowess, and regression line niet helemaal correct. We zien hier duidelijk een positieve correlatie tussen de huidige gegevens en de gegevens van de vorige periode. De bevindingen hangen dus nog af van andere factoren uit het verleden die nog niet door dit model worden onderzocht. Het model is dus nog niet helemaal volledig en dus zijn verdere aanpassingen noodzakelijk. Uit de gegevens kunnen we -zoals de student(e) reeds beschreven heeft- inderdaad afleiden dat de daling bijna nergens significant is en dus is dit model nog niet goed.

Post a new message
Dataseries X:
9492.49	0
9682.35	0
9762.12	0
10124.63	0
10540.05	0
10601.61	0
10323.73	0
10418.4	0
10092.96	0
10364.91	0
10152.09	0
10032.8	0
10204.59	0
10001.6	0
10411.75	0
10673.38	0
10539.51	0
10723.78	0
10682.06	0
10283.19	0
10377.18	0
10486.64	0
10545.38	0
10554.27	0
10532.54	0
10324.31	0
10695.25	0
10827.81	0
10872.48	0
10971.19	0
11145.65	0
11234.68	0
11333.88	0
10997.97	0
11036.89	0
11257.35	0
11533.59	0
11963.12	0
12185.15	0
12377.62	0
12512.89	0
12631.48	0
12268.53	0
12754.8	0
13407.75	0
13480.21	0
13673.28	0
13239.71	0
13557.69	0
13901.28	0
13200.58	0
13406.97	1
12538.12	1
12419.57	1
12193.88	1
12656.63	1
12812.48	1
12056.67	1
11322.38	1
11530.75	1
11114.08	1


Summary of computational transaction
Raw Inputview raw input (R code)
Raw Outputview raw output of R engine
Computing time7 seconds
R Server'Sir Ronald Aylmer Fisher' @ 193.190.124.24

\begin{tabular}{lllllllll}
\hline
Summary of computational transaction \tabularnewline
Raw Input & view raw input (R code)  \tabularnewline
Raw Output & view raw output of R engine  \tabularnewline
Computing time & 7 seconds \tabularnewline
R Server & 'Sir Ronald Aylmer Fisher' @ 193.190.124.24 \tabularnewline
\hline
\end{tabular}
%Source: https://freestatistics.org/blog/index.php?pk=25747&T=0

[TABLE]
[ROW][C]Summary of computational transaction[/C][/ROW]
[ROW][C]Raw Input[/C][C]view raw input (R code) [/C][/ROW]
[ROW][C]Raw Output[/C][C]view raw output of R engine [/C][/ROW]
[ROW][C]Computing time[/C][C]7 seconds[/C][/ROW]
[ROW][C]R Server[/C][C]'Sir Ronald Aylmer Fisher' @ 193.190.124.24[/C][/ROW]
[/TABLE]
Source: https://freestatistics.org/blog/index.php?pk=25747&T=0

Globally Unique Identifier (entire table): ba.freestatistics.org/blog/index.php?pk=25747&T=0

As an alternative you can also use a QR Code:  

The GUIDs for individual cells are displayed in the table below:

Summary of computational transaction
Raw Inputview raw input (R code)
Raw Outputview raw output of R engine
Computing time7 seconds
R Server'Sir Ronald Aylmer Fisher' @ 193.190.124.24


Multiple Linear Regression - Estimated Regression Equation
X[t] = + 8934.32837086093 -1235.85451986755Y[t] + 74.4114233811647M1[t] + 336.556910779986M2[t] + 339.777729304636M3[t] + 744.843451802796M4[t] + 590.154270327447M5[t] + 585.853088852098M6[t] + 365.879907376747M7[t] + 439.432725901398M8[t] + 501.525544426048M9[t] + 300.738362950699M10[t] + 96.2451814753494M11[t] + 73.2171814753495t + e[t]

\begin{tabular}{lllllllll}
\hline
Multiple Linear Regression - Estimated Regression Equation \tabularnewline
X[t] =  +  8934.32837086093 -1235.85451986755Y[t] +  74.4114233811647M1[t] +  336.556910779986M2[t] +  339.777729304636M3[t] +  744.843451802796M4[t] +  590.154270327447M5[t] +  585.853088852098M6[t] +  365.879907376747M7[t] +  439.432725901398M8[t] +  501.525544426048M9[t] +  300.738362950699M10[t] +  96.2451814753494M11[t] +  73.2171814753495t  + e[t] \tabularnewline
\hline
\end{tabular}
%Source: https://freestatistics.org/blog/index.php?pk=25747&T=1

[TABLE]
[ROW][C]Multiple Linear Regression - Estimated Regression Equation[/C][/ROW]
[ROW][C]X[t] =  +  8934.32837086093 -1235.85451986755Y[t] +  74.4114233811647M1[t] +  336.556910779986M2[t] +  339.777729304636M3[t] +  744.843451802796M4[t] +  590.154270327447M5[t] +  585.853088852098M6[t] +  365.879907376747M7[t] +  439.432725901398M8[t] +  501.525544426048M9[t] +  300.738362950699M10[t] +  96.2451814753494M11[t] +  73.2171814753495t  + e[t][/C][/ROW]
[/TABLE]
Source: https://freestatistics.org/blog/index.php?pk=25747&T=1

Globally Unique Identifier (entire table): ba.freestatistics.org/blog/index.php?pk=25747&T=1

As an alternative you can also use a QR Code:  

The GUIDs for individual cells are displayed in the table below:

Multiple Linear Regression - Estimated Regression Equation
X[t] = + 8934.32837086093 -1235.85451986755Y[t] + 74.4114233811647M1[t] + 336.556910779986M2[t] + 339.777729304636M3[t] + 744.843451802796M4[t] + 590.154270327447M5[t] + 585.853088852098M6[t] + 365.879907376747M7[t] + 439.432725901398M8[t] + 501.525544426048M9[t] + 300.738362950699M10[t] + 96.2451814753494M11[t] + 73.2171814753495t + e[t]


Multiple Linear Regression - Ordinary Least Squares
VariableParameterS.D.T-STATH0: parameter = 02-tail p-value1-tail p-value
(Intercept)8934.32837086093324.56730127.526900
Y-1235.85451986755278.153799-4.44315.4e-052.7e-05
M174.4114233811647367.3923130.20250.8403690.420185
M2336.556910779986385.9289220.87210.3876040.193802
M3339.777729304636385.6327170.88110.3827520.191376
M4744.843451802796385.7126621.93110.0595170.029758
M5590.154270327447385.053851.53270.1320650.066033
M6585.853088852098384.4819661.52370.1342730.067136
M7365.879907376747383.9973990.95280.3455570.172778
M8439.432725901398383.600481.14550.2577820.128891
M9501.525544426048383.2914821.30850.1970770.098538
M10300.738362950699383.0706150.78510.436350.218175
M1196.2451814753494382.9380350.25130.8026520.401326
t73.21718147534955.81830612.583900

\begin{tabular}{lllllllll}
\hline
Multiple Linear Regression - Ordinary Least Squares \tabularnewline
Variable & Parameter & S.D. & T-STATH0: parameter = 0 & 2-tail p-value & 1-tail p-value \tabularnewline
(Intercept) & 8934.32837086093 & 324.567301 & 27.5269 & 0 & 0 \tabularnewline
Y & -1235.85451986755 & 278.153799 & -4.4431 & 5.4e-05 & 2.7e-05 \tabularnewline
M1 & 74.4114233811647 & 367.392313 & 0.2025 & 0.840369 & 0.420185 \tabularnewline
M2 & 336.556910779986 & 385.928922 & 0.8721 & 0.387604 & 0.193802 \tabularnewline
M3 & 339.777729304636 & 385.632717 & 0.8811 & 0.382752 & 0.191376 \tabularnewline
M4 & 744.843451802796 & 385.712662 & 1.9311 & 0.059517 & 0.029758 \tabularnewline
M5 & 590.154270327447 & 385.05385 & 1.5327 & 0.132065 & 0.066033 \tabularnewline
M6 & 585.853088852098 & 384.481966 & 1.5237 & 0.134273 & 0.067136 \tabularnewline
M7 & 365.879907376747 & 383.997399 & 0.9528 & 0.345557 & 0.172778 \tabularnewline
M8 & 439.432725901398 & 383.60048 & 1.1455 & 0.257782 & 0.128891 \tabularnewline
M9 & 501.525544426048 & 383.291482 & 1.3085 & 0.197077 & 0.098538 \tabularnewline
M10 & 300.738362950699 & 383.070615 & 0.7851 & 0.43635 & 0.218175 \tabularnewline
M11 & 96.2451814753494 & 382.938035 & 0.2513 & 0.802652 & 0.401326 \tabularnewline
t & 73.2171814753495 & 5.818306 & 12.5839 & 0 & 0 \tabularnewline
\hline
\end{tabular}
%Source: https://freestatistics.org/blog/index.php?pk=25747&T=2

[TABLE]
[ROW][C]Multiple Linear Regression - Ordinary Least Squares[/C][/ROW]
[ROW][C]Variable[/C][C]Parameter[/C][C]S.D.[/C][C]T-STATH0: parameter = 0[/C][C]2-tail p-value[/C][C]1-tail p-value[/C][/ROW]
[ROW][C](Intercept)[/C][C]8934.32837086093[/C][C]324.567301[/C][C]27.5269[/C][C]0[/C][C]0[/C][/ROW]
[ROW][C]Y[/C][C]-1235.85451986755[/C][C]278.153799[/C][C]-4.4431[/C][C]5.4e-05[/C][C]2.7e-05[/C][/ROW]
[ROW][C]M1[/C][C]74.4114233811647[/C][C]367.392313[/C][C]0.2025[/C][C]0.840369[/C][C]0.420185[/C][/ROW]
[ROW][C]M2[/C][C]336.556910779986[/C][C]385.928922[/C][C]0.8721[/C][C]0.387604[/C][C]0.193802[/C][/ROW]
[ROW][C]M3[/C][C]339.777729304636[/C][C]385.632717[/C][C]0.8811[/C][C]0.382752[/C][C]0.191376[/C][/ROW]
[ROW][C]M4[/C][C]744.843451802796[/C][C]385.712662[/C][C]1.9311[/C][C]0.059517[/C][C]0.029758[/C][/ROW]
[ROW][C]M5[/C][C]590.154270327447[/C][C]385.05385[/C][C]1.5327[/C][C]0.132065[/C][C]0.066033[/C][/ROW]
[ROW][C]M6[/C][C]585.853088852098[/C][C]384.481966[/C][C]1.5237[/C][C]0.134273[/C][C]0.067136[/C][/ROW]
[ROW][C]M7[/C][C]365.879907376747[/C][C]383.997399[/C][C]0.9528[/C][C]0.345557[/C][C]0.172778[/C][/ROW]
[ROW][C]M8[/C][C]439.432725901398[/C][C]383.60048[/C][C]1.1455[/C][C]0.257782[/C][C]0.128891[/C][/ROW]
[ROW][C]M9[/C][C]501.525544426048[/C][C]383.291482[/C][C]1.3085[/C][C]0.197077[/C][C]0.098538[/C][/ROW]
[ROW][C]M10[/C][C]300.738362950699[/C][C]383.070615[/C][C]0.7851[/C][C]0.43635[/C][C]0.218175[/C][/ROW]
[ROW][C]M11[/C][C]96.2451814753494[/C][C]382.938035[/C][C]0.2513[/C][C]0.802652[/C][C]0.401326[/C][/ROW]
[ROW][C]t[/C][C]73.2171814753495[/C][C]5.818306[/C][C]12.5839[/C][C]0[/C][C]0[/C][/ROW]
[/TABLE]
Source: https://freestatistics.org/blog/index.php?pk=25747&T=2

Globally Unique Identifier (entire table): ba.freestatistics.org/blog/index.php?pk=25747&T=2

As an alternative you can also use a QR Code:  

The GUIDs for individual cells are displayed in the table below:

Multiple Linear Regression - Ordinary Least Squares
VariableParameterS.D.T-STATH0: parameter = 02-tail p-value1-tail p-value
(Intercept)8934.32837086093324.56730127.526900
Y-1235.85451986755278.153799-4.44315.4e-052.7e-05
M174.4114233811647367.3923130.20250.8403690.420185
M2336.556910779986385.9289220.87210.3876040.193802
M3339.777729304636385.6327170.88110.3827520.191376
M4744.843451802796385.7126621.93110.0595170.029758
M5590.154270327447385.053851.53270.1320650.066033
M6585.853088852098384.4819661.52370.1342730.067136
M7365.879907376747383.9973990.95280.3455570.172778
M8439.432725901398383.600481.14550.2577820.128891
M9501.525544426048383.2914821.30850.1970770.098538
M10300.738362950699383.0706150.78510.436350.218175
M1196.2451814753494382.9380350.25130.8026520.401326
t73.21718147534955.81830612.583900


Multiple Linear Regression - Regression Statistics
Multiple R0.892553472677041
R-squared0.796651701587845
Adjusted R-squared0.740406427558952
F-TEST (value)14.1638869281461
F-TEST (DF numerator)13
F-TEST (DF denominator)47
p-value4.10116385296533e-12
Multiple Linear Regression - Residual Statistics
Residual Standard Deviation605.408303707719
Sum Squared Residuals17226403.0673181

\begin{tabular}{lllllllll}
\hline
Multiple Linear Regression - Regression Statistics \tabularnewline
Multiple R & 0.892553472677041 \tabularnewline
R-squared & 0.796651701587845 \tabularnewline
Adjusted R-squared & 0.740406427558952 \tabularnewline
F-TEST (value) & 14.1638869281461 \tabularnewline
F-TEST (DF numerator) & 13 \tabularnewline
F-TEST (DF denominator) & 47 \tabularnewline
p-value & 4.10116385296533e-12 \tabularnewline
Multiple Linear Regression - Residual Statistics \tabularnewline
Residual Standard Deviation & 605.408303707719 \tabularnewline
Sum Squared Residuals & 17226403.0673181 \tabularnewline
\hline
\end{tabular}
%Source: https://freestatistics.org/blog/index.php?pk=25747&T=3

[TABLE]
[ROW][C]Multiple Linear Regression - Regression Statistics[/C][/ROW]
[ROW][C]Multiple R[/C][C]0.892553472677041[/C][/ROW]
[ROW][C]R-squared[/C][C]0.796651701587845[/C][/ROW]
[ROW][C]Adjusted R-squared[/C][C]0.740406427558952[/C][/ROW]
[ROW][C]F-TEST (value)[/C][C]14.1638869281461[/C][/ROW]
[ROW][C]F-TEST (DF numerator)[/C][C]13[/C][/ROW]
[ROW][C]F-TEST (DF denominator)[/C][C]47[/C][/ROW]
[ROW][C]p-value[/C][C]4.10116385296533e-12[/C][/ROW]
[ROW][C]Multiple Linear Regression - Residual Statistics[/C][/ROW]
[ROW][C]Residual Standard Deviation[/C][C]605.408303707719[/C][/ROW]
[ROW][C]Sum Squared Residuals[/C][C]17226403.0673181[/C][/ROW]
[/TABLE]
Source: https://freestatistics.org/blog/index.php?pk=25747&T=3

Globally Unique Identifier (entire table): ba.freestatistics.org/blog/index.php?pk=25747&T=3

As an alternative you can also use a QR Code:  

The GUIDs for individual cells are displayed in the table below:

Multiple Linear Regression - Regression Statistics
Multiple R0.892553472677041
R-squared0.796651701587845
Adjusted R-squared0.740406427558952
F-TEST (value)14.1638869281461
F-TEST (DF numerator)13
F-TEST (DF denominator)47
p-value4.10116385296533e-12
Multiple Linear Regression - Residual Statistics
Residual Standard Deviation605.408303707719
Sum Squared Residuals17226403.0673181


Multiple Linear Regression - Actuals, Interpolation, and Residuals
Time or IndexActualsInterpolationForecastResidualsPrediction Error
19492.499081.95697571743410.533024282568
29682.359417.31964459161265.030355408389
39762.129493.75764459161268.362355408389
410124.639972.04054856512152.589451434878
510540.059890.56854856512649.481451434878
610601.619959.48454856512642.125451434878
710323.739812.72854856512511.001451434878
810418.49959.49854856512458.901451434877
910092.9610094.8085485651-1.8485485651222
1010364.919967.23854856512397.671451434878
1110152.099835.96254856512316.127451434879
1210032.89812.93454856512219.865451434877
1310204.599960.56315342164244.026846578365
1410001.610295.9258222958-294.325822295806
1510411.7510372.363822295839.3861777041938
1610673.3810850.6467262693-177.266726269316
1710539.5110769.1747262693-229.664726269316
1810723.7810838.0907262693-114.310726269315
1910682.0610691.3347262693-9.27472626931606
2010283.1910838.1047262693-554.914726269315
2110377.1810973.4147262693-596.234726269315
2210486.6410845.8447262693-359.204726269316
2310545.3810714.5687262693-169.188726269317
2410554.2710691.5407262693-137.270726269315
2510532.5410839.1693311258-306.629331125829
2610324.3111174.532-850.222
2710695.2511250.97-555.72
2810827.8111729.2529039735-901.44290397351
2910872.4811647.7809039735-775.30090397351
3010971.1911716.6969039735-745.50690397351
3111145.6511569.9409039735-424.29090397351
3211234.6811716.7109039735-482.030903973509
3311333.8811852.0209039735-518.14090397351
3410997.9711724.4509039735-726.48090397351
3511036.8911593.1749039735-556.28490397351
3611257.3511570.1469039735-312.796903973509
3711533.5911717.7755088300-184.185508830024
3811963.1212053.1381777042-90.0181777041935
3912185.1512129.576177704255.5738222958057
4012377.6212607.8590816777-230.239081677703
4112512.8912526.3870816777-13.4970816777046
4212631.4812595.303081677736.1769183222954
4312268.5312448.5470816777-180.017081677703
4412754.812595.3170816777159.482918322296
4513407.7512730.6270816777677.122918322296
4613480.2112603.0570816777877.152918322296
4713673.2812471.78108167771201.49891832230
4813239.7112448.7530816777790.956918322295
4913557.6912596.3816865342961.308313465782
5013901.2812931.7443554084969.535644591612
5113200.5813008.1823554084192.397644591611
5213406.9712250.61073951431156.35926048565
5312538.1212169.1387395143368.981260485652
5412419.5712238.0547395143181.515260485651
5512193.8812091.2987395143102.581260485651
5612656.6312238.0687395143418.561260485651
5712812.4812373.3787395143439.101260485651
5812056.6712245.8087395143-189.138739514348
5911322.3812114.5327395143-792.152739514349
6011530.7512091.5047395143-560.754739514348
6111114.0812239.1333443709-1125.05334437086

\begin{tabular}{lllllllll}
\hline
Multiple Linear Regression - Actuals, Interpolation, and Residuals \tabularnewline
Time or Index & Actuals & InterpolationForecast & ResidualsPrediction Error \tabularnewline
1 & 9492.49 & 9081.95697571743 & 410.533024282568 \tabularnewline
2 & 9682.35 & 9417.31964459161 & 265.030355408389 \tabularnewline
3 & 9762.12 & 9493.75764459161 & 268.362355408389 \tabularnewline
4 & 10124.63 & 9972.04054856512 & 152.589451434878 \tabularnewline
5 & 10540.05 & 9890.56854856512 & 649.481451434878 \tabularnewline
6 & 10601.61 & 9959.48454856512 & 642.125451434878 \tabularnewline
7 & 10323.73 & 9812.72854856512 & 511.001451434878 \tabularnewline
8 & 10418.4 & 9959.49854856512 & 458.901451434877 \tabularnewline
9 & 10092.96 & 10094.8085485651 & -1.8485485651222 \tabularnewline
10 & 10364.91 & 9967.23854856512 & 397.671451434878 \tabularnewline
11 & 10152.09 & 9835.96254856512 & 316.127451434879 \tabularnewline
12 & 10032.8 & 9812.93454856512 & 219.865451434877 \tabularnewline
13 & 10204.59 & 9960.56315342164 & 244.026846578365 \tabularnewline
14 & 10001.6 & 10295.9258222958 & -294.325822295806 \tabularnewline
15 & 10411.75 & 10372.3638222958 & 39.3861777041938 \tabularnewline
16 & 10673.38 & 10850.6467262693 & -177.266726269316 \tabularnewline
17 & 10539.51 & 10769.1747262693 & -229.664726269316 \tabularnewline
18 & 10723.78 & 10838.0907262693 & -114.310726269315 \tabularnewline
19 & 10682.06 & 10691.3347262693 & -9.27472626931606 \tabularnewline
20 & 10283.19 & 10838.1047262693 & -554.914726269315 \tabularnewline
21 & 10377.18 & 10973.4147262693 & -596.234726269315 \tabularnewline
22 & 10486.64 & 10845.8447262693 & -359.204726269316 \tabularnewline
23 & 10545.38 & 10714.5687262693 & -169.188726269317 \tabularnewline
24 & 10554.27 & 10691.5407262693 & -137.270726269315 \tabularnewline
25 & 10532.54 & 10839.1693311258 & -306.629331125829 \tabularnewline
26 & 10324.31 & 11174.532 & -850.222 \tabularnewline
27 & 10695.25 & 11250.97 & -555.72 \tabularnewline
28 & 10827.81 & 11729.2529039735 & -901.44290397351 \tabularnewline
29 & 10872.48 & 11647.7809039735 & -775.30090397351 \tabularnewline
30 & 10971.19 & 11716.6969039735 & -745.50690397351 \tabularnewline
31 & 11145.65 & 11569.9409039735 & -424.29090397351 \tabularnewline
32 & 11234.68 & 11716.7109039735 & -482.030903973509 \tabularnewline
33 & 11333.88 & 11852.0209039735 & -518.14090397351 \tabularnewline
34 & 10997.97 & 11724.4509039735 & -726.48090397351 \tabularnewline
35 & 11036.89 & 11593.1749039735 & -556.28490397351 \tabularnewline
36 & 11257.35 & 11570.1469039735 & -312.796903973509 \tabularnewline
37 & 11533.59 & 11717.7755088300 & -184.185508830024 \tabularnewline
38 & 11963.12 & 12053.1381777042 & -90.0181777041935 \tabularnewline
39 & 12185.15 & 12129.5761777042 & 55.5738222958057 \tabularnewline
40 & 12377.62 & 12607.8590816777 & -230.239081677703 \tabularnewline
41 & 12512.89 & 12526.3870816777 & -13.4970816777046 \tabularnewline
42 & 12631.48 & 12595.3030816777 & 36.1769183222954 \tabularnewline
43 & 12268.53 & 12448.5470816777 & -180.017081677703 \tabularnewline
44 & 12754.8 & 12595.3170816777 & 159.482918322296 \tabularnewline
45 & 13407.75 & 12730.6270816777 & 677.122918322296 \tabularnewline
46 & 13480.21 & 12603.0570816777 & 877.152918322296 \tabularnewline
47 & 13673.28 & 12471.7810816777 & 1201.49891832230 \tabularnewline
48 & 13239.71 & 12448.7530816777 & 790.956918322295 \tabularnewline
49 & 13557.69 & 12596.3816865342 & 961.308313465782 \tabularnewline
50 & 13901.28 & 12931.7443554084 & 969.535644591612 \tabularnewline
51 & 13200.58 & 13008.1823554084 & 192.397644591611 \tabularnewline
52 & 13406.97 & 12250.6107395143 & 1156.35926048565 \tabularnewline
53 & 12538.12 & 12169.1387395143 & 368.981260485652 \tabularnewline
54 & 12419.57 & 12238.0547395143 & 181.515260485651 \tabularnewline
55 & 12193.88 & 12091.2987395143 & 102.581260485651 \tabularnewline
56 & 12656.63 & 12238.0687395143 & 418.561260485651 \tabularnewline
57 & 12812.48 & 12373.3787395143 & 439.101260485651 \tabularnewline
58 & 12056.67 & 12245.8087395143 & -189.138739514348 \tabularnewline
59 & 11322.38 & 12114.5327395143 & -792.152739514349 \tabularnewline
60 & 11530.75 & 12091.5047395143 & -560.754739514348 \tabularnewline
61 & 11114.08 & 12239.1333443709 & -1125.05334437086 \tabularnewline
\hline
\end{tabular}
%Source: https://freestatistics.org/blog/index.php?pk=25747&T=4

[TABLE]
[ROW][C]Multiple Linear Regression - Actuals, Interpolation, and Residuals[/C][/ROW]
[ROW][C]Time or Index[/C][C]Actuals[/C][C]InterpolationForecast[/C][C]ResidualsPrediction Error[/C][/ROW]
[ROW][C]1[/C][C]9492.49[/C][C]9081.95697571743[/C][C]410.533024282568[/C][/ROW]
[ROW][C]2[/C][C]9682.35[/C][C]9417.31964459161[/C][C]265.030355408389[/C][/ROW]
[ROW][C]3[/C][C]9762.12[/C][C]9493.75764459161[/C][C]268.362355408389[/C][/ROW]
[ROW][C]4[/C][C]10124.63[/C][C]9972.04054856512[/C][C]152.589451434878[/C][/ROW]
[ROW][C]5[/C][C]10540.05[/C][C]9890.56854856512[/C][C]649.481451434878[/C][/ROW]
[ROW][C]6[/C][C]10601.61[/C][C]9959.48454856512[/C][C]642.125451434878[/C][/ROW]
[ROW][C]7[/C][C]10323.73[/C][C]9812.72854856512[/C][C]511.001451434878[/C][/ROW]
[ROW][C]8[/C][C]10418.4[/C][C]9959.49854856512[/C][C]458.901451434877[/C][/ROW]
[ROW][C]9[/C][C]10092.96[/C][C]10094.8085485651[/C][C]-1.8485485651222[/C][/ROW]
[ROW][C]10[/C][C]10364.91[/C][C]9967.23854856512[/C][C]397.671451434878[/C][/ROW]
[ROW][C]11[/C][C]10152.09[/C][C]9835.96254856512[/C][C]316.127451434879[/C][/ROW]
[ROW][C]12[/C][C]10032.8[/C][C]9812.93454856512[/C][C]219.865451434877[/C][/ROW]
[ROW][C]13[/C][C]10204.59[/C][C]9960.56315342164[/C][C]244.026846578365[/C][/ROW]
[ROW][C]14[/C][C]10001.6[/C][C]10295.9258222958[/C][C]-294.325822295806[/C][/ROW]
[ROW][C]15[/C][C]10411.75[/C][C]10372.3638222958[/C][C]39.3861777041938[/C][/ROW]
[ROW][C]16[/C][C]10673.38[/C][C]10850.6467262693[/C][C]-177.266726269316[/C][/ROW]
[ROW][C]17[/C][C]10539.51[/C][C]10769.1747262693[/C][C]-229.664726269316[/C][/ROW]
[ROW][C]18[/C][C]10723.78[/C][C]10838.0907262693[/C][C]-114.310726269315[/C][/ROW]
[ROW][C]19[/C][C]10682.06[/C][C]10691.3347262693[/C][C]-9.27472626931606[/C][/ROW]
[ROW][C]20[/C][C]10283.19[/C][C]10838.1047262693[/C][C]-554.914726269315[/C][/ROW]
[ROW][C]21[/C][C]10377.18[/C][C]10973.4147262693[/C][C]-596.234726269315[/C][/ROW]
[ROW][C]22[/C][C]10486.64[/C][C]10845.8447262693[/C][C]-359.204726269316[/C][/ROW]
[ROW][C]23[/C][C]10545.38[/C][C]10714.5687262693[/C][C]-169.188726269317[/C][/ROW]
[ROW][C]24[/C][C]10554.27[/C][C]10691.5407262693[/C][C]-137.270726269315[/C][/ROW]
[ROW][C]25[/C][C]10532.54[/C][C]10839.1693311258[/C][C]-306.629331125829[/C][/ROW]
[ROW][C]26[/C][C]10324.31[/C][C]11174.532[/C][C]-850.222[/C][/ROW]
[ROW][C]27[/C][C]10695.25[/C][C]11250.97[/C][C]-555.72[/C][/ROW]
[ROW][C]28[/C][C]10827.81[/C][C]11729.2529039735[/C][C]-901.44290397351[/C][/ROW]
[ROW][C]29[/C][C]10872.48[/C][C]11647.7809039735[/C][C]-775.30090397351[/C][/ROW]
[ROW][C]30[/C][C]10971.19[/C][C]11716.6969039735[/C][C]-745.50690397351[/C][/ROW]
[ROW][C]31[/C][C]11145.65[/C][C]11569.9409039735[/C][C]-424.29090397351[/C][/ROW]
[ROW][C]32[/C][C]11234.68[/C][C]11716.7109039735[/C][C]-482.030903973509[/C][/ROW]
[ROW][C]33[/C][C]11333.88[/C][C]11852.0209039735[/C][C]-518.14090397351[/C][/ROW]
[ROW][C]34[/C][C]10997.97[/C][C]11724.4509039735[/C][C]-726.48090397351[/C][/ROW]
[ROW][C]35[/C][C]11036.89[/C][C]11593.1749039735[/C][C]-556.28490397351[/C][/ROW]
[ROW][C]36[/C][C]11257.35[/C][C]11570.1469039735[/C][C]-312.796903973509[/C][/ROW]
[ROW][C]37[/C][C]11533.59[/C][C]11717.7755088300[/C][C]-184.185508830024[/C][/ROW]
[ROW][C]38[/C][C]11963.12[/C][C]12053.1381777042[/C][C]-90.0181777041935[/C][/ROW]
[ROW][C]39[/C][C]12185.15[/C][C]12129.5761777042[/C][C]55.5738222958057[/C][/ROW]
[ROW][C]40[/C][C]12377.62[/C][C]12607.8590816777[/C][C]-230.239081677703[/C][/ROW]
[ROW][C]41[/C][C]12512.89[/C][C]12526.3870816777[/C][C]-13.4970816777046[/C][/ROW]
[ROW][C]42[/C][C]12631.48[/C][C]12595.3030816777[/C][C]36.1769183222954[/C][/ROW]
[ROW][C]43[/C][C]12268.53[/C][C]12448.5470816777[/C][C]-180.017081677703[/C][/ROW]
[ROW][C]44[/C][C]12754.8[/C][C]12595.3170816777[/C][C]159.482918322296[/C][/ROW]
[ROW][C]45[/C][C]13407.75[/C][C]12730.6270816777[/C][C]677.122918322296[/C][/ROW]
[ROW][C]46[/C][C]13480.21[/C][C]12603.0570816777[/C][C]877.152918322296[/C][/ROW]
[ROW][C]47[/C][C]13673.28[/C][C]12471.7810816777[/C][C]1201.49891832230[/C][/ROW]
[ROW][C]48[/C][C]13239.71[/C][C]12448.7530816777[/C][C]790.956918322295[/C][/ROW]
[ROW][C]49[/C][C]13557.69[/C][C]12596.3816865342[/C][C]961.308313465782[/C][/ROW]
[ROW][C]50[/C][C]13901.28[/C][C]12931.7443554084[/C][C]969.535644591612[/C][/ROW]
[ROW][C]51[/C][C]13200.58[/C][C]13008.1823554084[/C][C]192.397644591611[/C][/ROW]
[ROW][C]52[/C][C]13406.97[/C][C]12250.6107395143[/C][C]1156.35926048565[/C][/ROW]
[ROW][C]53[/C][C]12538.12[/C][C]12169.1387395143[/C][C]368.981260485652[/C][/ROW]
[ROW][C]54[/C][C]12419.57[/C][C]12238.0547395143[/C][C]181.515260485651[/C][/ROW]
[ROW][C]55[/C][C]12193.88[/C][C]12091.2987395143[/C][C]102.581260485651[/C][/ROW]
[ROW][C]56[/C][C]12656.63[/C][C]12238.0687395143[/C][C]418.561260485651[/C][/ROW]
[ROW][C]57[/C][C]12812.48[/C][C]12373.3787395143[/C][C]439.101260485651[/C][/ROW]
[ROW][C]58[/C][C]12056.67[/C][C]12245.8087395143[/C][C]-189.138739514348[/C][/ROW]
[ROW][C]59[/C][C]11322.38[/C][C]12114.5327395143[/C][C]-792.152739514349[/C][/ROW]
[ROW][C]60[/C][C]11530.75[/C][C]12091.5047395143[/C][C]-560.754739514348[/C][/ROW]
[ROW][C]61[/C][C]11114.08[/C][C]12239.1333443709[/C][C]-1125.05334437086[/C][/ROW]
[/TABLE]
Source: https://freestatistics.org/blog/index.php?pk=25747&T=4

Globally Unique Identifier (entire table): ba.freestatistics.org/blog/index.php?pk=25747&T=4

As an alternative you can also use a QR Code:  

The GUIDs for individual cells are displayed in the table below:

Multiple Linear Regression - Actuals, Interpolation, and Residuals
Time or IndexActualsInterpolationForecastResidualsPrediction Error
19492.499081.95697571743410.533024282568
29682.359417.31964459161265.030355408389
39762.129493.75764459161268.362355408389
410124.639972.04054856512152.589451434878
510540.059890.56854856512649.481451434878
610601.619959.48454856512642.125451434878
710323.739812.72854856512511.001451434878
810418.49959.49854856512458.901451434877
910092.9610094.8085485651-1.8485485651222
1010364.919967.23854856512397.671451434878
1110152.099835.96254856512316.127451434879
1210032.89812.93454856512219.865451434877
1310204.599960.56315342164244.026846578365
1410001.610295.9258222958-294.325822295806
1510411.7510372.363822295839.3861777041938
1610673.3810850.6467262693-177.266726269316
1710539.5110769.1747262693-229.664726269316
1810723.7810838.0907262693-114.310726269315
1910682.0610691.3347262693-9.27472626931606
2010283.1910838.1047262693-554.914726269315
2110377.1810973.4147262693-596.234726269315
2210486.6410845.8447262693-359.204726269316
2310545.3810714.5687262693-169.188726269317
2410554.2710691.5407262693-137.270726269315
2510532.5410839.1693311258-306.629331125829
2610324.3111174.532-850.222
2710695.2511250.97-555.72
2810827.8111729.2529039735-901.44290397351
2910872.4811647.7809039735-775.30090397351
3010971.1911716.6969039735-745.50690397351
3111145.6511569.9409039735-424.29090397351
3211234.6811716.7109039735-482.030903973509
3311333.8811852.0209039735-518.14090397351
3410997.9711724.4509039735-726.48090397351
3511036.8911593.1749039735-556.28490397351
3611257.3511570.1469039735-312.796903973509
3711533.5911717.7755088300-184.185508830024
3811963.1212053.1381777042-90.0181777041935
3912185.1512129.576177704255.5738222958057
4012377.6212607.8590816777-230.239081677703
4112512.8912526.3870816777-13.4970816777046
4212631.4812595.303081677736.1769183222954
4312268.5312448.5470816777-180.017081677703
4412754.812595.3170816777159.482918322296
4513407.7512730.6270816777677.122918322296
4613480.2112603.0570816777877.152918322296
4713673.2812471.78108167771201.49891832230
4813239.7112448.7530816777790.956918322295
4913557.6912596.3816865342961.308313465782
5013901.2812931.7443554084969.535644591612
5113200.5813008.1823554084192.397644591611
5213406.9712250.61073951431156.35926048565
5312538.1212169.1387395143368.981260485652
5412419.5712238.0547395143181.515260485651
5512193.8812091.2987395143102.581260485651
5612656.6312238.0687395143418.561260485651
5712812.4812373.3787395143439.101260485651
5812056.6712245.8087395143-189.138739514348
5911322.3812114.5327395143-792.152739514349
6011530.7512091.5047395143-560.754739514348
6111114.0812239.1333443709-1125.05334437086


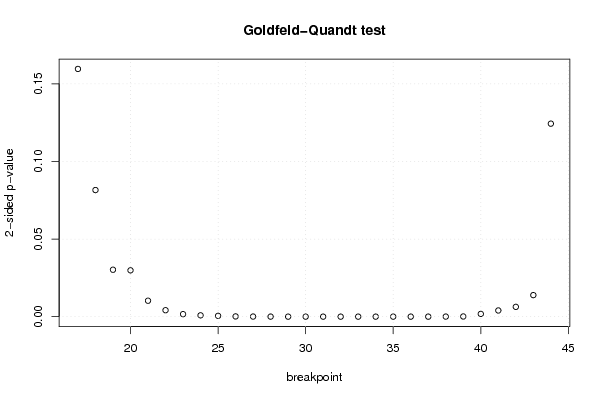
Goldfeld-Quandt test for Heteroskedasticity
p-valuesAlternative Hypothesis
breakpoint indexgreater2-sidedless
170.07976834589971040.1595366917994210.92023165410029
180.04076976399961770.08153952799923530.959230236000382
190.01510746192583080.03021492385166160.98489253807417
200.01492142244212080.02984284488424160.98507857755788
210.00513155328815930.01026310657631860.99486844671184
220.002070076484446740.004140152968893480.997929923515553
230.0008082217268971570.001616443453794310.999191778273103
240.0004245335098767250.000849067019753450.999575466490123
250.0002549898104369860.0005099796208739720.999745010189563
267.62195630245815e-050.0001524391260491630.999923780436975
272.79219412529930e-055.58438825059859e-050.999972078058747
281.06908923154304e-052.13817846308609e-050.999989309107685
294.07114980227251e-068.14229960454502e-060.999995928850198
301.50299623663067e-063.00599247326133e-060.999998497003763
314.97476584079894e-079.94953168159788e-070.999999502523416
324.97925320752736e-079.95850641505472e-070.99999950207468
331.79851823834771e-063.59703647669542e-060.999998201481762
346.50386347954785e-071.30077269590957e-060.999999349613652
352.10908525903915e-074.21817051807829e-070.999999789091474
361.47544380638936e-072.95088761277872e-070.99999985245562
375.32436786639239e-071.06487357327848e-060.999999467563213
382.05723587027688e-054.11447174055375e-050.999979427641297
395.34866323471539e-050.0001069732646943080.999946513367653
400.0008876372672560750.001775274534512150.999112362732744
410.001987847515135420.003975695030270850.998012152484865
420.003155695248380850.00631139049676170.99684430475162
430.006930463981264850.01386092796252970.993069536018735
440.06214465874563130.1242893174912630.937855341254369

\begin{tabular}{lllllllll}
\hline
Goldfeld-Quandt test for Heteroskedasticity \tabularnewline
p-values & Alternative Hypothesis \tabularnewline
breakpoint index & greater & 2-sided & less \tabularnewline
17 & 0.0797683458997104 & 0.159536691799421 & 0.92023165410029 \tabularnewline
18 & 0.0407697639996177 & 0.0815395279992353 & 0.959230236000382 \tabularnewline
19 & 0.0151074619258308 & 0.0302149238516616 & 0.98489253807417 \tabularnewline
20 & 0.0149214224421208 & 0.0298428448842416 & 0.98507857755788 \tabularnewline
21 & 0.0051315532881593 & 0.0102631065763186 & 0.99486844671184 \tabularnewline
22 & 0.00207007648444674 & 0.00414015296889348 & 0.997929923515553 \tabularnewline
23 & 0.000808221726897157 & 0.00161644345379431 & 0.999191778273103 \tabularnewline
24 & 0.000424533509876725 & 0.00084906701975345 & 0.999575466490123 \tabularnewline
25 & 0.000254989810436986 & 0.000509979620873972 & 0.999745010189563 \tabularnewline
26 & 7.62195630245815e-05 & 0.000152439126049163 & 0.999923780436975 \tabularnewline
27 & 2.79219412529930e-05 & 5.58438825059859e-05 & 0.999972078058747 \tabularnewline
28 & 1.06908923154304e-05 & 2.13817846308609e-05 & 0.999989309107685 \tabularnewline
29 & 4.07114980227251e-06 & 8.14229960454502e-06 & 0.999995928850198 \tabularnewline
30 & 1.50299623663067e-06 & 3.00599247326133e-06 & 0.999998497003763 \tabularnewline
31 & 4.97476584079894e-07 & 9.94953168159788e-07 & 0.999999502523416 \tabularnewline
32 & 4.97925320752736e-07 & 9.95850641505472e-07 & 0.99999950207468 \tabularnewline
33 & 1.79851823834771e-06 & 3.59703647669542e-06 & 0.999998201481762 \tabularnewline
34 & 6.50386347954785e-07 & 1.30077269590957e-06 & 0.999999349613652 \tabularnewline
35 & 2.10908525903915e-07 & 4.21817051807829e-07 & 0.999999789091474 \tabularnewline
36 & 1.47544380638936e-07 & 2.95088761277872e-07 & 0.99999985245562 \tabularnewline
37 & 5.32436786639239e-07 & 1.06487357327848e-06 & 0.999999467563213 \tabularnewline
38 & 2.05723587027688e-05 & 4.11447174055375e-05 & 0.999979427641297 \tabularnewline
39 & 5.34866323471539e-05 & 0.000106973264694308 & 0.999946513367653 \tabularnewline
40 & 0.000887637267256075 & 0.00177527453451215 & 0.999112362732744 \tabularnewline
41 & 0.00198784751513542 & 0.00397569503027085 & 0.998012152484865 \tabularnewline
42 & 0.00315569524838085 & 0.0063113904967617 & 0.99684430475162 \tabularnewline
43 & 0.00693046398126485 & 0.0138609279625297 & 0.993069536018735 \tabularnewline
44 & 0.0621446587456313 & 0.124289317491263 & 0.937855341254369 \tabularnewline
\hline
\end{tabular}
%Source: https://freestatistics.org/blog/index.php?pk=25747&T=5

[TABLE]
[ROW][C]Goldfeld-Quandt test for Heteroskedasticity[/C][/ROW]
[ROW][C]p-values[/C][C]Alternative Hypothesis[/C][/ROW]
[ROW][C]breakpoint index[/C][C]greater[/C][C]2-sided[/C][C]less[/C][/ROW]
[ROW][C]17[/C][C]0.0797683458997104[/C][C]0.159536691799421[/C][C]0.92023165410029[/C][/ROW]
[ROW][C]18[/C][C]0.0407697639996177[/C][C]0.0815395279992353[/C][C]0.959230236000382[/C][/ROW]
[ROW][C]19[/C][C]0.0151074619258308[/C][C]0.0302149238516616[/C][C]0.98489253807417[/C][/ROW]
[ROW][C]20[/C][C]0.0149214224421208[/C][C]0.0298428448842416[/C][C]0.98507857755788[/C][/ROW]
[ROW][C]21[/C][C]0.0051315532881593[/C][C]0.0102631065763186[/C][C]0.99486844671184[/C][/ROW]
[ROW][C]22[/C][C]0.00207007648444674[/C][C]0.00414015296889348[/C][C]0.997929923515553[/C][/ROW]
[ROW][C]23[/C][C]0.000808221726897157[/C][C]0.00161644345379431[/C][C]0.999191778273103[/C][/ROW]
[ROW][C]24[/C][C]0.000424533509876725[/C][C]0.00084906701975345[/C][C]0.999575466490123[/C][/ROW]
[ROW][C]25[/C][C]0.000254989810436986[/C][C]0.000509979620873972[/C][C]0.999745010189563[/C][/ROW]
[ROW][C]26[/C][C]7.62195630245815e-05[/C][C]0.000152439126049163[/C][C]0.999923780436975[/C][/ROW]
[ROW][C]27[/C][C]2.79219412529930e-05[/C][C]5.58438825059859e-05[/C][C]0.999972078058747[/C][/ROW]
[ROW][C]28[/C][C]1.06908923154304e-05[/C][C]2.13817846308609e-05[/C][C]0.999989309107685[/C][/ROW]
[ROW][C]29[/C][C]4.07114980227251e-06[/C][C]8.14229960454502e-06[/C][C]0.999995928850198[/C][/ROW]
[ROW][C]30[/C][C]1.50299623663067e-06[/C][C]3.00599247326133e-06[/C][C]0.999998497003763[/C][/ROW]
[ROW][C]31[/C][C]4.97476584079894e-07[/C][C]9.94953168159788e-07[/C][C]0.999999502523416[/C][/ROW]
[ROW][C]32[/C][C]4.97925320752736e-07[/C][C]9.95850641505472e-07[/C][C]0.99999950207468[/C][/ROW]
[ROW][C]33[/C][C]1.79851823834771e-06[/C][C]3.59703647669542e-06[/C][C]0.999998201481762[/C][/ROW]
[ROW][C]34[/C][C]6.50386347954785e-07[/C][C]1.30077269590957e-06[/C][C]0.999999349613652[/C][/ROW]
[ROW][C]35[/C][C]2.10908525903915e-07[/C][C]4.21817051807829e-07[/C][C]0.999999789091474[/C][/ROW]
[ROW][C]36[/C][C]1.47544380638936e-07[/C][C]2.95088761277872e-07[/C][C]0.99999985245562[/C][/ROW]
[ROW][C]37[/C][C]5.32436786639239e-07[/C][C]1.06487357327848e-06[/C][C]0.999999467563213[/C][/ROW]
[ROW][C]38[/C][C]2.05723587027688e-05[/C][C]4.11447174055375e-05[/C][C]0.999979427641297[/C][/ROW]
[ROW][C]39[/C][C]5.34866323471539e-05[/C][C]0.000106973264694308[/C][C]0.999946513367653[/C][/ROW]
[ROW][C]40[/C][C]0.000887637267256075[/C][C]0.00177527453451215[/C][C]0.999112362732744[/C][/ROW]
[ROW][C]41[/C][C]0.00198784751513542[/C][C]0.00397569503027085[/C][C]0.998012152484865[/C][/ROW]
[ROW][C]42[/C][C]0.00315569524838085[/C][C]0.0063113904967617[/C][C]0.99684430475162[/C][/ROW]
[ROW][C]43[/C][C]0.00693046398126485[/C][C]0.0138609279625297[/C][C]0.993069536018735[/C][/ROW]
[ROW][C]44[/C][C]0.0621446587456313[/C][C]0.124289317491263[/C][C]0.937855341254369[/C][/ROW]
[/TABLE]
Source: https://freestatistics.org/blog/index.php?pk=25747&T=5

Globally Unique Identifier (entire table): ba.freestatistics.org/blog/index.php?pk=25747&T=5

As an alternative you can also use a QR Code:  

The GUIDs for individual cells are displayed in the table below:

Goldfeld-Quandt test for Heteroskedasticity
p-valuesAlternative Hypothesis
breakpoint indexgreater2-sidedless
170.07976834589971040.1595366917994210.92023165410029
180.04076976399961770.08153952799923530.959230236000382
190.01510746192583080.03021492385166160.98489253807417
200.01492142244212080.02984284488424160.98507857755788
210.00513155328815930.01026310657631860.99486844671184
220.002070076484446740.004140152968893480.997929923515553
230.0008082217268971570.001616443453794310.999191778273103
240.0004245335098767250.000849067019753450.999575466490123
250.0002549898104369860.0005099796208739720.999745010189563
267.62195630245815e-050.0001524391260491630.999923780436975
272.79219412529930e-055.58438825059859e-050.999972078058747
281.06908923154304e-052.13817846308609e-050.999989309107685
294.07114980227251e-068.14229960454502e-060.999995928850198
301.50299623663067e-063.00599247326133e-060.999998497003763
314.97476584079894e-079.94953168159788e-070.999999502523416
324.97925320752736e-079.95850641505472e-070.99999950207468
331.79851823834771e-063.59703647669542e-060.999998201481762
346.50386347954785e-071.30077269590957e-060.999999349613652
352.10908525903915e-074.21817051807829e-070.999999789091474
361.47544380638936e-072.95088761277872e-070.99999985245562
375.32436786639239e-071.06487357327848e-060.999999467563213
382.05723587027688e-054.11447174055375e-050.999979427641297
395.34866323471539e-050.0001069732646943080.999946513367653
400.0008876372672560750.001775274534512150.999112362732744
410.001987847515135420.003975695030270850.998012152484865
420.003155695248380850.00631139049676170.99684430475162
430.006930463981264850.01386092796252970.993069536018735
440.06214465874563130.1242893174912630.937855341254369


Meta Analysis of Goldfeld-Quandt test for Heteroskedasticity
Description# significant tests% significant testsOK/NOK
1% type I error level210.75NOK
5% type I error level250.892857142857143NOK
10% type I error level260.928571428571429NOK

\begin{tabular}{lllllllll}
\hline
Meta Analysis of Goldfeld-Quandt test for Heteroskedasticity \tabularnewline
Description & # significant tests & % significant tests & OK/NOK \tabularnewline
1% type I error level & 21 & 0.75 & NOK \tabularnewline
5% type I error level & 25 & 0.892857142857143 & NOK \tabularnewline
10% type I error level & 26 & 0.928571428571429 & NOK \tabularnewline
\hline
\end{tabular}
%Source: https://freestatistics.org/blog/index.php?pk=25747&T=6

[TABLE]
[ROW][C]Meta Analysis of Goldfeld-Quandt test for Heteroskedasticity[/C][/ROW]
[ROW][C]Description[/C][C]# significant tests[/C][C]% significant tests[/C][C]OK/NOK[/C][/ROW]
[ROW][C]1% type I error level[/C][C]21[/C][C]0.75[/C][C]NOK[/C][/ROW]
[ROW][C]5% type I error level[/C][C]25[/C][C]0.892857142857143[/C][C]NOK[/C][/ROW]
[ROW][C]10% type I error level[/C][C]26[/C][C]0.928571428571429[/C][C]NOK[/C][/ROW]
[/TABLE]
Source: https://freestatistics.org/blog/index.php?pk=25747&T=6

Globally Unique Identifier (entire table): ba.freestatistics.org/blog/index.php?pk=25747&T=6

As an alternative you can also use a QR Code:  

The GUIDs for individual cells are displayed in the table below:

Meta Analysis of Goldfeld-Quandt test for Heteroskedasticity
Description# significant tests% significant testsOK/NOK
1% type I error level210.75NOK
5% type I error level250.892857142857143NOK
10% type I error level260.928571428571429NOK


Parameters (Session):
par1 = 1 ; par2 = Include Monthly Dummies ; par3 = Linear Trend ;
Parameters (R input):
par1 = 1 ; par2 = Include Monthly Dummies ; par3 = Linear Trend ;
R code (references can be found in the software module):
library(lattice)
library(lmtest)
n25 <- 25 #minimum number of obs. for Goldfeld-Quandt test
par1 <- as.numeric(par1)
x <- t(y)
k <- length(x[1,])
n <- length(x[,1])
x1 <- cbind(x[,par1], x[,1:k!=par1])
mycolnames <- c(colnames(x)[par1], colnames(x)[1:k!=par1])
colnames(x1) <- mycolnames #colnames(x)[par1]
x <- x1
if (par3 == 'First Differences'){
x2 <- array(0, dim=c(n-1,k), dimnames=list(1:(n-1), paste('(1-B)',colnames(x),sep='')))
for (i in 1:n-1) {
for (j in 1:k) {
x2[i,j] <- x[i+1,j] - x[i,j]
}
}
x <- x2
}
if (par2 == 'Include Monthly Dummies'){
x2 <- array(0, dim=c(n,11), dimnames=list(1:n, paste('M', seq(1:11), sep ='')))
for (i in 1:11){
x2[seq(i,n,12),i] <- 1
}
x <- cbind(x, x2)
}
if (par2 == 'Include Quarterly Dummies'){
x2 <- array(0, dim=c(n,3), dimnames=list(1:n, paste('Q', seq(1:3), sep ='')))
for (i in 1:3){
x2[seq(i,n,4),i] <- 1
}
x <- cbind(x, x2)
}
k <- length(x[1,])
if (par3 == 'Linear Trend'){
x <- cbind(x, c(1:n))
colnames(x)[k+1] <- 't'
}
x
k <- length(x[1,])
df <- as.data.frame(x)
(mylm <- lm(df))
(mysum <- summary(mylm))
if (n > n25) {
kp3 <- k + 3
nmkm3 <- n - k - 3
gqarr <- array(NA, dim=c(nmkm3-kp3+1,3))
numgqtests <- 0
numsignificant1 <- 0
numsignificant5 <- 0
numsignificant10 <- 0
for (mypoint in kp3:nmkm3) {
j <- 0
numgqtests <- numgqtests + 1
for (myalt in c('greater', 'two.sided', 'less')) {
j <- j + 1
gqarr[mypoint-kp3+1,j] <- gqtest(mylm, point=mypoint, alternative=myalt)$p.value
}
if (gqarr[mypoint-kp3+1,2] < 0.01) numsignificant1 <- numsignificant1 + 1
if (gqarr[mypoint-kp3+1,2] < 0.05) numsignificant5 <- numsignificant5 + 1
if (gqarr[mypoint-kp3+1,2] < 0.10) numsignificant10 <- numsignificant10 + 1
}
gqarr
}
bitmap(file='test0.png')
plot(x[,1], type='l', main='Actuals and Interpolation', ylab='value of Actuals and Interpolation (dots)', xlab='time or index')
points(x[,1]-mysum$resid)
grid()
dev.off()
bitmap(file='test1.png')
plot(mysum$resid, type='b', pch=19, main='Residuals', ylab='value of Residuals', xlab='time or index')
grid()
dev.off()
bitmap(file='test2.png')
hist(mysum$resid, main='Residual Histogram', xlab='values of Residuals')
grid()
dev.off()
bitmap(file='test3.png')
densityplot(~mysum$resid,col='black',main='Residual Density Plot', xlab='values of Residuals')
dev.off()
bitmap(file='test4.png')
qqnorm(mysum$resid, main='Residual Normal Q-Q Plot')
qqline(mysum$resid)
grid()
dev.off()
(myerror <- as.ts(mysum$resid))
bitmap(file='test5.png')
dum <- cbind(lag(myerror,k=1),myerror)
dum
dum1 <- dum[2:length(myerror),]
dum1
z <- as.data.frame(dum1)
z
plot(z,main=paste('Residual Lag plot, lowess, and regression line'), ylab='values of Residuals', xlab='lagged values of Residuals')
lines(lowess(z))
abline(lm(z))
grid()
dev.off()
bitmap(file='test6.png')
acf(mysum$resid, lag.max=length(mysum$resid)/2, main='Residual Autocorrelation Function')
grid()
dev.off()
bitmap(file='test7.png')
pacf(mysum$resid, lag.max=length(mysum$resid)/2, main='Residual Partial Autocorrelation Function')
grid()
dev.off()
bitmap(file='test8.png')
opar <- par(mfrow = c(2,2), oma = c(0, 0, 1.1, 0))
plot(mylm, las = 1, sub='Residual Diagnostics')
par(opar)
dev.off()
if (n > n25) {
bitmap(file='test9.png')
plot(kp3:nmkm3,gqarr[,2], main='Goldfeld-Quandt test',ylab='2-sided p-value',xlab='breakpoint')
grid()
dev.off()
}
load(file='createtable')
a<-table.start()
a<-table.row.start(a)
a<-table.element(a, 'Multiple Linear Regression - Estimated Regression Equation', 1, TRUE)
a<-table.row.end(a)
myeq <- colnames(x)[1]
myeq <- paste(myeq, '[t] = ', sep='')
for (i in 1:k){
if (mysum$coefficients[i,1] > 0) myeq <- paste(myeq, '+', '')
myeq <- paste(myeq, mysum$coefficients[i,1], sep=' ')
if (rownames(mysum$coefficients)[i] != '(Intercept)') {
myeq <- paste(myeq, rownames(mysum$coefficients)[i], sep='')
if (rownames(mysum$coefficients)[i] != 't') myeq <- paste(myeq, '[t]', sep='')
}
}
myeq <- paste(myeq, ' + e[t]')
a<-table.row.start(a)
a<-table.element(a, myeq)
a<-table.row.end(a)
a<-table.end(a)
table.save(a,file='mytable1.tab')
a<-table.start()
a<-table.row.start(a)
a<-table.element(a,hyperlink('ols1.htm','Multiple Linear Regression - Ordinary Least Squares',''), 6, TRUE)
a<-table.row.end(a)
a<-table.row.start(a)
a<-table.element(a,'Variable',header=TRUE)
a<-table.element(a,'Parameter',header=TRUE)
a<-table.element(a,'S.D.',header=TRUE)
a<-table.element(a,'T-STAT
H0: parameter = 0',header=TRUE)
a<-table.element(a,'2-tail p-value',header=TRUE)
a<-table.element(a,'1-tail p-value',header=TRUE)
a<-table.row.end(a)
for (i in 1:k){
a<-table.row.start(a)
a<-table.element(a,rownames(mysum$coefficients)[i],header=TRUE)
a<-table.element(a,mysum$coefficients[i,1])
a<-table.element(a, round(mysum$coefficients[i,2],6))
a<-table.element(a, round(mysum$coefficients[i,3],4))
a<-table.element(a, round(mysum$coefficients[i,4],6))
a<-table.element(a, round(mysum$coefficients[i,4]/2,6))
a<-table.row.end(a)
}
a<-table.end(a)
table.save(a,file='mytable2.tab')
a<-table.start()
a<-table.row.start(a)
a<-table.element(a, 'Multiple Linear Regression - Regression Statistics', 2, TRUE)
a<-table.row.end(a)
a<-table.row.start(a)
a<-table.element(a, 'Multiple R',1,TRUE)
a<-table.element(a, sqrt(mysum$r.squared))
a<-table.row.end(a)
a<-table.row.start(a)
a<-table.element(a, 'R-squared',1,TRUE)
a<-table.element(a, mysum$r.squared)
a<-table.row.end(a)
a<-table.row.start(a)
a<-table.element(a, 'Adjusted R-squared',1,TRUE)
a<-table.element(a, mysum$adj.r.squared)
a<-table.row.end(a)
a<-table.row.start(a)
a<-table.element(a, 'F-TEST (value)',1,TRUE)
a<-table.element(a, mysum$fstatistic[1])
a<-table.row.end(a)
a<-table.row.start(a)
a<-table.element(a, 'F-TEST (DF numerator)',1,TRUE)
a<-table.element(a, mysum$fstatistic[2])
a<-table.row.end(a)
a<-table.row.start(a)
a<-table.element(a, 'F-TEST (DF denominator)',1,TRUE)
a<-table.element(a, mysum$fstatistic[3])
a<-table.row.end(a)
a<-table.row.start(a)
a<-table.element(a, 'p-value',1,TRUE)
a<-table.element(a, 1-pf(mysum$fstatistic[1],mysum$fstatistic[2],mysum$fstatistic[3]))
a<-table.row.end(a)
a<-table.row.start(a)
a<-table.element(a, 'Multiple Linear Regression - Residual Statistics', 2, TRUE)
a<-table.row.end(a)
a<-table.row.start(a)
a<-table.element(a, 'Residual Standard Deviation',1,TRUE)
a<-table.element(a, mysum$sigma)
a<-table.row.end(a)
a<-table.row.start(a)
a<-table.element(a, 'Sum Squared Residuals',1,TRUE)
a<-table.element(a, sum(myerror*myerror))
a<-table.row.end(a)
a<-table.end(a)
table.save(a,file='mytable3.tab')
a<-table.start()
a<-table.row.start(a)
a<-table.element(a, 'Multiple Linear Regression - Actuals, Interpolation, and Residuals', 4, TRUE)
a<-table.row.end(a)
a<-table.row.start(a)
a<-table.element(a, 'Time or Index', 1, TRUE)
a<-table.element(a, 'Actuals', 1, TRUE)
a<-table.element(a, 'Interpolation
Forecast', 1, TRUE)
a<-table.element(a, 'Residuals
Prediction Error', 1, TRUE)
a<-table.row.end(a)
for (i in 1:n) {
a<-table.row.start(a)
a<-table.element(a,i, 1, TRUE)
a<-table.element(a,x[i])
a<-table.element(a,x[i]-mysum$resid[i])
a<-table.element(a,mysum$resid[i])
a<-table.row.end(a)
}
a<-table.end(a)
table.save(a,file='mytable4.tab')
if (n > n25) {
a<-table.start()
a<-table.row.start(a)
a<-table.element(a,'Goldfeld-Quandt test for Heteroskedasticity',4,TRUE)
a<-table.row.end(a)
a<-table.row.start(a)
a<-table.element(a,'p-values',header=TRUE)
a<-table.element(a,'Alternative Hypothesis',3,header=TRUE)
a<-table.row.end(a)
a<-table.row.start(a)
a<-table.element(a,'breakpoint index',header=TRUE)
a<-table.element(a,'greater',header=TRUE)
a<-table.element(a,'2-sided',header=TRUE)
a<-table.element(a,'less',header=TRUE)
a<-table.row.end(a)
for (mypoint in kp3:nmkm3) {
a<-table.row.start(a)
a<-table.element(a,mypoint,header=TRUE)
a<-table.element(a,gqarr[mypoint-kp3+1,1])
a<-table.element(a,gqarr[mypoint-kp3+1,2])
a<-table.element(a,gqarr[mypoint-kp3+1,3])
a<-table.row.end(a)
}
a<-table.end(a)
table.save(a,file='mytable5.tab')
a<-table.start()
a<-table.row.start(a)
a<-table.element(a,'Meta Analysis of Goldfeld-Quandt test for Heteroskedasticity',4,TRUE)
a<-table.row.end(a)
a<-table.row.start(a)
a<-table.element(a,'Description',header=TRUE)
a<-table.element(a,'# significant tests',header=TRUE)
a<-table.element(a,'% significant tests',header=TRUE)
a<-table.element(a,'OK/NOK',header=TRUE)
a<-table.row.end(a)
a<-table.row.start(a)
a<-table.element(a,'1% type I error level',header=TRUE)
a<-table.element(a,numsignificant1)
a<-table.element(a,numsignificant1/numgqtests)
if (numsignificant1/numgqtests < 0.01) dum <- 'OK' else dum <- 'NOK'
a<-table.element(a,dum)
a<-table.row.end(a)
a<-table.row.start(a)
a<-table.element(a,'5% type I error level',header=TRUE)
a<-table.element(a,numsignificant5)
a<-table.element(a,numsignificant5/numgqtests)
if (numsignificant5/numgqtests < 0.05) dum <- 'OK' else dum <- 'NOK'
a<-table.element(a,dum)
a<-table.row.end(a)
a<-table.row.start(a)
a<-table.element(a,'10% type I error level',header=TRUE)
a<-table.element(a,numsignificant10)
a<-table.element(a,numsignificant10/numgqtests)
if (numsignificant10/numgqtests < 0.1) dum <- 'OK' else dum <- 'NOK'
a<-table.element(a,dum)
a<-table.row.end(a)
a<-table.end(a)
table.save(a,file='mytable6.tab')
}