Free Statistics

of Irreproducible Research!

Author's title

Author*The author of this computation has been verified*
R Software Modulerwasp_multipleregression.wasp
Title produced by softwareMultiple Regression
Date of computationThu, 27 Nov 2008 02:16:09 -0700
Cite this page as followsStatistical Computations at FreeStatistics.org, Office for Research Development and Education, URL https://freestatistics.org/blog/index.php?v=date/2008/Nov/27/t1227777505fa50lu7psybwly6.htm/, Retrieved Sun, 19 May 2024 11:12:21 +0000
Statistical Computations at FreeStatistics.org, Office for Research Development and Education, URL https://freestatistics.org/blog/index.php?pk=25735, Retrieved Sun, 19 May 2024 11:12:21 +0000
QR Codes:

Original text written by user:
IsPrivate?No (this computation is public)
User-defined keywordsjenske_cole@hotmail.com
Estimated Impact189
Family? (F = Feedback message, R = changed R code, M = changed R Module, P = changed Parameters, D = changed Data)
-     [Multiple Regression] [Q1 The Seatbeltlaw] [2007-11-14 19:27:43] [8cd6641b921d30ebe00b648d1481bba0]
F R PD    [Multiple Regression] [seatbelt law q3] [2008-11-27 09:16:09] [120dfa2440e51a0cfc0f5296bc5d7460] [Current]
Feedback Forum
2008-12-01 15:20:57 [Erik Geysen] [reply
De R-squared is hier zeer laag, dit wilt zeggen dat we niet veel kunnen verklaren. De student heeft de partial residual autocorrelation fonction bijgevoegt aan haar werk en mede a.d.v. deze uitspraken gedaan. Ze had eig de residual autocorrelation fonction moeten bijvoegen. De ene maand stijgt de prijs en de andere maand daalt ze weer. Bij de residual autocorrelation fonction kan je zien dat er veel meer gegevens buiten het betrouwbaarheidsinterval liggen dan bij de partial residual autocorrelation fonction. Omdat r^2 zo klein is en vele gegevens buiten dit betrouwbaarheidsinterval ligt, kan je volgens mij geen voorspellingen doen. We zien bij de residuals wel dat er een stijgende trend is.
2008-12-01 23:03:36 [Tinneke De Bock] [reply
Meer uitleg was zeker nog mogelijk:
- Waarom gebruikte je een model met seizoenaliteit en zonder lineaire trend? Hiervoor kan je eerst een model zonder seizoealiteit en zonder lineaire trend proberen. Als dit model nog verbetert kan worden en je merkt duidelijk de aanwezigheid van seizoenaliteit (golvend patroon) of lineaire trend (dalend of stijgend verloop) kan je dit model aanpassen zoals gewenst.
- De standaardfout is vaak groot tegenover de waarde van de parameter. Dit wil zeggen dat er nog grote afwijkingen kunnen zijn met onze voorspelde waarden, waardoor we hierover moeilijk een uitspraak kunnen doen.
- T-STAT: de absolute waarde voor de t-verdeling is niet altijd groter dan 2,
- Niet alle autocorrelatiecoëfficiënten vallen binnen het betrouwbaarheidsinterval van 95%. Het model is dus nog voor verbetering vatbaar, een patroon is wel niet echt duidelijk te zien.
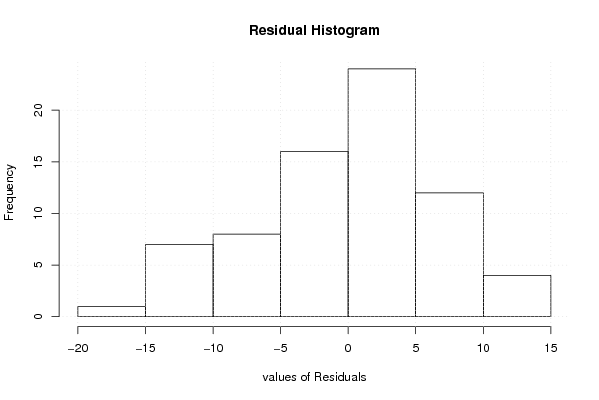
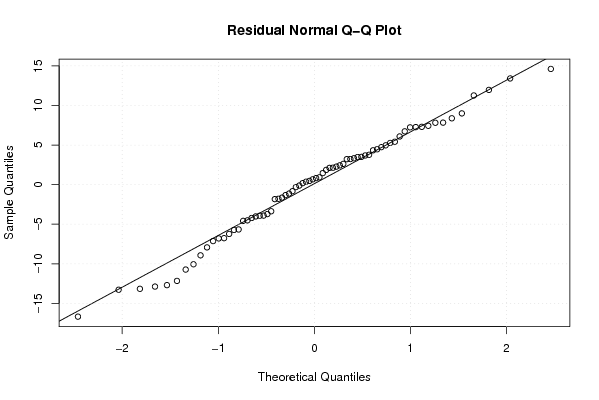
- Het histogram is vrij sterk linksscheef, waar we eigenlijk de normaalverdeling zouden moeten verkrijgen.
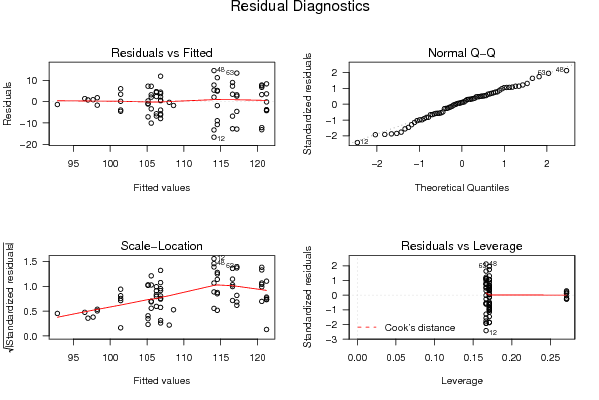
- Bij de residu’s zien we een stijgende lineaire trend. Ook hier is dus nog verbetering mogelijk, ook al zijn ze gemiddeld wel ongeveer gelijk aan 0.

Post a new message
Dataseries X:
98,6	0
98	0
106,8	0
96,6	0
100,1	0
107,7	0
91,5	0
97,8	0
107,4	1
117,5	1
105,6	1
97,4	1
99,5	1
98	1
104,3	1
100,6	1
101,1	1
103,9	1
96,9	1
95,5	1
108,4	1
117	1
103,8	1
100,8	1
110,6	1
104	1
112,6	1
107,3	1
98,9	1
109,8	1
104,9	1
102,2	1
123,9	1
124,9	1
112,7	1
121,9	1
100,6	1
104,3	1
120,4	1
107,5	1
102,9	1
125,6	1
107,5	1
108,8	1
128,4	1
121,1	1
119,5	1
128,7	1
108,7	1
105,5	1
119,8	1
111,3	1
110,6	1
120,1	1
97,5	1
107,7	1
127,3	1
117,2	1
119,8	1
116,2	1
111	1
112,4	1
130,6	1
109,1	1
118,8	1
123,9	1
101,6	1
112,8	1
128	1
129,6	1
125,8	1
119,5	1


Summary of computational transaction
Raw Inputview raw input (R code)
Raw Outputview raw output of R engine
Computing time7 seconds
R Server'Sir Ronald Aylmer Fisher' @ 193.190.124.24

\begin{tabular}{lllllllll}
\hline
Summary of computational transaction \tabularnewline
Raw Input & view raw input (R code)  \tabularnewline
Raw Output & view raw output of R engine  \tabularnewline
Computing time & 7 seconds \tabularnewline
R Server & 'Sir Ronald Aylmer Fisher' @ 193.190.124.24 \tabularnewline
\hline
\end{tabular}
%Source: https://freestatistics.org/blog/index.php?pk=25735&T=0

[TABLE]
[ROW][C]Summary of computational transaction[/C][/ROW]
[ROW][C]Raw Input[/C][C]view raw input (R code) [/C][/ROW]
[ROW][C]Raw Output[/C][C]view raw output of R engine [/C][/ROW]
[ROW][C]Computing time[/C][C]7 seconds[/C][/ROW]
[ROW][C]R Server[/C][C]'Sir Ronald Aylmer Fisher' @ 193.190.124.24[/C][/ROW]
[/TABLE]
Source: https://freestatistics.org/blog/index.php?pk=25735&T=0

Globally Unique Identifier (entire table): ba.freestatistics.org/blog/index.php?pk=25735&T=0

As an alternative you can also use a QR Code:  

The GUIDs for individual cells are displayed in the table below:

Summary of computational transaction
Raw Inputview raw input (R code)
Raw Outputview raw output of R engine
Computing time7 seconds
R Server'Sir Ronald Aylmer Fisher' @ 193.190.124.24


Multiple Linear Regression - Estimated Regression Equation
x[t] = + 105.493333333333 + 8.58999999999997y[t] -7.8183333333333M1[t] -8.95166666666667M2[t] + 3.09833333333333M3[t] -7.25166666666668M4[t] -7.25166666666667M5[t] + 2.51499999999999M6[t] -12.6683333333333M7[t] -8.51833333333334M8[t] + 6.48333333333334M9[t] + 7.13333333333333M10[t] + 0.449999999999998M11[t] + e[t]

\begin{tabular}{lllllllll}
\hline
Multiple Linear Regression - Estimated Regression Equation \tabularnewline
x[t] =  +  105.493333333333 +  8.58999999999997y[t] -7.8183333333333M1[t] -8.95166666666667M2[t] +  3.09833333333333M3[t] -7.25166666666668M4[t] -7.25166666666667M5[t] +  2.51499999999999M6[t] -12.6683333333333M7[t] -8.51833333333334M8[t] +  6.48333333333334M9[t] +  7.13333333333333M10[t] +  0.449999999999998M11[t]  + e[t] \tabularnewline
\hline
\end{tabular}
%Source: https://freestatistics.org/blog/index.php?pk=25735&T=1

[TABLE]
[ROW][C]Multiple Linear Regression - Estimated Regression Equation[/C][/ROW]
[ROW][C]x[t] =  +  105.493333333333 +  8.58999999999997y[t] -7.8183333333333M1[t] -8.95166666666667M2[t] +  3.09833333333333M3[t] -7.25166666666668M4[t] -7.25166666666667M5[t] +  2.51499999999999M6[t] -12.6683333333333M7[t] -8.51833333333334M8[t] +  6.48333333333334M9[t] +  7.13333333333333M10[t] +  0.449999999999998M11[t]  + e[t][/C][/ROW]
[/TABLE]
Source: https://freestatistics.org/blog/index.php?pk=25735&T=1

Globally Unique Identifier (entire table): ba.freestatistics.org/blog/index.php?pk=25735&T=1

As an alternative you can also use a QR Code:  

The GUIDs for individual cells are displayed in the table below:

Multiple Linear Regression - Estimated Regression Equation
x[t] = + 105.493333333333 + 8.58999999999997y[t] -7.8183333333333M1[t] -8.95166666666667M2[t] + 3.09833333333333M3[t] -7.25166666666668M4[t] -7.25166666666667M5[t] + 2.51499999999999M6[t] -12.6683333333333M7[t] -8.51833333333334M8[t] + 6.48333333333334M9[t] + 7.13333333333333M10[t] + 0.449999999999998M11[t] + e[t]


Multiple Linear Regression - Ordinary Least Squares
VariableParameterS.D.T-STATH0: parameter = 02-tail p-value1-tail p-value
(Intercept)105.4933333333334.2398224.881600
y8.589999999999972.9180442.94380.0046310.002316
M1-7.81833333333334.377066-1.78620.0792050.039602
M2-8.951666666666674.377066-2.04510.045310.022655
M33.098333333333334.3770660.70790.4818220.240911
M4-7.251666666666684.377066-1.65670.1028810.05144
M5-7.251666666666674.377066-1.65670.1028810.05144
M62.514999999999994.3770660.57460.5677560.283878
M7-12.66833333333334.377066-2.89430.0053190.00266
M8-8.518333333333344.377066-1.94610.0564070.028203
M96.483333333333344.3499631.49040.1414370.070719
M107.133333333333334.3499631.63990.1063560.053178
M110.4499999999999984.3499630.10340.9179570.458979

\begin{tabular}{lllllllll}
\hline
Multiple Linear Regression - Ordinary Least Squares \tabularnewline
Variable & Parameter & S.D. & T-STATH0: parameter = 0 & 2-tail p-value & 1-tail p-value \tabularnewline
(Intercept) & 105.493333333333 & 4.23982 & 24.8816 & 0 & 0 \tabularnewline
y & 8.58999999999997 & 2.918044 & 2.9438 & 0.004631 & 0.002316 \tabularnewline
M1 & -7.8183333333333 & 4.377066 & -1.7862 & 0.079205 & 0.039602 \tabularnewline
M2 & -8.95166666666667 & 4.377066 & -2.0451 & 0.04531 & 0.022655 \tabularnewline
M3 & 3.09833333333333 & 4.377066 & 0.7079 & 0.481822 & 0.240911 \tabularnewline
M4 & -7.25166666666668 & 4.377066 & -1.6567 & 0.102881 & 0.05144 \tabularnewline
M5 & -7.25166666666667 & 4.377066 & -1.6567 & 0.102881 & 0.05144 \tabularnewline
M6 & 2.51499999999999 & 4.377066 & 0.5746 & 0.567756 & 0.283878 \tabularnewline
M7 & -12.6683333333333 & 4.377066 & -2.8943 & 0.005319 & 0.00266 \tabularnewline
M8 & -8.51833333333334 & 4.377066 & -1.9461 & 0.056407 & 0.028203 \tabularnewline
M9 & 6.48333333333334 & 4.349963 & 1.4904 & 0.141437 & 0.070719 \tabularnewline
M10 & 7.13333333333333 & 4.349963 & 1.6399 & 0.106356 & 0.053178 \tabularnewline
M11 & 0.449999999999998 & 4.349963 & 0.1034 & 0.917957 & 0.458979 \tabularnewline
\hline
\end{tabular}
%Source: https://freestatistics.org/blog/index.php?pk=25735&T=2

[TABLE]
[ROW][C]Multiple Linear Regression - Ordinary Least Squares[/C][/ROW]
[ROW][C]Variable[/C][C]Parameter[/C][C]S.D.[/C][C]T-STATH0: parameter = 0[/C][C]2-tail p-value[/C][C]1-tail p-value[/C][/ROW]
[ROW][C](Intercept)[/C][C]105.493333333333[/C][C]4.23982[/C][C]24.8816[/C][C]0[/C][C]0[/C][/ROW]
[ROW][C]y[/C][C]8.58999999999997[/C][C]2.918044[/C][C]2.9438[/C][C]0.004631[/C][C]0.002316[/C][/ROW]
[ROW][C]M1[/C][C]-7.8183333333333[/C][C]4.377066[/C][C]-1.7862[/C][C]0.079205[/C][C]0.039602[/C][/ROW]
[ROW][C]M2[/C][C]-8.95166666666667[/C][C]4.377066[/C][C]-2.0451[/C][C]0.04531[/C][C]0.022655[/C][/ROW]
[ROW][C]M3[/C][C]3.09833333333333[/C][C]4.377066[/C][C]0.7079[/C][C]0.481822[/C][C]0.240911[/C][/ROW]
[ROW][C]M4[/C][C]-7.25166666666668[/C][C]4.377066[/C][C]-1.6567[/C][C]0.102881[/C][C]0.05144[/C][/ROW]
[ROW][C]M5[/C][C]-7.25166666666667[/C][C]4.377066[/C][C]-1.6567[/C][C]0.102881[/C][C]0.05144[/C][/ROW]
[ROW][C]M6[/C][C]2.51499999999999[/C][C]4.377066[/C][C]0.5746[/C][C]0.567756[/C][C]0.283878[/C][/ROW]
[ROW][C]M7[/C][C]-12.6683333333333[/C][C]4.377066[/C][C]-2.8943[/C][C]0.005319[/C][C]0.00266[/C][/ROW]
[ROW][C]M8[/C][C]-8.51833333333334[/C][C]4.377066[/C][C]-1.9461[/C][C]0.056407[/C][C]0.028203[/C][/ROW]
[ROW][C]M9[/C][C]6.48333333333334[/C][C]4.349963[/C][C]1.4904[/C][C]0.141437[/C][C]0.070719[/C][/ROW]
[ROW][C]M10[/C][C]7.13333333333333[/C][C]4.349963[/C][C]1.6399[/C][C]0.106356[/C][C]0.053178[/C][/ROW]
[ROW][C]M11[/C][C]0.449999999999998[/C][C]4.349963[/C][C]0.1034[/C][C]0.917957[/C][C]0.458979[/C][/ROW]
[/TABLE]
Source: https://freestatistics.org/blog/index.php?pk=25735&T=2

Globally Unique Identifier (entire table): ba.freestatistics.org/blog/index.php?pk=25735&T=2

As an alternative you can also use a QR Code:  

The GUIDs for individual cells are displayed in the table below:

Multiple Linear Regression - Ordinary Least Squares
VariableParameterS.D.T-STATH0: parameter = 02-tail p-value1-tail p-value
(Intercept)105.4933333333334.2398224.881600
y8.589999999999972.9180442.94380.0046310.002316
M1-7.81833333333334.377066-1.78620.0792050.039602
M2-8.951666666666674.377066-2.04510.045310.022655
M33.098333333333334.3770660.70790.4818220.240911
M4-7.251666666666684.377066-1.65670.1028810.05144
M5-7.251666666666674.377066-1.65670.1028810.05144
M62.514999999999994.3770660.57460.5677560.283878
M7-12.66833333333334.377066-2.89430.0053190.00266
M8-8.518333333333344.377066-1.94610.0564070.028203
M96.483333333333344.3499631.49040.1414370.070719
M107.133333333333334.3499631.63990.1063560.053178
M110.4499999999999984.3499630.10340.9179570.458979


Multiple Linear Regression - Regression Statistics
Multiple R0.735545441109676
R-squared0.541027095937227
Adjusted R-squared0.447676674771918
F-TEST (value)5.79565779332853
F-TEST (DF numerator)12
F-TEST (DF denominator)59
p-value1.69699007579460e-06
Multiple Linear Regression - Residual Statistics
Residual Standard Deviation7.53435746251008
Sum Squared Residuals3349.226

\begin{tabular}{lllllllll}
\hline
Multiple Linear Regression - Regression Statistics \tabularnewline
Multiple R & 0.735545441109676 \tabularnewline
R-squared & 0.541027095937227 \tabularnewline
Adjusted R-squared & 0.447676674771918 \tabularnewline
F-TEST (value) & 5.79565779332853 \tabularnewline
F-TEST (DF numerator) & 12 \tabularnewline
F-TEST (DF denominator) & 59 \tabularnewline
p-value & 1.69699007579460e-06 \tabularnewline
Multiple Linear Regression - Residual Statistics \tabularnewline
Residual Standard Deviation & 7.53435746251008 \tabularnewline
Sum Squared Residuals & 3349.226 \tabularnewline
\hline
\end{tabular}
%Source: https://freestatistics.org/blog/index.php?pk=25735&T=3

[TABLE]
[ROW][C]Multiple Linear Regression - Regression Statistics[/C][/ROW]
[ROW][C]Multiple R[/C][C]0.735545441109676[/C][/ROW]
[ROW][C]R-squared[/C][C]0.541027095937227[/C][/ROW]
[ROW][C]Adjusted R-squared[/C][C]0.447676674771918[/C][/ROW]
[ROW][C]F-TEST (value)[/C][C]5.79565779332853[/C][/ROW]
[ROW][C]F-TEST (DF numerator)[/C][C]12[/C][/ROW]
[ROW][C]F-TEST (DF denominator)[/C][C]59[/C][/ROW]
[ROW][C]p-value[/C][C]1.69699007579460e-06[/C][/ROW]
[ROW][C]Multiple Linear Regression - Residual Statistics[/C][/ROW]
[ROW][C]Residual Standard Deviation[/C][C]7.53435746251008[/C][/ROW]
[ROW][C]Sum Squared Residuals[/C][C]3349.226[/C][/ROW]
[/TABLE]
Source: https://freestatistics.org/blog/index.php?pk=25735&T=3

Globally Unique Identifier (entire table): ba.freestatistics.org/blog/index.php?pk=25735&T=3

As an alternative you can also use a QR Code:  

The GUIDs for individual cells are displayed in the table below:

Multiple Linear Regression - Regression Statistics
Multiple R0.735545441109676
R-squared0.541027095937227
Adjusted R-squared0.447676674771918
F-TEST (value)5.79565779332853
F-TEST (DF numerator)12
F-TEST (DF denominator)59
p-value1.69699007579460e-06
Multiple Linear Regression - Residual Statistics
Residual Standard Deviation7.53435746251008
Sum Squared Residuals3349.226


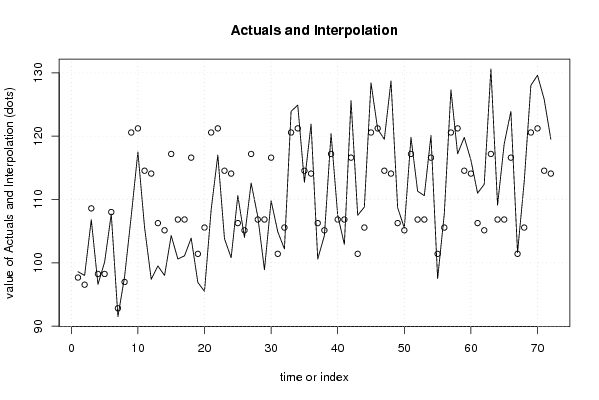
Multiple Linear Regression - Actuals, Interpolation, and Residuals
Time or IndexActualsInterpolationForecastResidualsPrediction Error
198.697.67499999999980.92500000000019
29896.54166666666671.45833333333331
3106.8108.591666666667-1.79166666666669
496.698.2416666666667-1.64166666666669
5100.198.24166666666671.8583333333333
6107.7108.008333333333-0.308333333333358
791.592.825-1.32500000000003
897.896.9750.824999999999976
9107.4120.566666666667-13.1666666666667
10117.5121.216666666667-3.71666666666667
11105.6114.533333333333-8.93333333333334
1297.4114.083333333333-16.6833333333333
1399.5106.265-6.76500000000003
1498105.131666666667-7.13166666666666
15104.3117.181666666667-12.8816666666667
16100.6106.831666666667-6.23166666666666
17101.1106.831666666667-5.73166666666666
18103.9116.598333333333-12.6983333333333
1996.9101.415-4.51499999999999
2095.5105.565-10.065
21108.4120.566666666667-12.1666666666667
22117121.216666666667-4.21666666666667
23103.8114.533333333333-10.7333333333333
24100.8114.083333333333-13.2833333333333
25110.6106.2654.33499999999996
26104105.131666666667-1.13166666666666
27112.6117.181666666667-4.58166666666666
28107.3106.8316666666670.468333333333339
2998.9106.831666666667-7.93166666666665
30109.8116.598333333333-6.79833333333333
31104.9101.4153.48500000000001
32102.2105.565-3.36499999999999
33123.9120.5666666666673.33333333333334
34124.9121.2166666666673.68333333333334
35112.7114.533333333333-1.83333333333333
36121.9114.0833333333337.81666666666668
37100.6106.265-5.66500000000004
38104.3105.131666666667-0.831666666666666
39120.4117.1816666666673.21833333333335
40107.5106.8316666666670.668333333333341
41102.9106.831666666667-3.93166666666665
42125.6116.5983333333339.00166666666667
43107.5101.4156.085
44108.8105.5653.23500000000000
45128.4120.5666666666677.83333333333333
46121.1121.216666666667-0.116666666666671
47119.5114.5333333333334.96666666666667
48128.7114.08333333333314.6166666666667
49108.7106.2652.43499999999997
50105.5105.1316666666670.368333333333337
51119.8117.1816666666672.61833333333334
52111.3106.8316666666674.46833333333334
53110.6106.8316666666673.76833333333333
54120.1116.5983333333333.50166666666667
5597.5101.415-3.91499999999999
56107.7105.5652.13500000000001
57127.3120.5666666666676.73333333333333
58117.2121.216666666667-4.01666666666666
59119.8114.5333333333335.26666666666667
60116.2114.0833333333332.11666666666667
61111106.2654.73499999999996
62112.4105.1316666666677.26833333333335
63130.6117.18166666666713.4183333333333
64109.1106.8316666666672.26833333333334
65118.8106.83166666666711.9683333333333
66123.9116.5983333333337.30166666666668
67101.6101.4150.184999999999998
68112.8105.5657.235
69128120.5666666666677.43333333333333
70129.6121.2166666666678.38333333333332
71125.8114.53333333333311.2666666666667
72119.5114.0833333333335.41666666666667

\begin{tabular}{lllllllll}
\hline
Multiple Linear Regression - Actuals, Interpolation, and Residuals \tabularnewline
Time or Index & Actuals & InterpolationForecast & ResidualsPrediction Error \tabularnewline
1 & 98.6 & 97.6749999999998 & 0.92500000000019 \tabularnewline
2 & 98 & 96.5416666666667 & 1.45833333333331 \tabularnewline
3 & 106.8 & 108.591666666667 & -1.79166666666669 \tabularnewline
4 & 96.6 & 98.2416666666667 & -1.64166666666669 \tabularnewline
5 & 100.1 & 98.2416666666667 & 1.8583333333333 \tabularnewline
6 & 107.7 & 108.008333333333 & -0.308333333333358 \tabularnewline
7 & 91.5 & 92.825 & -1.32500000000003 \tabularnewline
8 & 97.8 & 96.975 & 0.824999999999976 \tabularnewline
9 & 107.4 & 120.566666666667 & -13.1666666666667 \tabularnewline
10 & 117.5 & 121.216666666667 & -3.71666666666667 \tabularnewline
11 & 105.6 & 114.533333333333 & -8.93333333333334 \tabularnewline
12 & 97.4 & 114.083333333333 & -16.6833333333333 \tabularnewline
13 & 99.5 & 106.265 & -6.76500000000003 \tabularnewline
14 & 98 & 105.131666666667 & -7.13166666666666 \tabularnewline
15 & 104.3 & 117.181666666667 & -12.8816666666667 \tabularnewline
16 & 100.6 & 106.831666666667 & -6.23166666666666 \tabularnewline
17 & 101.1 & 106.831666666667 & -5.73166666666666 \tabularnewline
18 & 103.9 & 116.598333333333 & -12.6983333333333 \tabularnewline
19 & 96.9 & 101.415 & -4.51499999999999 \tabularnewline
20 & 95.5 & 105.565 & -10.065 \tabularnewline
21 & 108.4 & 120.566666666667 & -12.1666666666667 \tabularnewline
22 & 117 & 121.216666666667 & -4.21666666666667 \tabularnewline
23 & 103.8 & 114.533333333333 & -10.7333333333333 \tabularnewline
24 & 100.8 & 114.083333333333 & -13.2833333333333 \tabularnewline
25 & 110.6 & 106.265 & 4.33499999999996 \tabularnewline
26 & 104 & 105.131666666667 & -1.13166666666666 \tabularnewline
27 & 112.6 & 117.181666666667 & -4.58166666666666 \tabularnewline
28 & 107.3 & 106.831666666667 & 0.468333333333339 \tabularnewline
29 & 98.9 & 106.831666666667 & -7.93166666666665 \tabularnewline
30 & 109.8 & 116.598333333333 & -6.79833333333333 \tabularnewline
31 & 104.9 & 101.415 & 3.48500000000001 \tabularnewline
32 & 102.2 & 105.565 & -3.36499999999999 \tabularnewline
33 & 123.9 & 120.566666666667 & 3.33333333333334 \tabularnewline
34 & 124.9 & 121.216666666667 & 3.68333333333334 \tabularnewline
35 & 112.7 & 114.533333333333 & -1.83333333333333 \tabularnewline
36 & 121.9 & 114.083333333333 & 7.81666666666668 \tabularnewline
37 & 100.6 & 106.265 & -5.66500000000004 \tabularnewline
38 & 104.3 & 105.131666666667 & -0.831666666666666 \tabularnewline
39 & 120.4 & 117.181666666667 & 3.21833333333335 \tabularnewline
40 & 107.5 & 106.831666666667 & 0.668333333333341 \tabularnewline
41 & 102.9 & 106.831666666667 & -3.93166666666665 \tabularnewline
42 & 125.6 & 116.598333333333 & 9.00166666666667 \tabularnewline
43 & 107.5 & 101.415 & 6.085 \tabularnewline
44 & 108.8 & 105.565 & 3.23500000000000 \tabularnewline
45 & 128.4 & 120.566666666667 & 7.83333333333333 \tabularnewline
46 & 121.1 & 121.216666666667 & -0.116666666666671 \tabularnewline
47 & 119.5 & 114.533333333333 & 4.96666666666667 \tabularnewline
48 & 128.7 & 114.083333333333 & 14.6166666666667 \tabularnewline
49 & 108.7 & 106.265 & 2.43499999999997 \tabularnewline
50 & 105.5 & 105.131666666667 & 0.368333333333337 \tabularnewline
51 & 119.8 & 117.181666666667 & 2.61833333333334 \tabularnewline
52 & 111.3 & 106.831666666667 & 4.46833333333334 \tabularnewline
53 & 110.6 & 106.831666666667 & 3.76833333333333 \tabularnewline
54 & 120.1 & 116.598333333333 & 3.50166666666667 \tabularnewline
55 & 97.5 & 101.415 & -3.91499999999999 \tabularnewline
56 & 107.7 & 105.565 & 2.13500000000001 \tabularnewline
57 & 127.3 & 120.566666666667 & 6.73333333333333 \tabularnewline
58 & 117.2 & 121.216666666667 & -4.01666666666666 \tabularnewline
59 & 119.8 & 114.533333333333 & 5.26666666666667 \tabularnewline
60 & 116.2 & 114.083333333333 & 2.11666666666667 \tabularnewline
61 & 111 & 106.265 & 4.73499999999996 \tabularnewline
62 & 112.4 & 105.131666666667 & 7.26833333333335 \tabularnewline
63 & 130.6 & 117.181666666667 & 13.4183333333333 \tabularnewline
64 & 109.1 & 106.831666666667 & 2.26833333333334 \tabularnewline
65 & 118.8 & 106.831666666667 & 11.9683333333333 \tabularnewline
66 & 123.9 & 116.598333333333 & 7.30166666666668 \tabularnewline
67 & 101.6 & 101.415 & 0.184999999999998 \tabularnewline
68 & 112.8 & 105.565 & 7.235 \tabularnewline
69 & 128 & 120.566666666667 & 7.43333333333333 \tabularnewline
70 & 129.6 & 121.216666666667 & 8.38333333333332 \tabularnewline
71 & 125.8 & 114.533333333333 & 11.2666666666667 \tabularnewline
72 & 119.5 & 114.083333333333 & 5.41666666666667 \tabularnewline
\hline
\end{tabular}
%Source: https://freestatistics.org/blog/index.php?pk=25735&T=4

[TABLE]
[ROW][C]Multiple Linear Regression - Actuals, Interpolation, and Residuals[/C][/ROW]
[ROW][C]Time or Index[/C][C]Actuals[/C][C]InterpolationForecast[/C][C]ResidualsPrediction Error[/C][/ROW]
[ROW][C]1[/C][C]98.6[/C][C]97.6749999999998[/C][C]0.92500000000019[/C][/ROW]
[ROW][C]2[/C][C]98[/C][C]96.5416666666667[/C][C]1.45833333333331[/C][/ROW]
[ROW][C]3[/C][C]106.8[/C][C]108.591666666667[/C][C]-1.79166666666669[/C][/ROW]
[ROW][C]4[/C][C]96.6[/C][C]98.2416666666667[/C][C]-1.64166666666669[/C][/ROW]
[ROW][C]5[/C][C]100.1[/C][C]98.2416666666667[/C][C]1.8583333333333[/C][/ROW]
[ROW][C]6[/C][C]107.7[/C][C]108.008333333333[/C][C]-0.308333333333358[/C][/ROW]
[ROW][C]7[/C][C]91.5[/C][C]92.825[/C][C]-1.32500000000003[/C][/ROW]
[ROW][C]8[/C][C]97.8[/C][C]96.975[/C][C]0.824999999999976[/C][/ROW]
[ROW][C]9[/C][C]107.4[/C][C]120.566666666667[/C][C]-13.1666666666667[/C][/ROW]
[ROW][C]10[/C][C]117.5[/C][C]121.216666666667[/C][C]-3.71666666666667[/C][/ROW]
[ROW][C]11[/C][C]105.6[/C][C]114.533333333333[/C][C]-8.93333333333334[/C][/ROW]
[ROW][C]12[/C][C]97.4[/C][C]114.083333333333[/C][C]-16.6833333333333[/C][/ROW]
[ROW][C]13[/C][C]99.5[/C][C]106.265[/C][C]-6.76500000000003[/C][/ROW]
[ROW][C]14[/C][C]98[/C][C]105.131666666667[/C][C]-7.13166666666666[/C][/ROW]
[ROW][C]15[/C][C]104.3[/C][C]117.181666666667[/C][C]-12.8816666666667[/C][/ROW]
[ROW][C]16[/C][C]100.6[/C][C]106.831666666667[/C][C]-6.23166666666666[/C][/ROW]
[ROW][C]17[/C][C]101.1[/C][C]106.831666666667[/C][C]-5.73166666666666[/C][/ROW]
[ROW][C]18[/C][C]103.9[/C][C]116.598333333333[/C][C]-12.6983333333333[/C][/ROW]
[ROW][C]19[/C][C]96.9[/C][C]101.415[/C][C]-4.51499999999999[/C][/ROW]
[ROW][C]20[/C][C]95.5[/C][C]105.565[/C][C]-10.065[/C][/ROW]
[ROW][C]21[/C][C]108.4[/C][C]120.566666666667[/C][C]-12.1666666666667[/C][/ROW]
[ROW][C]22[/C][C]117[/C][C]121.216666666667[/C][C]-4.21666666666667[/C][/ROW]
[ROW][C]23[/C][C]103.8[/C][C]114.533333333333[/C][C]-10.7333333333333[/C][/ROW]
[ROW][C]24[/C][C]100.8[/C][C]114.083333333333[/C][C]-13.2833333333333[/C][/ROW]
[ROW][C]25[/C][C]110.6[/C][C]106.265[/C][C]4.33499999999996[/C][/ROW]
[ROW][C]26[/C][C]104[/C][C]105.131666666667[/C][C]-1.13166666666666[/C][/ROW]
[ROW][C]27[/C][C]112.6[/C][C]117.181666666667[/C][C]-4.58166666666666[/C][/ROW]
[ROW][C]28[/C][C]107.3[/C][C]106.831666666667[/C][C]0.468333333333339[/C][/ROW]
[ROW][C]29[/C][C]98.9[/C][C]106.831666666667[/C][C]-7.93166666666665[/C][/ROW]
[ROW][C]30[/C][C]109.8[/C][C]116.598333333333[/C][C]-6.79833333333333[/C][/ROW]
[ROW][C]31[/C][C]104.9[/C][C]101.415[/C][C]3.48500000000001[/C][/ROW]
[ROW][C]32[/C][C]102.2[/C][C]105.565[/C][C]-3.36499999999999[/C][/ROW]
[ROW][C]33[/C][C]123.9[/C][C]120.566666666667[/C][C]3.33333333333334[/C][/ROW]
[ROW][C]34[/C][C]124.9[/C][C]121.216666666667[/C][C]3.68333333333334[/C][/ROW]
[ROW][C]35[/C][C]112.7[/C][C]114.533333333333[/C][C]-1.83333333333333[/C][/ROW]
[ROW][C]36[/C][C]121.9[/C][C]114.083333333333[/C][C]7.81666666666668[/C][/ROW]
[ROW][C]37[/C][C]100.6[/C][C]106.265[/C][C]-5.66500000000004[/C][/ROW]
[ROW][C]38[/C][C]104.3[/C][C]105.131666666667[/C][C]-0.831666666666666[/C][/ROW]
[ROW][C]39[/C][C]120.4[/C][C]117.181666666667[/C][C]3.21833333333335[/C][/ROW]
[ROW][C]40[/C][C]107.5[/C][C]106.831666666667[/C][C]0.668333333333341[/C][/ROW]
[ROW][C]41[/C][C]102.9[/C][C]106.831666666667[/C][C]-3.93166666666665[/C][/ROW]
[ROW][C]42[/C][C]125.6[/C][C]116.598333333333[/C][C]9.00166666666667[/C][/ROW]
[ROW][C]43[/C][C]107.5[/C][C]101.415[/C][C]6.085[/C][/ROW]
[ROW][C]44[/C][C]108.8[/C][C]105.565[/C][C]3.23500000000000[/C][/ROW]
[ROW][C]45[/C][C]128.4[/C][C]120.566666666667[/C][C]7.83333333333333[/C][/ROW]
[ROW][C]46[/C][C]121.1[/C][C]121.216666666667[/C][C]-0.116666666666671[/C][/ROW]
[ROW][C]47[/C][C]119.5[/C][C]114.533333333333[/C][C]4.96666666666667[/C][/ROW]
[ROW][C]48[/C][C]128.7[/C][C]114.083333333333[/C][C]14.6166666666667[/C][/ROW]
[ROW][C]49[/C][C]108.7[/C][C]106.265[/C][C]2.43499999999997[/C][/ROW]
[ROW][C]50[/C][C]105.5[/C][C]105.131666666667[/C][C]0.368333333333337[/C][/ROW]
[ROW][C]51[/C][C]119.8[/C][C]117.181666666667[/C][C]2.61833333333334[/C][/ROW]
[ROW][C]52[/C][C]111.3[/C][C]106.831666666667[/C][C]4.46833333333334[/C][/ROW]
[ROW][C]53[/C][C]110.6[/C][C]106.831666666667[/C][C]3.76833333333333[/C][/ROW]
[ROW][C]54[/C][C]120.1[/C][C]116.598333333333[/C][C]3.50166666666667[/C][/ROW]
[ROW][C]55[/C][C]97.5[/C][C]101.415[/C][C]-3.91499999999999[/C][/ROW]
[ROW][C]56[/C][C]107.7[/C][C]105.565[/C][C]2.13500000000001[/C][/ROW]
[ROW][C]57[/C][C]127.3[/C][C]120.566666666667[/C][C]6.73333333333333[/C][/ROW]
[ROW][C]58[/C][C]117.2[/C][C]121.216666666667[/C][C]-4.01666666666666[/C][/ROW]
[ROW][C]59[/C][C]119.8[/C][C]114.533333333333[/C][C]5.26666666666667[/C][/ROW]
[ROW][C]60[/C][C]116.2[/C][C]114.083333333333[/C][C]2.11666666666667[/C][/ROW]
[ROW][C]61[/C][C]111[/C][C]106.265[/C][C]4.73499999999996[/C][/ROW]
[ROW][C]62[/C][C]112.4[/C][C]105.131666666667[/C][C]7.26833333333335[/C][/ROW]
[ROW][C]63[/C][C]130.6[/C][C]117.181666666667[/C][C]13.4183333333333[/C][/ROW]
[ROW][C]64[/C][C]109.1[/C][C]106.831666666667[/C][C]2.26833333333334[/C][/ROW]
[ROW][C]65[/C][C]118.8[/C][C]106.831666666667[/C][C]11.9683333333333[/C][/ROW]
[ROW][C]66[/C][C]123.9[/C][C]116.598333333333[/C][C]7.30166666666668[/C][/ROW]
[ROW][C]67[/C][C]101.6[/C][C]101.415[/C][C]0.184999999999998[/C][/ROW]
[ROW][C]68[/C][C]112.8[/C][C]105.565[/C][C]7.235[/C][/ROW]
[ROW][C]69[/C][C]128[/C][C]120.566666666667[/C][C]7.43333333333333[/C][/ROW]
[ROW][C]70[/C][C]129.6[/C][C]121.216666666667[/C][C]8.38333333333332[/C][/ROW]
[ROW][C]71[/C][C]125.8[/C][C]114.533333333333[/C][C]11.2666666666667[/C][/ROW]
[ROW][C]72[/C][C]119.5[/C][C]114.083333333333[/C][C]5.41666666666667[/C][/ROW]
[/TABLE]
Source: https://freestatistics.org/blog/index.php?pk=25735&T=4

Globally Unique Identifier (entire table): ba.freestatistics.org/blog/index.php?pk=25735&T=4

As an alternative you can also use a QR Code:  

The GUIDs for individual cells are displayed in the table below:

Multiple Linear Regression - Actuals, Interpolation, and Residuals
Time or IndexActualsInterpolationForecastResidualsPrediction Error
198.697.67499999999980.92500000000019
29896.54166666666671.45833333333331
3106.8108.591666666667-1.79166666666669
496.698.2416666666667-1.64166666666669
5100.198.24166666666671.8583333333333
6107.7108.008333333333-0.308333333333358
791.592.825-1.32500000000003
897.896.9750.824999999999976
9107.4120.566666666667-13.1666666666667
10117.5121.216666666667-3.71666666666667
11105.6114.533333333333-8.93333333333334
1297.4114.083333333333-16.6833333333333
1399.5106.265-6.76500000000003
1498105.131666666667-7.13166666666666
15104.3117.181666666667-12.8816666666667
16100.6106.831666666667-6.23166666666666
17101.1106.831666666667-5.73166666666666
18103.9116.598333333333-12.6983333333333
1996.9101.415-4.51499999999999
2095.5105.565-10.065
21108.4120.566666666667-12.1666666666667
22117121.216666666667-4.21666666666667
23103.8114.533333333333-10.7333333333333
24100.8114.083333333333-13.2833333333333
25110.6106.2654.33499999999996
26104105.131666666667-1.13166666666666
27112.6117.181666666667-4.58166666666666
28107.3106.8316666666670.468333333333339
2998.9106.831666666667-7.93166666666665
30109.8116.598333333333-6.79833333333333
31104.9101.4153.48500000000001
32102.2105.565-3.36499999999999
33123.9120.5666666666673.33333333333334
34124.9121.2166666666673.68333333333334
35112.7114.533333333333-1.83333333333333
36121.9114.0833333333337.81666666666668
37100.6106.265-5.66500000000004
38104.3105.131666666667-0.831666666666666
39120.4117.1816666666673.21833333333335
40107.5106.8316666666670.668333333333341
41102.9106.831666666667-3.93166666666665
42125.6116.5983333333339.00166666666667
43107.5101.4156.085
44108.8105.5653.23500000000000
45128.4120.5666666666677.83333333333333
46121.1121.216666666667-0.116666666666671
47119.5114.5333333333334.96666666666667
48128.7114.08333333333314.6166666666667
49108.7106.2652.43499999999997
50105.5105.1316666666670.368333333333337
51119.8117.1816666666672.61833333333334
52111.3106.8316666666674.46833333333334
53110.6106.8316666666673.76833333333333
54120.1116.5983333333333.50166666666667
5597.5101.415-3.91499999999999
56107.7105.5652.13500000000001
57127.3120.5666666666676.73333333333333
58117.2121.216666666667-4.01666666666666
59119.8114.5333333333335.26666666666667
60116.2114.0833333333332.11666666666667
61111106.2654.73499999999996
62112.4105.1316666666677.26833333333335
63130.6117.18166666666713.4183333333333
64109.1106.8316666666672.26833333333334
65118.8106.83166666666711.9683333333333
66123.9116.5983333333337.30166666666668
67101.6101.4150.184999999999998
68112.8105.5657.235
69128120.5666666666677.43333333333333
70129.6121.2166666666678.38333333333332
71125.8114.53333333333311.2666666666667
72119.5114.0833333333335.41666666666667


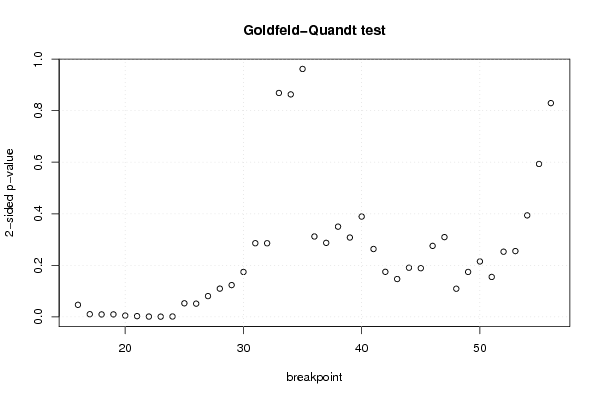
Goldfeld-Quandt test for Heteroskedasticity
p-valuesAlternative Hypothesis
breakpoint indexgreater2-sidedless
160.02317355917439290.04634711834878590.976826440825607
170.004988597258102380.009977194516204760.995011402741898
180.004570495047131110.009140990094262230.995429504952869
190.004673626269049470.009347252538098940.99532637373095
200.002338476838466640.004676953676933280.997661523161533
210.001237127711414430.002474255422828860.998762872288586
220.0003941527483653190.0007883054967306380.999605847251635
230.0002398684985332440.0004797369970664890.999760131501467
240.000535557270416710.001071114540833420.999464442729583
250.02616340883981680.05232681767963360.973836591160183
260.02545828096430270.05091656192860550.974541719035697
270.0401802965532140.0803605931064280.959819703446786
280.05462414666616830.1092482933323370.945375853333832
290.06146616889709030.1229323377941810.93853383110291
300.08699657833310370.1739931566662070.913003421666896
310.1427914655775850.2855829311551700.857208534422415
320.1427024278732920.2854048557465850.857297572126708
330.4344286759621790.8688573519243580.565571324037821
340.4316994316290770.8633988632581540.568300568370923
350.518913850386680.962172299226640.48108614961332
360.8441506378779120.3116987242441760.155849362122088
370.8565165392412670.2869669215174650.143483460758733
380.8250752112601070.3498495774797860.174924788739893
390.846156210315960.3076875793680820.153843789684041
400.8054567315138340.3890865369723320.194543268486166
410.8684288993706890.2631422012586220.131571100629311
420.9127553554046740.1744892891906520.087244644595326
430.9267061440951540.1465877118096920.073293855904846
440.9047687681595920.1904624636808170.0952312318404083
450.9056994500520240.1886010998959510.0943005499479756
460.8623798873143730.2752402253712540.137620112685627
470.8453987436362050.309202512727590.154601256363795
480.9455523229155530.1088953541688930.0544476770844466
490.9129920519111030.1740158961777930.0870079480888967
500.8926094777103680.2147810445792630.107390522289632
510.922685395305860.1546292093882800.0773146046941399
520.8736863884956250.2526272230087500.126313611504375
530.8724818183015530.2550363633968940.127518181698447
540.8031675461289520.3936649077420970.196832453871048
550.7034107765132210.5931784469735580.296589223486779
560.5852653783452860.8294692433094280.414734621654714

\begin{tabular}{lllllllll}
\hline
Goldfeld-Quandt test for Heteroskedasticity \tabularnewline
p-values & Alternative Hypothesis \tabularnewline
breakpoint index & greater & 2-sided & less \tabularnewline
16 & 0.0231735591743929 & 0.0463471183487859 & 0.976826440825607 \tabularnewline
17 & 0.00498859725810238 & 0.00997719451620476 & 0.995011402741898 \tabularnewline
18 & 0.00457049504713111 & 0.00914099009426223 & 0.995429504952869 \tabularnewline
19 & 0.00467362626904947 & 0.00934725253809894 & 0.99532637373095 \tabularnewline
20 & 0.00233847683846664 & 0.00467695367693328 & 0.997661523161533 \tabularnewline
21 & 0.00123712771141443 & 0.00247425542282886 & 0.998762872288586 \tabularnewline
22 & 0.000394152748365319 & 0.000788305496730638 & 0.999605847251635 \tabularnewline
23 & 0.000239868498533244 & 0.000479736997066489 & 0.999760131501467 \tabularnewline
24 & 0.00053555727041671 & 0.00107111454083342 & 0.999464442729583 \tabularnewline
25 & 0.0261634088398168 & 0.0523268176796336 & 0.973836591160183 \tabularnewline
26 & 0.0254582809643027 & 0.0509165619286055 & 0.974541719035697 \tabularnewline
27 & 0.040180296553214 & 0.080360593106428 & 0.959819703446786 \tabularnewline
28 & 0.0546241466661683 & 0.109248293332337 & 0.945375853333832 \tabularnewline
29 & 0.0614661688970903 & 0.122932337794181 & 0.93853383110291 \tabularnewline
30 & 0.0869965783331037 & 0.173993156666207 & 0.913003421666896 \tabularnewline
31 & 0.142791465577585 & 0.285582931155170 & 0.857208534422415 \tabularnewline
32 & 0.142702427873292 & 0.285404855746585 & 0.857297572126708 \tabularnewline
33 & 0.434428675962179 & 0.868857351924358 & 0.565571324037821 \tabularnewline
34 & 0.431699431629077 & 0.863398863258154 & 0.568300568370923 \tabularnewline
35 & 0.51891385038668 & 0.96217229922664 & 0.48108614961332 \tabularnewline
36 & 0.844150637877912 & 0.311698724244176 & 0.155849362122088 \tabularnewline
37 & 0.856516539241267 & 0.286966921517465 & 0.143483460758733 \tabularnewline
38 & 0.825075211260107 & 0.349849577479786 & 0.174924788739893 \tabularnewline
39 & 0.84615621031596 & 0.307687579368082 & 0.153843789684041 \tabularnewline
40 & 0.805456731513834 & 0.389086536972332 & 0.194543268486166 \tabularnewline
41 & 0.868428899370689 & 0.263142201258622 & 0.131571100629311 \tabularnewline
42 & 0.912755355404674 & 0.174489289190652 & 0.087244644595326 \tabularnewline
43 & 0.926706144095154 & 0.146587711809692 & 0.073293855904846 \tabularnewline
44 & 0.904768768159592 & 0.190462463680817 & 0.0952312318404083 \tabularnewline
45 & 0.905699450052024 & 0.188601099895951 & 0.0943005499479756 \tabularnewline
46 & 0.862379887314373 & 0.275240225371254 & 0.137620112685627 \tabularnewline
47 & 0.845398743636205 & 0.30920251272759 & 0.154601256363795 \tabularnewline
48 & 0.945552322915553 & 0.108895354168893 & 0.0544476770844466 \tabularnewline
49 & 0.912992051911103 & 0.174015896177793 & 0.0870079480888967 \tabularnewline
50 & 0.892609477710368 & 0.214781044579263 & 0.107390522289632 \tabularnewline
51 & 0.92268539530586 & 0.154629209388280 & 0.0773146046941399 \tabularnewline
52 & 0.873686388495625 & 0.252627223008750 & 0.126313611504375 \tabularnewline
53 & 0.872481818301553 & 0.255036363396894 & 0.127518181698447 \tabularnewline
54 & 0.803167546128952 & 0.393664907742097 & 0.196832453871048 \tabularnewline
55 & 0.703410776513221 & 0.593178446973558 & 0.296589223486779 \tabularnewline
56 & 0.585265378345286 & 0.829469243309428 & 0.414734621654714 \tabularnewline
\hline
\end{tabular}
%Source: https://freestatistics.org/blog/index.php?pk=25735&T=5

[TABLE]
[ROW][C]Goldfeld-Quandt test for Heteroskedasticity[/C][/ROW]
[ROW][C]p-values[/C][C]Alternative Hypothesis[/C][/ROW]
[ROW][C]breakpoint index[/C][C]greater[/C][C]2-sided[/C][C]less[/C][/ROW]
[ROW][C]16[/C][C]0.0231735591743929[/C][C]0.0463471183487859[/C][C]0.976826440825607[/C][/ROW]
[ROW][C]17[/C][C]0.00498859725810238[/C][C]0.00997719451620476[/C][C]0.995011402741898[/C][/ROW]
[ROW][C]18[/C][C]0.00457049504713111[/C][C]0.00914099009426223[/C][C]0.995429504952869[/C][/ROW]
[ROW][C]19[/C][C]0.00467362626904947[/C][C]0.00934725253809894[/C][C]0.99532637373095[/C][/ROW]
[ROW][C]20[/C][C]0.00233847683846664[/C][C]0.00467695367693328[/C][C]0.997661523161533[/C][/ROW]
[ROW][C]21[/C][C]0.00123712771141443[/C][C]0.00247425542282886[/C][C]0.998762872288586[/C][/ROW]
[ROW][C]22[/C][C]0.000394152748365319[/C][C]0.000788305496730638[/C][C]0.999605847251635[/C][/ROW]
[ROW][C]23[/C][C]0.000239868498533244[/C][C]0.000479736997066489[/C][C]0.999760131501467[/C][/ROW]
[ROW][C]24[/C][C]0.00053555727041671[/C][C]0.00107111454083342[/C][C]0.999464442729583[/C][/ROW]
[ROW][C]25[/C][C]0.0261634088398168[/C][C]0.0523268176796336[/C][C]0.973836591160183[/C][/ROW]
[ROW][C]26[/C][C]0.0254582809643027[/C][C]0.0509165619286055[/C][C]0.974541719035697[/C][/ROW]
[ROW][C]27[/C][C]0.040180296553214[/C][C]0.080360593106428[/C][C]0.959819703446786[/C][/ROW]
[ROW][C]28[/C][C]0.0546241466661683[/C][C]0.109248293332337[/C][C]0.945375853333832[/C][/ROW]
[ROW][C]29[/C][C]0.0614661688970903[/C][C]0.122932337794181[/C][C]0.93853383110291[/C][/ROW]
[ROW][C]30[/C][C]0.0869965783331037[/C][C]0.173993156666207[/C][C]0.913003421666896[/C][/ROW]
[ROW][C]31[/C][C]0.142791465577585[/C][C]0.285582931155170[/C][C]0.857208534422415[/C][/ROW]
[ROW][C]32[/C][C]0.142702427873292[/C][C]0.285404855746585[/C][C]0.857297572126708[/C][/ROW]
[ROW][C]33[/C][C]0.434428675962179[/C][C]0.868857351924358[/C][C]0.565571324037821[/C][/ROW]
[ROW][C]34[/C][C]0.431699431629077[/C][C]0.863398863258154[/C][C]0.568300568370923[/C][/ROW]
[ROW][C]35[/C][C]0.51891385038668[/C][C]0.96217229922664[/C][C]0.48108614961332[/C][/ROW]
[ROW][C]36[/C][C]0.844150637877912[/C][C]0.311698724244176[/C][C]0.155849362122088[/C][/ROW]
[ROW][C]37[/C][C]0.856516539241267[/C][C]0.286966921517465[/C][C]0.143483460758733[/C][/ROW]
[ROW][C]38[/C][C]0.825075211260107[/C][C]0.349849577479786[/C][C]0.174924788739893[/C][/ROW]
[ROW][C]39[/C][C]0.84615621031596[/C][C]0.307687579368082[/C][C]0.153843789684041[/C][/ROW]
[ROW][C]40[/C][C]0.805456731513834[/C][C]0.389086536972332[/C][C]0.194543268486166[/C][/ROW]
[ROW][C]41[/C][C]0.868428899370689[/C][C]0.263142201258622[/C][C]0.131571100629311[/C][/ROW]
[ROW][C]42[/C][C]0.912755355404674[/C][C]0.174489289190652[/C][C]0.087244644595326[/C][/ROW]
[ROW][C]43[/C][C]0.926706144095154[/C][C]0.146587711809692[/C][C]0.073293855904846[/C][/ROW]
[ROW][C]44[/C][C]0.904768768159592[/C][C]0.190462463680817[/C][C]0.0952312318404083[/C][/ROW]
[ROW][C]45[/C][C]0.905699450052024[/C][C]0.188601099895951[/C][C]0.0943005499479756[/C][/ROW]
[ROW][C]46[/C][C]0.862379887314373[/C][C]0.275240225371254[/C][C]0.137620112685627[/C][/ROW]
[ROW][C]47[/C][C]0.845398743636205[/C][C]0.30920251272759[/C][C]0.154601256363795[/C][/ROW]
[ROW][C]48[/C][C]0.945552322915553[/C][C]0.108895354168893[/C][C]0.0544476770844466[/C][/ROW]
[ROW][C]49[/C][C]0.912992051911103[/C][C]0.174015896177793[/C][C]0.0870079480888967[/C][/ROW]
[ROW][C]50[/C][C]0.892609477710368[/C][C]0.214781044579263[/C][C]0.107390522289632[/C][/ROW]
[ROW][C]51[/C][C]0.92268539530586[/C][C]0.154629209388280[/C][C]0.0773146046941399[/C][/ROW]
[ROW][C]52[/C][C]0.873686388495625[/C][C]0.252627223008750[/C][C]0.126313611504375[/C][/ROW]
[ROW][C]53[/C][C]0.872481818301553[/C][C]0.255036363396894[/C][C]0.127518181698447[/C][/ROW]
[ROW][C]54[/C][C]0.803167546128952[/C][C]0.393664907742097[/C][C]0.196832453871048[/C][/ROW]
[ROW][C]55[/C][C]0.703410776513221[/C][C]0.593178446973558[/C][C]0.296589223486779[/C][/ROW]
[ROW][C]56[/C][C]0.585265378345286[/C][C]0.829469243309428[/C][C]0.414734621654714[/C][/ROW]
[/TABLE]
Source: https://freestatistics.org/blog/index.php?pk=25735&T=5

Globally Unique Identifier (entire table): ba.freestatistics.org/blog/index.php?pk=25735&T=5

As an alternative you can also use a QR Code:  

The GUIDs for individual cells are displayed in the table below:

Goldfeld-Quandt test for Heteroskedasticity
p-valuesAlternative Hypothesis
breakpoint indexgreater2-sidedless
160.02317355917439290.04634711834878590.976826440825607
170.004988597258102380.009977194516204760.995011402741898
180.004570495047131110.009140990094262230.995429504952869
190.004673626269049470.009347252538098940.99532637373095
200.002338476838466640.004676953676933280.997661523161533
210.001237127711414430.002474255422828860.998762872288586
220.0003941527483653190.0007883054967306380.999605847251635
230.0002398684985332440.0004797369970664890.999760131501467
240.000535557270416710.001071114540833420.999464442729583
250.02616340883981680.05232681767963360.973836591160183
260.02545828096430270.05091656192860550.974541719035697
270.0401802965532140.0803605931064280.959819703446786
280.05462414666616830.1092482933323370.945375853333832
290.06146616889709030.1229323377941810.93853383110291
300.08699657833310370.1739931566662070.913003421666896
310.1427914655775850.2855829311551700.857208534422415
320.1427024278732920.2854048557465850.857297572126708
330.4344286759621790.8688573519243580.565571324037821
340.4316994316290770.8633988632581540.568300568370923
350.518913850386680.962172299226640.48108614961332
360.8441506378779120.3116987242441760.155849362122088
370.8565165392412670.2869669215174650.143483460758733
380.8250752112601070.3498495774797860.174924788739893
390.846156210315960.3076875793680820.153843789684041
400.8054567315138340.3890865369723320.194543268486166
410.8684288993706890.2631422012586220.131571100629311
420.9127553554046740.1744892891906520.087244644595326
430.9267061440951540.1465877118096920.073293855904846
440.9047687681595920.1904624636808170.0952312318404083
450.9056994500520240.1886010998959510.0943005499479756
460.8623798873143730.2752402253712540.137620112685627
470.8453987436362050.309202512727590.154601256363795
480.9455523229155530.1088953541688930.0544476770844466
490.9129920519111030.1740158961777930.0870079480888967
500.8926094777103680.2147810445792630.107390522289632
510.922685395305860.1546292093882800.0773146046941399
520.8736863884956250.2526272230087500.126313611504375
530.8724818183015530.2550363633968940.127518181698447
540.8031675461289520.3936649077420970.196832453871048
550.7034107765132210.5931784469735580.296589223486779
560.5852653783452860.8294692433094280.414734621654714


Meta Analysis of Goldfeld-Quandt test for Heteroskedasticity
Description# significant tests% significant testsOK/NOK
1% type I error level80.195121951219512NOK
5% type I error level90.219512195121951NOK
10% type I error level120.292682926829268NOK

\begin{tabular}{lllllllll}
\hline
Meta Analysis of Goldfeld-Quandt test for Heteroskedasticity \tabularnewline
Description & # significant tests & % significant tests & OK/NOK \tabularnewline
1% type I error level & 8 & 0.195121951219512 & NOK \tabularnewline
5% type I error level & 9 & 0.219512195121951 & NOK \tabularnewline
10% type I error level & 12 & 0.292682926829268 & NOK \tabularnewline
\hline
\end{tabular}
%Source: https://freestatistics.org/blog/index.php?pk=25735&T=6

[TABLE]
[ROW][C]Meta Analysis of Goldfeld-Quandt test for Heteroskedasticity[/C][/ROW]
[ROW][C]Description[/C][C]# significant tests[/C][C]% significant tests[/C][C]OK/NOK[/C][/ROW]
[ROW][C]1% type I error level[/C][C]8[/C][C]0.195121951219512[/C][C]NOK[/C][/ROW]
[ROW][C]5% type I error level[/C][C]9[/C][C]0.219512195121951[/C][C]NOK[/C][/ROW]
[ROW][C]10% type I error level[/C][C]12[/C][C]0.292682926829268[/C][C]NOK[/C][/ROW]
[/TABLE]
Source: https://freestatistics.org/blog/index.php?pk=25735&T=6

Globally Unique Identifier (entire table): ba.freestatistics.org/blog/index.php?pk=25735&T=6

As an alternative you can also use a QR Code:  

The GUIDs for individual cells are displayed in the table below:

Meta Analysis of Goldfeld-Quandt test for Heteroskedasticity
Description# significant tests% significant testsOK/NOK
1% type I error level80.195121951219512NOK
5% type I error level90.219512195121951NOK
10% type I error level120.292682926829268NOK


Parameters (Session):
par1 = 1 ; par2 = Include Monthly Dummies ; par3 = No Linear Trend ;
Parameters (R input):
par1 = 1 ; par2 = Include Monthly Dummies ; par3 = No Linear Trend ;
R code (references can be found in the software module):
library(lattice)
library(lmtest)
n25 <- 25 #minimum number of obs. for Goldfeld-Quandt test
par1 <- as.numeric(par1)
x <- t(y)
k <- length(x[1,])
n <- length(x[,1])
x1 <- cbind(x[,par1], x[,1:k!=par1])
mycolnames <- c(colnames(x)[par1], colnames(x)[1:k!=par1])
colnames(x1) <- mycolnames #colnames(x)[par1]
x <- x1
if (par3 == 'First Differences'){
x2 <- array(0, dim=c(n-1,k), dimnames=list(1:(n-1), paste('(1-B)',colnames(x),sep='')))
for (i in 1:n-1) {
for (j in 1:k) {
x2[i,j] <- x[i+1,j] - x[i,j]
}
}
x <- x2
}
if (par2 == 'Include Monthly Dummies'){
x2 <- array(0, dim=c(n,11), dimnames=list(1:n, paste('M', seq(1:11), sep ='')))
for (i in 1:11){
x2[seq(i,n,12),i] <- 1
}
x <- cbind(x, x2)
}
if (par2 == 'Include Quarterly Dummies'){
x2 <- array(0, dim=c(n,3), dimnames=list(1:n, paste('Q', seq(1:3), sep ='')))
for (i in 1:3){
x2[seq(i,n,4),i] <- 1
}
x <- cbind(x, x2)
}
k <- length(x[1,])
if (par3 == 'Linear Trend'){
x <- cbind(x, c(1:n))
colnames(x)[k+1] <- 't'
}
x
k <- length(x[1,])
df <- as.data.frame(x)
(mylm <- lm(df))
(mysum <- summary(mylm))
if (n > n25) {
kp3 <- k + 3
nmkm3 <- n - k - 3
gqarr <- array(NA, dim=c(nmkm3-kp3+1,3))
numgqtests <- 0
numsignificant1 <- 0
numsignificant5 <- 0
numsignificant10 <- 0
for (mypoint in kp3:nmkm3) {
j <- 0
numgqtests <- numgqtests + 1
for (myalt in c('greater', 'two.sided', 'less')) {
j <- j + 1
gqarr[mypoint-kp3+1,j] <- gqtest(mylm, point=mypoint, alternative=myalt)$p.value
}
if (gqarr[mypoint-kp3+1,2] < 0.01) numsignificant1 <- numsignificant1 + 1
if (gqarr[mypoint-kp3+1,2] < 0.05) numsignificant5 <- numsignificant5 + 1
if (gqarr[mypoint-kp3+1,2] < 0.10) numsignificant10 <- numsignificant10 + 1
}
gqarr
}
bitmap(file='test0.png')
plot(x[,1], type='l', main='Actuals and Interpolation', ylab='value of Actuals and Interpolation (dots)', xlab='time or index')
points(x[,1]-mysum$resid)
grid()
dev.off()
bitmap(file='test1.png')
plot(mysum$resid, type='b', pch=19, main='Residuals', ylab='value of Residuals', xlab='time or index')
grid()
dev.off()
bitmap(file='test2.png')
hist(mysum$resid, main='Residual Histogram', xlab='values of Residuals')
grid()
dev.off()
bitmap(file='test3.png')
densityplot(~mysum$resid,col='black',main='Residual Density Plot', xlab='values of Residuals')
dev.off()
bitmap(file='test4.png')
qqnorm(mysum$resid, main='Residual Normal Q-Q Plot')
qqline(mysum$resid)
grid()
dev.off()
(myerror <- as.ts(mysum$resid))
bitmap(file='test5.png')
dum <- cbind(lag(myerror,k=1),myerror)
dum
dum1 <- dum[2:length(myerror),]
dum1
z <- as.data.frame(dum1)
z
plot(z,main=paste('Residual Lag plot, lowess, and regression line'), ylab='values of Residuals', xlab='lagged values of Residuals')
lines(lowess(z))
abline(lm(z))
grid()
dev.off()
bitmap(file='test6.png')
acf(mysum$resid, lag.max=length(mysum$resid)/2, main='Residual Autocorrelation Function')
grid()
dev.off()
bitmap(file='test7.png')
pacf(mysum$resid, lag.max=length(mysum$resid)/2, main='Residual Partial Autocorrelation Function')
grid()
dev.off()
bitmap(file='test8.png')
opar <- par(mfrow = c(2,2), oma = c(0, 0, 1.1, 0))
plot(mylm, las = 1, sub='Residual Diagnostics')
par(opar)
dev.off()
if (n > n25) {
bitmap(file='test9.png')
plot(kp3:nmkm3,gqarr[,2], main='Goldfeld-Quandt test',ylab='2-sided p-value',xlab='breakpoint')
grid()
dev.off()
}
load(file='createtable')
a<-table.start()
a<-table.row.start(a)
a<-table.element(a, 'Multiple Linear Regression - Estimated Regression Equation', 1, TRUE)
a<-table.row.end(a)
myeq <- colnames(x)[1]
myeq <- paste(myeq, '[t] = ', sep='')
for (i in 1:k){
if (mysum$coefficients[i,1] > 0) myeq <- paste(myeq, '+', '')
myeq <- paste(myeq, mysum$coefficients[i,1], sep=' ')
if (rownames(mysum$coefficients)[i] != '(Intercept)') {
myeq <- paste(myeq, rownames(mysum$coefficients)[i], sep='')
if (rownames(mysum$coefficients)[i] != 't') myeq <- paste(myeq, '[t]', sep='')
}
}
myeq <- paste(myeq, ' + e[t]')
a<-table.row.start(a)
a<-table.element(a, myeq)
a<-table.row.end(a)
a<-table.end(a)
table.save(a,file='mytable1.tab')
a<-table.start()
a<-table.row.start(a)
a<-table.element(a,hyperlink('ols1.htm','Multiple Linear Regression - Ordinary Least Squares',''), 6, TRUE)
a<-table.row.end(a)
a<-table.row.start(a)
a<-table.element(a,'Variable',header=TRUE)
a<-table.element(a,'Parameter',header=TRUE)
a<-table.element(a,'S.D.',header=TRUE)
a<-table.element(a,'T-STAT
H0: parameter = 0',header=TRUE)
a<-table.element(a,'2-tail p-value',header=TRUE)
a<-table.element(a,'1-tail p-value',header=TRUE)
a<-table.row.end(a)
for (i in 1:k){
a<-table.row.start(a)
a<-table.element(a,rownames(mysum$coefficients)[i],header=TRUE)
a<-table.element(a,mysum$coefficients[i,1])
a<-table.element(a, round(mysum$coefficients[i,2],6))
a<-table.element(a, round(mysum$coefficients[i,3],4))
a<-table.element(a, round(mysum$coefficients[i,4],6))
a<-table.element(a, round(mysum$coefficients[i,4]/2,6))
a<-table.row.end(a)
}
a<-table.end(a)
table.save(a,file='mytable2.tab')
a<-table.start()
a<-table.row.start(a)
a<-table.element(a, 'Multiple Linear Regression - Regression Statistics', 2, TRUE)
a<-table.row.end(a)
a<-table.row.start(a)
a<-table.element(a, 'Multiple R',1,TRUE)
a<-table.element(a, sqrt(mysum$r.squared))
a<-table.row.end(a)
a<-table.row.start(a)
a<-table.element(a, 'R-squared',1,TRUE)
a<-table.element(a, mysum$r.squared)
a<-table.row.end(a)
a<-table.row.start(a)
a<-table.element(a, 'Adjusted R-squared',1,TRUE)
a<-table.element(a, mysum$adj.r.squared)
a<-table.row.end(a)
a<-table.row.start(a)
a<-table.element(a, 'F-TEST (value)',1,TRUE)
a<-table.element(a, mysum$fstatistic[1])
a<-table.row.end(a)
a<-table.row.start(a)
a<-table.element(a, 'F-TEST (DF numerator)',1,TRUE)
a<-table.element(a, mysum$fstatistic[2])
a<-table.row.end(a)
a<-table.row.start(a)
a<-table.element(a, 'F-TEST (DF denominator)',1,TRUE)
a<-table.element(a, mysum$fstatistic[3])
a<-table.row.end(a)
a<-table.row.start(a)
a<-table.element(a, 'p-value',1,TRUE)
a<-table.element(a, 1-pf(mysum$fstatistic[1],mysum$fstatistic[2],mysum$fstatistic[3]))
a<-table.row.end(a)
a<-table.row.start(a)
a<-table.element(a, 'Multiple Linear Regression - Residual Statistics', 2, TRUE)
a<-table.row.end(a)
a<-table.row.start(a)
a<-table.element(a, 'Residual Standard Deviation',1,TRUE)
a<-table.element(a, mysum$sigma)
a<-table.row.end(a)
a<-table.row.start(a)
a<-table.element(a, 'Sum Squared Residuals',1,TRUE)
a<-table.element(a, sum(myerror*myerror))
a<-table.row.end(a)
a<-table.end(a)
table.save(a,file='mytable3.tab')
a<-table.start()
a<-table.row.start(a)
a<-table.element(a, 'Multiple Linear Regression - Actuals, Interpolation, and Residuals', 4, TRUE)
a<-table.row.end(a)
a<-table.row.start(a)
a<-table.element(a, 'Time or Index', 1, TRUE)
a<-table.element(a, 'Actuals', 1, TRUE)
a<-table.element(a, 'Interpolation
Forecast', 1, TRUE)
a<-table.element(a, 'Residuals
Prediction Error', 1, TRUE)
a<-table.row.end(a)
for (i in 1:n) {
a<-table.row.start(a)
a<-table.element(a,i, 1, TRUE)
a<-table.element(a,x[i])
a<-table.element(a,x[i]-mysum$resid[i])
a<-table.element(a,mysum$resid[i])
a<-table.row.end(a)
}
a<-table.end(a)
table.save(a,file='mytable4.tab')
if (n > n25) {
a<-table.start()
a<-table.row.start(a)
a<-table.element(a,'Goldfeld-Quandt test for Heteroskedasticity',4,TRUE)
a<-table.row.end(a)
a<-table.row.start(a)
a<-table.element(a,'p-values',header=TRUE)
a<-table.element(a,'Alternative Hypothesis',3,header=TRUE)
a<-table.row.end(a)
a<-table.row.start(a)
a<-table.element(a,'breakpoint index',header=TRUE)
a<-table.element(a,'greater',header=TRUE)
a<-table.element(a,'2-sided',header=TRUE)
a<-table.element(a,'less',header=TRUE)
a<-table.row.end(a)
for (mypoint in kp3:nmkm3) {
a<-table.row.start(a)
a<-table.element(a,mypoint,header=TRUE)
a<-table.element(a,gqarr[mypoint-kp3+1,1])
a<-table.element(a,gqarr[mypoint-kp3+1,2])
a<-table.element(a,gqarr[mypoint-kp3+1,3])
a<-table.row.end(a)
}
a<-table.end(a)
table.save(a,file='mytable5.tab')
a<-table.start()
a<-table.row.start(a)
a<-table.element(a,'Meta Analysis of Goldfeld-Quandt test for Heteroskedasticity',4,TRUE)
a<-table.row.end(a)
a<-table.row.start(a)
a<-table.element(a,'Description',header=TRUE)
a<-table.element(a,'# significant tests',header=TRUE)
a<-table.element(a,'% significant tests',header=TRUE)
a<-table.element(a,'OK/NOK',header=TRUE)
a<-table.row.end(a)
a<-table.row.start(a)
a<-table.element(a,'1% type I error level',header=TRUE)
a<-table.element(a,numsignificant1)
a<-table.element(a,numsignificant1/numgqtests)
if (numsignificant1/numgqtests < 0.01) dum <- 'OK' else dum <- 'NOK'
a<-table.element(a,dum)
a<-table.row.end(a)
a<-table.row.start(a)
a<-table.element(a,'5% type I error level',header=TRUE)
a<-table.element(a,numsignificant5)
a<-table.element(a,numsignificant5/numgqtests)
if (numsignificant5/numgqtests < 0.05) dum <- 'OK' else dum <- 'NOK'
a<-table.element(a,dum)
a<-table.row.end(a)
a<-table.row.start(a)
a<-table.element(a,'10% type I error level',header=TRUE)
a<-table.element(a,numsignificant10)
a<-table.element(a,numsignificant10/numgqtests)
if (numsignificant10/numgqtests < 0.1) dum <- 'OK' else dum <- 'NOK'
a<-table.element(a,dum)
a<-table.row.end(a)
a<-table.end(a)
table.save(a,file='mytable6.tab')
}