Free Statistics

of Irreproducible Research!

Author's title

Author*The author of this computation has been verified*
R Software Modulerwasp_multipleregression.wasp
Title produced by softwareMultiple Regression
Date of computationThu, 27 Nov 2008 01:44:22 -0700
Cite this page as followsStatistical Computations at FreeStatistics.org, Office for Research Development and Education, URL https://freestatistics.org/blog/index.php?v=date/2008/Nov/27/t1227775557h3amlu4frklmejn.htm/, Retrieved Sun, 19 May 2024 11:32:29 +0000
Statistical Computations at FreeStatistics.org, Office for Research Development and Education, URL https://freestatistics.org/blog/index.php?pk=25726, Retrieved Sun, 19 May 2024 11:32:29 +0000
QR Codes:

Original text written by user:
IsPrivate?No (this computation is public)
User-defined keywords
Estimated Impact199
Family? (F = Feedback message, R = changed R code, M = changed R Module, P = changed Parameters, D = changed Data)
F     [Multiple Regression] [] [2007-11-19 19:55:31] [b731da8b544846036771bbf9bf2f34ce]
F R  D  [Multiple Regression] [marlies.polfliet_...] [2008-11-22 10:33:23] [fdc296cbeb5d8064cb0dbd634c3fdc55]
F    D      [Multiple Regression] [tinneke_debock.wo...] [2008-11-27 08:44:22] [20137734a2343a7bbbd59daaec7ad301] [Current]
F   P         [Multiple Regression] [tinneke_debock.wo...] [2008-11-27 08:57:07] [f9c5a49917ff87aeb076072f2749ef70]
Feedback Forum
2008-12-01 20:03:31 [Annemiek Hoofman] [reply
In de 1e grafiek zie ik niet echt een dalende trend.
De residual Q-Q plot is niet helemaal zoals hij zou moeten zijn,
want de 'bolletjes' vormen niet een rechte lijn.
Je hebt wel een goede voorspelling gedaan en je weet hoe je de formule
in excel moet toepassen en verder uitbreiden.
Ik vond wel dat je de voorspelling mocht berekenen over een periode
van ongeveer een jaar (dus +/- 12 voorspellingen), dan zou je beter zien
hoe de formule zich gaat gedragen op een langere termijn.
Maar toch vind ik het een goede oplossing van de 2 vragen.
2008-12-01 21:24:51 [Tinneke De Bock] [reply
Achteraf gezien had ik zeker nog kunnen uitleggen waarom we hier gebruik moeten maken van een model met monthly seasonal dummies en een lineaire trend. Het model zonder deze beide voldeed niet aan de assumpties voor een goed model:
- de residu’s moeten constant zij en gelijk aan nul
- er mag geen autocorrelatie aanwezig zijn (en ook een patroon moeten we vermijden)

De standaardfout is voor enkele maanden groter dan de waarde van de parameter. Aangezien de standaardfout weergeeft met hoeveel deze waarde nog kan schommelen, zijn er waarden bij die evengoed opsitief konden zijn in plaats van negatief en omgekeerd. Hierdoor kunnen we over deze parameters geen uitspraak doen.

Bij de t-verdeling zijn lang niet alle absolute waarden groter dan 2. Het verschil tussen de twee waarden voor de productie van consumptiegoederen is dus niet significant.

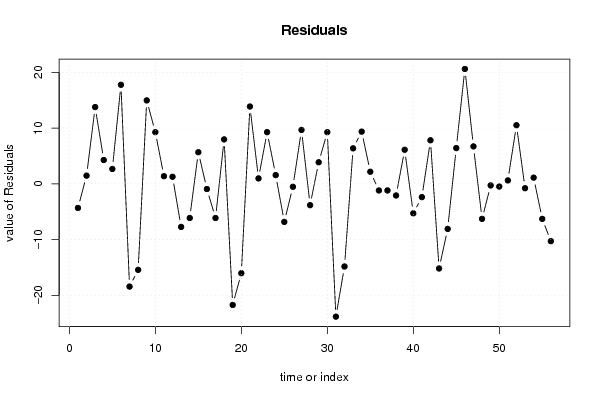
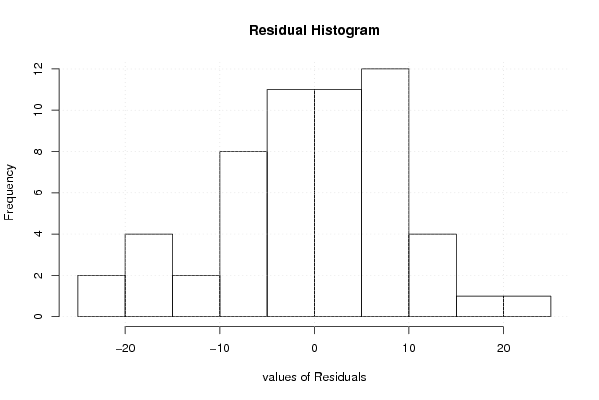
De residuals zijn weliswaar zeer verspreid, maar we kunnen ook zien dat ze gemiddeld genomen wel rond nul schommelen.

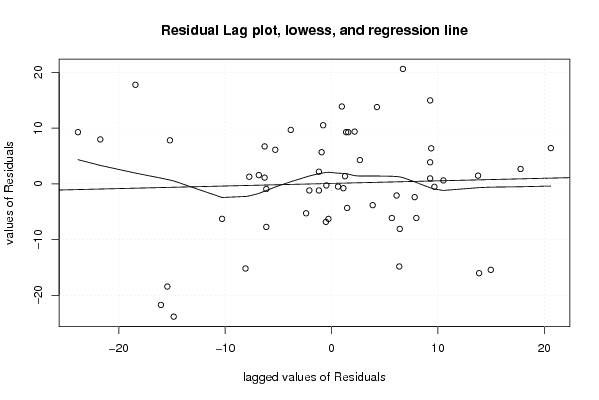
Aangezien er weinig correlatie is tussen de voorspellingsfout van deze maand en die van vorige maand kunnen we hieruit juist afleiden dat het een goed model is, en geen slecht zoals ik eerder aannam.

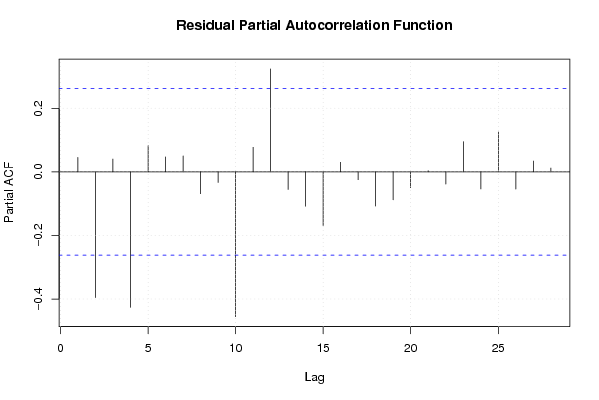
Bij de autocorrelatie van de residu’s kunnen we ook nog een duidelijk golvend patroon zien, waardoor het model zeker nog voor verbetering vatbaar is.

Post a new message
Dataseries X:
71.7	0
77.5	0
89.8	0
80.3	0
78.7	0
93.8	0
57.6	0
60.6	0
91	0
85.3	0
77.4	0
77.3	0
68.3	0
69.9	0
81.7	0
75.1	0
69.9	0
84	0
54.3	0
60	0
89.9	0
77	0
85.3	0
77.6	0
69.2	0
75.5	0
85.7	0
72.2	0
79.9	0
85.3	0
52.2	0
61.2	0
82.4	0
85.4	0
78.2	0
70.2	1
70.2	1
69.3	1
77.5	1
66.1	1
69	1
79.2	1
56.2	1
63.3	1
77.8	1
92	1
78.1	1
65.1	1
71.1	1
70.9	1
72	1
81.9	1
70.6	1
72.5	1
65.1	1
61.1	1


Summary of computational transaction
Raw Inputview raw input (R code)
Raw Outputview raw output of R engine
Computing time7 seconds
R Server'Herman Ole Andreas Wold' @ 193.190.124.10:1001

\begin{tabular}{lllllllll}
\hline
Summary of computational transaction \tabularnewline
Raw Input & view raw input (R code)  \tabularnewline
Raw Output & view raw output of R engine  \tabularnewline
Computing time & 7 seconds \tabularnewline
R Server & 'Herman Ole Andreas Wold' @ 193.190.124.10:1001 \tabularnewline
\hline
\end{tabular}
%Source: https://freestatistics.org/blog/index.php?pk=25726&T=0

[TABLE]
[ROW][C]Summary of computational transaction[/C][/ROW]
[ROW][C]Raw Input[/C][C]view raw input (R code) [/C][/ROW]
[ROW][C]Raw Output[/C][C]view raw output of R engine [/C][/ROW]
[ROW][C]Computing time[/C][C]7 seconds[/C][/ROW]
[ROW][C]R Server[/C][C]'Herman Ole Andreas Wold' @ 193.190.124.10:1001[/C][/ROW]
[/TABLE]
Source: https://freestatistics.org/blog/index.php?pk=25726&T=0

Globally Unique Identifier (entire table): ba.freestatistics.org/blog/index.php?pk=25726&T=0

As an alternative you can also use a QR Code:  

The GUIDs for individual cells are displayed in the table below:

Summary of computational transaction
Raw Inputview raw input (R code)
Raw Outputview raw output of R engine
Computing time7 seconds
R Server'Herman Ole Andreas Wold' @ 193.190.124.10:1001


Multiple Linear Regression - Estimated Regression Equation
y[t] = + 76.0342857142857 -4.64380952380953x[t] + e[t]

\begin{tabular}{lllllllll}
\hline
Multiple Linear Regression - Estimated Regression Equation \tabularnewline
y[t] =  +  76.0342857142857 -4.64380952380953x[t]  + e[t] \tabularnewline
\hline
\end{tabular}
%Source: https://freestatistics.org/blog/index.php?pk=25726&T=1

[TABLE]
[ROW][C]Multiple Linear Regression - Estimated Regression Equation[/C][/ROW]
[ROW][C]y[t] =  +  76.0342857142857 -4.64380952380953x[t]  + e[t][/C][/ROW]
[/TABLE]
Source: https://freestatistics.org/blog/index.php?pk=25726&T=1

Globally Unique Identifier (entire table): ba.freestatistics.org/blog/index.php?pk=25726&T=1

As an alternative you can also use a QR Code:  

The GUIDs for individual cells are displayed in the table below:

Multiple Linear Regression - Estimated Regression Equation
y[t] = + 76.0342857142857 -4.64380952380953x[t] + e[t]


Multiple Linear Regression - Ordinary Least Squares
VariableParameterS.D.T-STATH0: parameter = 02-tail p-value1-tail p-value
(Intercept)76.03428571428571.64372446.257300
x-4.643809523809532.68419-1.73010.0893320.044666

\begin{tabular}{lllllllll}
\hline
Multiple Linear Regression - Ordinary Least Squares \tabularnewline
Variable & Parameter & S.D. & T-STATH0: parameter = 0 & 2-tail p-value & 1-tail p-value \tabularnewline
(Intercept) & 76.0342857142857 & 1.643724 & 46.2573 & 0 & 0 \tabularnewline
x & -4.64380952380953 & 2.68419 & -1.7301 & 0.089332 & 0.044666 \tabularnewline
\hline
\end{tabular}
%Source: https://freestatistics.org/blog/index.php?pk=25726&T=2

[TABLE]
[ROW][C]Multiple Linear Regression - Ordinary Least Squares[/C][/ROW]
[ROW][C]Variable[/C][C]Parameter[/C][C]S.D.[/C][C]T-STATH0: parameter = 0[/C][C]2-tail p-value[/C][C]1-tail p-value[/C][/ROW]
[ROW][C](Intercept)[/C][C]76.0342857142857[/C][C]1.643724[/C][C]46.2573[/C][C]0[/C][C]0[/C][/ROW]
[ROW][C]x[/C][C]-4.64380952380953[/C][C]2.68419[/C][C]-1.7301[/C][C]0.089332[/C][C]0.044666[/C][/ROW]
[/TABLE]
Source: https://freestatistics.org/blog/index.php?pk=25726&T=2

Globally Unique Identifier (entire table): ba.freestatistics.org/blog/index.php?pk=25726&T=2

As an alternative you can also use a QR Code:  

The GUIDs for individual cells are displayed in the table below:

Multiple Linear Regression - Ordinary Least Squares
VariableParameterS.D.T-STATH0: parameter = 02-tail p-value1-tail p-value
(Intercept)76.03428571428571.64372446.257300
x-4.643809523809532.68419-1.73010.0893320.044666


Multiple Linear Regression - Regression Statistics
Multiple R0.229165866246844
R-squared0.0525169942526664
Adjusted R-squared0.0349710126647527
F-TEST (value)2.99310665462241
F-TEST (DF numerator)1
F-TEST (DF denominator)54
p-value0.089331820204528
Multiple Linear Regression - Residual Statistics
Residual Standard Deviation9.72440320208311
Sum Squared Residuals5106.45695238095

\begin{tabular}{lllllllll}
\hline
Multiple Linear Regression - Regression Statistics \tabularnewline
Multiple R & 0.229165866246844 \tabularnewline
R-squared & 0.0525169942526664 \tabularnewline
Adjusted R-squared & 0.0349710126647527 \tabularnewline
F-TEST (value) & 2.99310665462241 \tabularnewline
F-TEST (DF numerator) & 1 \tabularnewline
F-TEST (DF denominator) & 54 \tabularnewline
p-value & 0.089331820204528 \tabularnewline
Multiple Linear Regression - Residual Statistics \tabularnewline
Residual Standard Deviation & 9.72440320208311 \tabularnewline
Sum Squared Residuals & 5106.45695238095 \tabularnewline
\hline
\end{tabular}
%Source: https://freestatistics.org/blog/index.php?pk=25726&T=3

[TABLE]
[ROW][C]Multiple Linear Regression - Regression Statistics[/C][/ROW]
[ROW][C]Multiple R[/C][C]0.229165866246844[/C][/ROW]
[ROW][C]R-squared[/C][C]0.0525169942526664[/C][/ROW]
[ROW][C]Adjusted R-squared[/C][C]0.0349710126647527[/C][/ROW]
[ROW][C]F-TEST (value)[/C][C]2.99310665462241[/C][/ROW]
[ROW][C]F-TEST (DF numerator)[/C][C]1[/C][/ROW]
[ROW][C]F-TEST (DF denominator)[/C][C]54[/C][/ROW]
[ROW][C]p-value[/C][C]0.089331820204528[/C][/ROW]
[ROW][C]Multiple Linear Regression - Residual Statistics[/C][/ROW]
[ROW][C]Residual Standard Deviation[/C][C]9.72440320208311[/C][/ROW]
[ROW][C]Sum Squared Residuals[/C][C]5106.45695238095[/C][/ROW]
[/TABLE]
Source: https://freestatistics.org/blog/index.php?pk=25726&T=3

Globally Unique Identifier (entire table): ba.freestatistics.org/blog/index.php?pk=25726&T=3

As an alternative you can also use a QR Code:  

The GUIDs for individual cells are displayed in the table below:

Multiple Linear Regression - Regression Statistics
Multiple R0.229165866246844
R-squared0.0525169942526664
Adjusted R-squared0.0349710126647527
F-TEST (value)2.99310665462241
F-TEST (DF numerator)1
F-TEST (DF denominator)54
p-value0.089331820204528
Multiple Linear Regression - Residual Statistics
Residual Standard Deviation9.72440320208311
Sum Squared Residuals5106.45695238095


Multiple Linear Regression - Actuals, Interpolation, and Residuals
Time or IndexActualsInterpolationForecastResidualsPrediction Error
171.776.0342857142857-4.33428571428569
277.576.03428571428571.46571428571428
389.876.034285714285713.7657142857143
480.376.03428571428574.26571428571428
578.776.03428571428572.66571428571429
693.876.034285714285717.7657142857143
757.676.0342857142857-18.4342857142857
860.676.0342857142857-15.4342857142857
99176.034285714285714.9657142857143
1085.376.03428571428579.26571428571428
1177.476.03428571428571.36571428571429
1277.376.03428571428571.26571428571428
1368.376.0342857142857-7.73428571428572
1469.976.0342857142857-6.13428571428571
1581.776.03428571428575.66571428571429
1675.176.0342857142857-0.934285714285722
1769.976.0342857142857-6.13428571428571
188476.03428571428577.96571428571428
1954.376.0342857142857-21.7342857142857
206076.0342857142857-16.0342857142857
2189.976.034285714285713.8657142857143
227776.03428571428570.965714285714284
2385.376.03428571428579.26571428571428
2477.676.03428571428571.56571428571428
2569.276.0342857142857-6.83428571428571
2675.576.0342857142857-0.534285714285716
2785.776.03428571428579.66571428571429
2872.276.0342857142857-3.83428571428571
2979.976.03428571428573.86571428571429
3085.376.03428571428579.26571428571428
3152.276.0342857142857-23.8342857142857
3261.276.0342857142857-14.8342857142857
3382.476.03428571428576.36571428571429
3485.476.03428571428579.36571428571429
3578.276.03428571428572.16571428571429
3670.271.3904761904762-1.19047619047619
3770.271.3904761904762-1.19047619047619
3869.371.3904761904762-2.09047619047619
3977.571.39047619047626.10952380952381
4066.171.3904761904762-5.2904761904762
416971.3904761904762-2.39047619047619
4279.271.39047619047627.80952380952381
4356.271.3904761904762-15.1904761904762
4463.371.3904761904762-8.0904761904762
4577.871.39047619047626.40952380952381
469271.390476190476220.6095238095238
4778.171.39047619047626.7095238095238
4865.171.3904761904762-6.2904761904762
4971.171.3904761904762-0.290476190476196
5070.971.3904761904762-0.490476190476184
517271.39047619047620.60952380952381
5281.971.390476190476210.5095238095238
5370.671.3904761904762-0.790476190476196
5472.571.39047619047621.10952380952381
5565.171.3904761904762-6.2904761904762
5661.171.3904761904762-10.2904761904762

\begin{tabular}{lllllllll}
\hline
Multiple Linear Regression - Actuals, Interpolation, and Residuals \tabularnewline
Time or Index & Actuals & InterpolationForecast & ResidualsPrediction Error \tabularnewline
1 & 71.7 & 76.0342857142857 & -4.33428571428569 \tabularnewline
2 & 77.5 & 76.0342857142857 & 1.46571428571428 \tabularnewline
3 & 89.8 & 76.0342857142857 & 13.7657142857143 \tabularnewline
4 & 80.3 & 76.0342857142857 & 4.26571428571428 \tabularnewline
5 & 78.7 & 76.0342857142857 & 2.66571428571429 \tabularnewline
6 & 93.8 & 76.0342857142857 & 17.7657142857143 \tabularnewline
7 & 57.6 & 76.0342857142857 & -18.4342857142857 \tabularnewline
8 & 60.6 & 76.0342857142857 & -15.4342857142857 \tabularnewline
9 & 91 & 76.0342857142857 & 14.9657142857143 \tabularnewline
10 & 85.3 & 76.0342857142857 & 9.26571428571428 \tabularnewline
11 & 77.4 & 76.0342857142857 & 1.36571428571429 \tabularnewline
12 & 77.3 & 76.0342857142857 & 1.26571428571428 \tabularnewline
13 & 68.3 & 76.0342857142857 & -7.73428571428572 \tabularnewline
14 & 69.9 & 76.0342857142857 & -6.13428571428571 \tabularnewline
15 & 81.7 & 76.0342857142857 & 5.66571428571429 \tabularnewline
16 & 75.1 & 76.0342857142857 & -0.934285714285722 \tabularnewline
17 & 69.9 & 76.0342857142857 & -6.13428571428571 \tabularnewline
18 & 84 & 76.0342857142857 & 7.96571428571428 \tabularnewline
19 & 54.3 & 76.0342857142857 & -21.7342857142857 \tabularnewline
20 & 60 & 76.0342857142857 & -16.0342857142857 \tabularnewline
21 & 89.9 & 76.0342857142857 & 13.8657142857143 \tabularnewline
22 & 77 & 76.0342857142857 & 0.965714285714284 \tabularnewline
23 & 85.3 & 76.0342857142857 & 9.26571428571428 \tabularnewline
24 & 77.6 & 76.0342857142857 & 1.56571428571428 \tabularnewline
25 & 69.2 & 76.0342857142857 & -6.83428571428571 \tabularnewline
26 & 75.5 & 76.0342857142857 & -0.534285714285716 \tabularnewline
27 & 85.7 & 76.0342857142857 & 9.66571428571429 \tabularnewline
28 & 72.2 & 76.0342857142857 & -3.83428571428571 \tabularnewline
29 & 79.9 & 76.0342857142857 & 3.86571428571429 \tabularnewline
30 & 85.3 & 76.0342857142857 & 9.26571428571428 \tabularnewline
31 & 52.2 & 76.0342857142857 & -23.8342857142857 \tabularnewline
32 & 61.2 & 76.0342857142857 & -14.8342857142857 \tabularnewline
33 & 82.4 & 76.0342857142857 & 6.36571428571429 \tabularnewline
34 & 85.4 & 76.0342857142857 & 9.36571428571429 \tabularnewline
35 & 78.2 & 76.0342857142857 & 2.16571428571429 \tabularnewline
36 & 70.2 & 71.3904761904762 & -1.19047619047619 \tabularnewline
37 & 70.2 & 71.3904761904762 & -1.19047619047619 \tabularnewline
38 & 69.3 & 71.3904761904762 & -2.09047619047619 \tabularnewline
39 & 77.5 & 71.3904761904762 & 6.10952380952381 \tabularnewline
40 & 66.1 & 71.3904761904762 & -5.2904761904762 \tabularnewline
41 & 69 & 71.3904761904762 & -2.39047619047619 \tabularnewline
42 & 79.2 & 71.3904761904762 & 7.80952380952381 \tabularnewline
43 & 56.2 & 71.3904761904762 & -15.1904761904762 \tabularnewline
44 & 63.3 & 71.3904761904762 & -8.0904761904762 \tabularnewline
45 & 77.8 & 71.3904761904762 & 6.40952380952381 \tabularnewline
46 & 92 & 71.3904761904762 & 20.6095238095238 \tabularnewline
47 & 78.1 & 71.3904761904762 & 6.7095238095238 \tabularnewline
48 & 65.1 & 71.3904761904762 & -6.2904761904762 \tabularnewline
49 & 71.1 & 71.3904761904762 & -0.290476190476196 \tabularnewline
50 & 70.9 & 71.3904761904762 & -0.490476190476184 \tabularnewline
51 & 72 & 71.3904761904762 & 0.60952380952381 \tabularnewline
52 & 81.9 & 71.3904761904762 & 10.5095238095238 \tabularnewline
53 & 70.6 & 71.3904761904762 & -0.790476190476196 \tabularnewline
54 & 72.5 & 71.3904761904762 & 1.10952380952381 \tabularnewline
55 & 65.1 & 71.3904761904762 & -6.2904761904762 \tabularnewline
56 & 61.1 & 71.3904761904762 & -10.2904761904762 \tabularnewline
\hline
\end{tabular}
%Source: https://freestatistics.org/blog/index.php?pk=25726&T=4

[TABLE]
[ROW][C]Multiple Linear Regression - Actuals, Interpolation, and Residuals[/C][/ROW]
[ROW][C]Time or Index[/C][C]Actuals[/C][C]InterpolationForecast[/C][C]ResidualsPrediction Error[/C][/ROW]
[ROW][C]1[/C][C]71.7[/C][C]76.0342857142857[/C][C]-4.33428571428569[/C][/ROW]
[ROW][C]2[/C][C]77.5[/C][C]76.0342857142857[/C][C]1.46571428571428[/C][/ROW]
[ROW][C]3[/C][C]89.8[/C][C]76.0342857142857[/C][C]13.7657142857143[/C][/ROW]
[ROW][C]4[/C][C]80.3[/C][C]76.0342857142857[/C][C]4.26571428571428[/C][/ROW]
[ROW][C]5[/C][C]78.7[/C][C]76.0342857142857[/C][C]2.66571428571429[/C][/ROW]
[ROW][C]6[/C][C]93.8[/C][C]76.0342857142857[/C][C]17.7657142857143[/C][/ROW]
[ROW][C]7[/C][C]57.6[/C][C]76.0342857142857[/C][C]-18.4342857142857[/C][/ROW]
[ROW][C]8[/C][C]60.6[/C][C]76.0342857142857[/C][C]-15.4342857142857[/C][/ROW]
[ROW][C]9[/C][C]91[/C][C]76.0342857142857[/C][C]14.9657142857143[/C][/ROW]
[ROW][C]10[/C][C]85.3[/C][C]76.0342857142857[/C][C]9.26571428571428[/C][/ROW]
[ROW][C]11[/C][C]77.4[/C][C]76.0342857142857[/C][C]1.36571428571429[/C][/ROW]
[ROW][C]12[/C][C]77.3[/C][C]76.0342857142857[/C][C]1.26571428571428[/C][/ROW]
[ROW][C]13[/C][C]68.3[/C][C]76.0342857142857[/C][C]-7.73428571428572[/C][/ROW]
[ROW][C]14[/C][C]69.9[/C][C]76.0342857142857[/C][C]-6.13428571428571[/C][/ROW]
[ROW][C]15[/C][C]81.7[/C][C]76.0342857142857[/C][C]5.66571428571429[/C][/ROW]
[ROW][C]16[/C][C]75.1[/C][C]76.0342857142857[/C][C]-0.934285714285722[/C][/ROW]
[ROW][C]17[/C][C]69.9[/C][C]76.0342857142857[/C][C]-6.13428571428571[/C][/ROW]
[ROW][C]18[/C][C]84[/C][C]76.0342857142857[/C][C]7.96571428571428[/C][/ROW]
[ROW][C]19[/C][C]54.3[/C][C]76.0342857142857[/C][C]-21.7342857142857[/C][/ROW]
[ROW][C]20[/C][C]60[/C][C]76.0342857142857[/C][C]-16.0342857142857[/C][/ROW]
[ROW][C]21[/C][C]89.9[/C][C]76.0342857142857[/C][C]13.8657142857143[/C][/ROW]
[ROW][C]22[/C][C]77[/C][C]76.0342857142857[/C][C]0.965714285714284[/C][/ROW]
[ROW][C]23[/C][C]85.3[/C][C]76.0342857142857[/C][C]9.26571428571428[/C][/ROW]
[ROW][C]24[/C][C]77.6[/C][C]76.0342857142857[/C][C]1.56571428571428[/C][/ROW]
[ROW][C]25[/C][C]69.2[/C][C]76.0342857142857[/C][C]-6.83428571428571[/C][/ROW]
[ROW][C]26[/C][C]75.5[/C][C]76.0342857142857[/C][C]-0.534285714285716[/C][/ROW]
[ROW][C]27[/C][C]85.7[/C][C]76.0342857142857[/C][C]9.66571428571429[/C][/ROW]
[ROW][C]28[/C][C]72.2[/C][C]76.0342857142857[/C][C]-3.83428571428571[/C][/ROW]
[ROW][C]29[/C][C]79.9[/C][C]76.0342857142857[/C][C]3.86571428571429[/C][/ROW]
[ROW][C]30[/C][C]85.3[/C][C]76.0342857142857[/C][C]9.26571428571428[/C][/ROW]
[ROW][C]31[/C][C]52.2[/C][C]76.0342857142857[/C][C]-23.8342857142857[/C][/ROW]
[ROW][C]32[/C][C]61.2[/C][C]76.0342857142857[/C][C]-14.8342857142857[/C][/ROW]
[ROW][C]33[/C][C]82.4[/C][C]76.0342857142857[/C][C]6.36571428571429[/C][/ROW]
[ROW][C]34[/C][C]85.4[/C][C]76.0342857142857[/C][C]9.36571428571429[/C][/ROW]
[ROW][C]35[/C][C]78.2[/C][C]76.0342857142857[/C][C]2.16571428571429[/C][/ROW]
[ROW][C]36[/C][C]70.2[/C][C]71.3904761904762[/C][C]-1.19047619047619[/C][/ROW]
[ROW][C]37[/C][C]70.2[/C][C]71.3904761904762[/C][C]-1.19047619047619[/C][/ROW]
[ROW][C]38[/C][C]69.3[/C][C]71.3904761904762[/C][C]-2.09047619047619[/C][/ROW]
[ROW][C]39[/C][C]77.5[/C][C]71.3904761904762[/C][C]6.10952380952381[/C][/ROW]
[ROW][C]40[/C][C]66.1[/C][C]71.3904761904762[/C][C]-5.2904761904762[/C][/ROW]
[ROW][C]41[/C][C]69[/C][C]71.3904761904762[/C][C]-2.39047619047619[/C][/ROW]
[ROW][C]42[/C][C]79.2[/C][C]71.3904761904762[/C][C]7.80952380952381[/C][/ROW]
[ROW][C]43[/C][C]56.2[/C][C]71.3904761904762[/C][C]-15.1904761904762[/C][/ROW]
[ROW][C]44[/C][C]63.3[/C][C]71.3904761904762[/C][C]-8.0904761904762[/C][/ROW]
[ROW][C]45[/C][C]77.8[/C][C]71.3904761904762[/C][C]6.40952380952381[/C][/ROW]
[ROW][C]46[/C][C]92[/C][C]71.3904761904762[/C][C]20.6095238095238[/C][/ROW]
[ROW][C]47[/C][C]78.1[/C][C]71.3904761904762[/C][C]6.7095238095238[/C][/ROW]
[ROW][C]48[/C][C]65.1[/C][C]71.3904761904762[/C][C]-6.2904761904762[/C][/ROW]
[ROW][C]49[/C][C]71.1[/C][C]71.3904761904762[/C][C]-0.290476190476196[/C][/ROW]
[ROW][C]50[/C][C]70.9[/C][C]71.3904761904762[/C][C]-0.490476190476184[/C][/ROW]
[ROW][C]51[/C][C]72[/C][C]71.3904761904762[/C][C]0.60952380952381[/C][/ROW]
[ROW][C]52[/C][C]81.9[/C][C]71.3904761904762[/C][C]10.5095238095238[/C][/ROW]
[ROW][C]53[/C][C]70.6[/C][C]71.3904761904762[/C][C]-0.790476190476196[/C][/ROW]
[ROW][C]54[/C][C]72.5[/C][C]71.3904761904762[/C][C]1.10952380952381[/C][/ROW]
[ROW][C]55[/C][C]65.1[/C][C]71.3904761904762[/C][C]-6.2904761904762[/C][/ROW]
[ROW][C]56[/C][C]61.1[/C][C]71.3904761904762[/C][C]-10.2904761904762[/C][/ROW]
[/TABLE]
Source: https://freestatistics.org/blog/index.php?pk=25726&T=4

Globally Unique Identifier (entire table): ba.freestatistics.org/blog/index.php?pk=25726&T=4

As an alternative you can also use a QR Code:  

The GUIDs for individual cells are displayed in the table below:

Multiple Linear Regression - Actuals, Interpolation, and Residuals
Time or IndexActualsInterpolationForecastResidualsPrediction Error
171.776.0342857142857-4.33428571428569
277.576.03428571428571.46571428571428
389.876.034285714285713.7657142857143
480.376.03428571428574.26571428571428
578.776.03428571428572.66571428571429
693.876.034285714285717.7657142857143
757.676.0342857142857-18.4342857142857
860.676.0342857142857-15.4342857142857
99176.034285714285714.9657142857143
1085.376.03428571428579.26571428571428
1177.476.03428571428571.36571428571429
1277.376.03428571428571.26571428571428
1368.376.0342857142857-7.73428571428572
1469.976.0342857142857-6.13428571428571
1581.776.03428571428575.66571428571429
1675.176.0342857142857-0.934285714285722
1769.976.0342857142857-6.13428571428571
188476.03428571428577.96571428571428
1954.376.0342857142857-21.7342857142857
206076.0342857142857-16.0342857142857
2189.976.034285714285713.8657142857143
227776.03428571428570.965714285714284
2385.376.03428571428579.26571428571428
2477.676.03428571428571.56571428571428
2569.276.0342857142857-6.83428571428571
2675.576.0342857142857-0.534285714285716
2785.776.03428571428579.66571428571429
2872.276.0342857142857-3.83428571428571
2979.976.03428571428573.86571428571429
3085.376.03428571428579.26571428571428
3152.276.0342857142857-23.8342857142857
3261.276.0342857142857-14.8342857142857
3382.476.03428571428576.36571428571429
3485.476.03428571428579.36571428571429
3578.276.03428571428572.16571428571429
3670.271.3904761904762-1.19047619047619
3770.271.3904761904762-1.19047619047619
3869.371.3904761904762-2.09047619047619
3977.571.39047619047626.10952380952381
4066.171.3904761904762-5.2904761904762
416971.3904761904762-2.39047619047619
4279.271.39047619047627.80952380952381
4356.271.3904761904762-15.1904761904762
4463.371.3904761904762-8.0904761904762
4577.871.39047619047626.40952380952381
469271.390476190476220.6095238095238
4778.171.39047619047626.7095238095238
4865.171.3904761904762-6.2904761904762
4971.171.3904761904762-0.290476190476196
5070.971.3904761904762-0.490476190476184
517271.39047619047620.60952380952381
5281.971.390476190476210.5095238095238
5370.671.3904761904762-0.790476190476196
5472.571.39047619047621.10952380952381
5565.171.3904761904762-6.2904761904762
5661.171.3904761904762-10.2904761904762


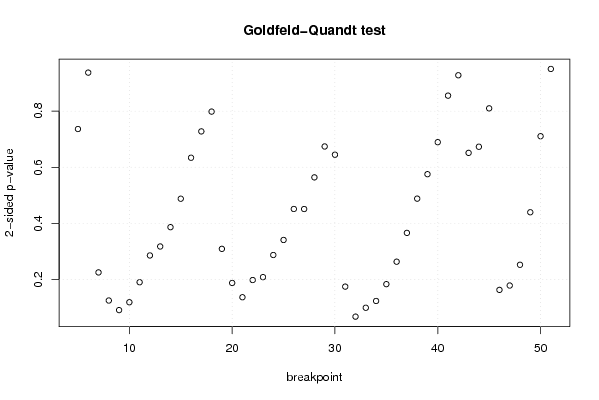
Goldfeld-Quandt test for Heteroskedasticity
p-valuesAlternative Hypothesis
breakpoint indexgreater2-sidedless
50.3681444828120010.7362889656240030.631855517187999
60.5313491872520160.9373016254959680.468650812747984
70.887430514308070.225138971383860.11256948569193
80.937530005397240.1249399892055180.0624699946027592
90.9545786877568830.0908426244862330.0454213122431165
100.9406196886936430.1187606226127140.0593803113063569
110.904928601401350.1901427971972980.0950713985986491
120.8572093114619950.285581377076010.142790688538005
130.8412445866388060.3175108267223880.158755413361194
140.8067770919357460.3864458161285090.193222908064254
150.7560755613168720.4878488773662550.243924438683127
160.6830542779231760.6338914441536480.316945722076824
170.6361150032214020.7277699935571960.363884996778598
180.6008151586967460.7983696826065080.399184841303254
190.8454201386309240.3091597227381520.154579861369076
200.9062349510484620.1875300979030750.0937650489515377
210.9316891165647720.1366217668704550.0683108834352275
220.901057715335610.1978845693287790.0989422846643894
230.8958275134340730.2083449731318540.104172486565927
240.8564132115309330.2871735769381330.143586788469067
250.8296023463079520.3407953073840960.170397653692048
260.774395785219190.4512084295616190.225604214780809
270.7744516170102510.4510967659794970.225548382989749
280.7180411000458710.5639177999082570.281958899954129
290.662963061041980.674073877916040.33703693895802
300.6776647566565040.6446704866869920.322335243343496
310.9127370235908020.1745259528183950.0872629764091977
320.9662863310036060.06742733799278840.0337136689963942
330.950448231709010.0991035365819790.0495517682909895
340.9383368898148950.1233262203702100.0616631101851051
350.908382259043480.1832354819130400.0916177409565199
360.8683191469844360.2633617060311290.131680853015564
370.8169940064701490.3660119870597020.183005993529851
380.7559716006314140.4880567987371710.244028399368586
390.7123724205018990.5752551589962020.287627579498101
400.6553183301223670.6893633397552660.344681669877633
410.5724016352638470.8551967294723070.427598364736153
420.5360592584812970.9278814830374060.463940741518703
430.6743824287314330.6512351425371340.325617571268567
440.6634649291719310.6730701416561380.336535070828069
450.5950101039948550.809979792010290.404989896005145
460.91857441107340.1628511778532020.0814255889266009
470.9108077337947150.178384532410570.089192266205285
480.8738645480255940.2522709039488110.126135451974406
490.78023674074720.4395265185056010.219763259252800
500.6446928594702930.7106142810594150.355307140529707
510.4751967631204570.9503935262409140.524803236879543

\begin{tabular}{lllllllll}
\hline
Goldfeld-Quandt test for Heteroskedasticity \tabularnewline
p-values & Alternative Hypothesis \tabularnewline
breakpoint index & greater & 2-sided & less \tabularnewline
5 & 0.368144482812001 & 0.736288965624003 & 0.631855517187999 \tabularnewline
6 & 0.531349187252016 & 0.937301625495968 & 0.468650812747984 \tabularnewline
7 & 0.88743051430807 & 0.22513897138386 & 0.11256948569193 \tabularnewline
8 & 0.93753000539724 & 0.124939989205518 & 0.0624699946027592 \tabularnewline
9 & 0.954578687756883 & 0.090842624486233 & 0.0454213122431165 \tabularnewline
10 & 0.940619688693643 & 0.118760622612714 & 0.0593803113063569 \tabularnewline
11 & 0.90492860140135 & 0.190142797197298 & 0.0950713985986491 \tabularnewline
12 & 0.857209311461995 & 0.28558137707601 & 0.142790688538005 \tabularnewline
13 & 0.841244586638806 & 0.317510826722388 & 0.158755413361194 \tabularnewline
14 & 0.806777091935746 & 0.386445816128509 & 0.193222908064254 \tabularnewline
15 & 0.756075561316872 & 0.487848877366255 & 0.243924438683127 \tabularnewline
16 & 0.683054277923176 & 0.633891444153648 & 0.316945722076824 \tabularnewline
17 & 0.636115003221402 & 0.727769993557196 & 0.363884996778598 \tabularnewline
18 & 0.600815158696746 & 0.798369682606508 & 0.399184841303254 \tabularnewline
19 & 0.845420138630924 & 0.309159722738152 & 0.154579861369076 \tabularnewline
20 & 0.906234951048462 & 0.187530097903075 & 0.0937650489515377 \tabularnewline
21 & 0.931689116564772 & 0.136621766870455 & 0.0683108834352275 \tabularnewline
22 & 0.90105771533561 & 0.197884569328779 & 0.0989422846643894 \tabularnewline
23 & 0.895827513434073 & 0.208344973131854 & 0.104172486565927 \tabularnewline
24 & 0.856413211530933 & 0.287173576938133 & 0.143586788469067 \tabularnewline
25 & 0.829602346307952 & 0.340795307384096 & 0.170397653692048 \tabularnewline
26 & 0.77439578521919 & 0.451208429561619 & 0.225604214780809 \tabularnewline
27 & 0.774451617010251 & 0.451096765979497 & 0.225548382989749 \tabularnewline
28 & 0.718041100045871 & 0.563917799908257 & 0.281958899954129 \tabularnewline
29 & 0.66296306104198 & 0.67407387791604 & 0.33703693895802 \tabularnewline
30 & 0.677664756656504 & 0.644670486686992 & 0.322335243343496 \tabularnewline
31 & 0.912737023590802 & 0.174525952818395 & 0.0872629764091977 \tabularnewline
32 & 0.966286331003606 & 0.0674273379927884 & 0.0337136689963942 \tabularnewline
33 & 0.95044823170901 & 0.099103536581979 & 0.0495517682909895 \tabularnewline
34 & 0.938336889814895 & 0.123326220370210 & 0.0616631101851051 \tabularnewline
35 & 0.90838225904348 & 0.183235481913040 & 0.0916177409565199 \tabularnewline
36 & 0.868319146984436 & 0.263361706031129 & 0.131680853015564 \tabularnewline
37 & 0.816994006470149 & 0.366011987059702 & 0.183005993529851 \tabularnewline
38 & 0.755971600631414 & 0.488056798737171 & 0.244028399368586 \tabularnewline
39 & 0.712372420501899 & 0.575255158996202 & 0.287627579498101 \tabularnewline
40 & 0.655318330122367 & 0.689363339755266 & 0.344681669877633 \tabularnewline
41 & 0.572401635263847 & 0.855196729472307 & 0.427598364736153 \tabularnewline
42 & 0.536059258481297 & 0.927881483037406 & 0.463940741518703 \tabularnewline
43 & 0.674382428731433 & 0.651235142537134 & 0.325617571268567 \tabularnewline
44 & 0.663464929171931 & 0.673070141656138 & 0.336535070828069 \tabularnewline
45 & 0.595010103994855 & 0.80997979201029 & 0.404989896005145 \tabularnewline
46 & 0.9185744110734 & 0.162851177853202 & 0.0814255889266009 \tabularnewline
47 & 0.910807733794715 & 0.17838453241057 & 0.089192266205285 \tabularnewline
48 & 0.873864548025594 & 0.252270903948811 & 0.126135451974406 \tabularnewline
49 & 0.7802367407472 & 0.439526518505601 & 0.219763259252800 \tabularnewline
50 & 0.644692859470293 & 0.710614281059415 & 0.355307140529707 \tabularnewline
51 & 0.475196763120457 & 0.950393526240914 & 0.524803236879543 \tabularnewline
\hline
\end{tabular}
%Source: https://freestatistics.org/blog/index.php?pk=25726&T=5

[TABLE]
[ROW][C]Goldfeld-Quandt test for Heteroskedasticity[/C][/ROW]
[ROW][C]p-values[/C][C]Alternative Hypothesis[/C][/ROW]
[ROW][C]breakpoint index[/C][C]greater[/C][C]2-sided[/C][C]less[/C][/ROW]
[ROW][C]5[/C][C]0.368144482812001[/C][C]0.736288965624003[/C][C]0.631855517187999[/C][/ROW]
[ROW][C]6[/C][C]0.531349187252016[/C][C]0.937301625495968[/C][C]0.468650812747984[/C][/ROW]
[ROW][C]7[/C][C]0.88743051430807[/C][C]0.22513897138386[/C][C]0.11256948569193[/C][/ROW]
[ROW][C]8[/C][C]0.93753000539724[/C][C]0.124939989205518[/C][C]0.0624699946027592[/C][/ROW]
[ROW][C]9[/C][C]0.954578687756883[/C][C]0.090842624486233[/C][C]0.0454213122431165[/C][/ROW]
[ROW][C]10[/C][C]0.940619688693643[/C][C]0.118760622612714[/C][C]0.0593803113063569[/C][/ROW]
[ROW][C]11[/C][C]0.90492860140135[/C][C]0.190142797197298[/C][C]0.0950713985986491[/C][/ROW]
[ROW][C]12[/C][C]0.857209311461995[/C][C]0.28558137707601[/C][C]0.142790688538005[/C][/ROW]
[ROW][C]13[/C][C]0.841244586638806[/C][C]0.317510826722388[/C][C]0.158755413361194[/C][/ROW]
[ROW][C]14[/C][C]0.806777091935746[/C][C]0.386445816128509[/C][C]0.193222908064254[/C][/ROW]
[ROW][C]15[/C][C]0.756075561316872[/C][C]0.487848877366255[/C][C]0.243924438683127[/C][/ROW]
[ROW][C]16[/C][C]0.683054277923176[/C][C]0.633891444153648[/C][C]0.316945722076824[/C][/ROW]
[ROW][C]17[/C][C]0.636115003221402[/C][C]0.727769993557196[/C][C]0.363884996778598[/C][/ROW]
[ROW][C]18[/C][C]0.600815158696746[/C][C]0.798369682606508[/C][C]0.399184841303254[/C][/ROW]
[ROW][C]19[/C][C]0.845420138630924[/C][C]0.309159722738152[/C][C]0.154579861369076[/C][/ROW]
[ROW][C]20[/C][C]0.906234951048462[/C][C]0.187530097903075[/C][C]0.0937650489515377[/C][/ROW]
[ROW][C]21[/C][C]0.931689116564772[/C][C]0.136621766870455[/C][C]0.0683108834352275[/C][/ROW]
[ROW][C]22[/C][C]0.90105771533561[/C][C]0.197884569328779[/C][C]0.0989422846643894[/C][/ROW]
[ROW][C]23[/C][C]0.895827513434073[/C][C]0.208344973131854[/C][C]0.104172486565927[/C][/ROW]
[ROW][C]24[/C][C]0.856413211530933[/C][C]0.287173576938133[/C][C]0.143586788469067[/C][/ROW]
[ROW][C]25[/C][C]0.829602346307952[/C][C]0.340795307384096[/C][C]0.170397653692048[/C][/ROW]
[ROW][C]26[/C][C]0.77439578521919[/C][C]0.451208429561619[/C][C]0.225604214780809[/C][/ROW]
[ROW][C]27[/C][C]0.774451617010251[/C][C]0.451096765979497[/C][C]0.225548382989749[/C][/ROW]
[ROW][C]28[/C][C]0.718041100045871[/C][C]0.563917799908257[/C][C]0.281958899954129[/C][/ROW]
[ROW][C]29[/C][C]0.66296306104198[/C][C]0.67407387791604[/C][C]0.33703693895802[/C][/ROW]
[ROW][C]30[/C][C]0.677664756656504[/C][C]0.644670486686992[/C][C]0.322335243343496[/C][/ROW]
[ROW][C]31[/C][C]0.912737023590802[/C][C]0.174525952818395[/C][C]0.0872629764091977[/C][/ROW]
[ROW][C]32[/C][C]0.966286331003606[/C][C]0.0674273379927884[/C][C]0.0337136689963942[/C][/ROW]
[ROW][C]33[/C][C]0.95044823170901[/C][C]0.099103536581979[/C][C]0.0495517682909895[/C][/ROW]
[ROW][C]34[/C][C]0.938336889814895[/C][C]0.123326220370210[/C][C]0.0616631101851051[/C][/ROW]
[ROW][C]35[/C][C]0.90838225904348[/C][C]0.183235481913040[/C][C]0.0916177409565199[/C][/ROW]
[ROW][C]36[/C][C]0.868319146984436[/C][C]0.263361706031129[/C][C]0.131680853015564[/C][/ROW]
[ROW][C]37[/C][C]0.816994006470149[/C][C]0.366011987059702[/C][C]0.183005993529851[/C][/ROW]
[ROW][C]38[/C][C]0.755971600631414[/C][C]0.488056798737171[/C][C]0.244028399368586[/C][/ROW]
[ROW][C]39[/C][C]0.712372420501899[/C][C]0.575255158996202[/C][C]0.287627579498101[/C][/ROW]
[ROW][C]40[/C][C]0.655318330122367[/C][C]0.689363339755266[/C][C]0.344681669877633[/C][/ROW]
[ROW][C]41[/C][C]0.572401635263847[/C][C]0.855196729472307[/C][C]0.427598364736153[/C][/ROW]
[ROW][C]42[/C][C]0.536059258481297[/C][C]0.927881483037406[/C][C]0.463940741518703[/C][/ROW]
[ROW][C]43[/C][C]0.674382428731433[/C][C]0.651235142537134[/C][C]0.325617571268567[/C][/ROW]
[ROW][C]44[/C][C]0.663464929171931[/C][C]0.673070141656138[/C][C]0.336535070828069[/C][/ROW]
[ROW][C]45[/C][C]0.595010103994855[/C][C]0.80997979201029[/C][C]0.404989896005145[/C][/ROW]
[ROW][C]46[/C][C]0.9185744110734[/C][C]0.162851177853202[/C][C]0.0814255889266009[/C][/ROW]
[ROW][C]47[/C][C]0.910807733794715[/C][C]0.17838453241057[/C][C]0.089192266205285[/C][/ROW]
[ROW][C]48[/C][C]0.873864548025594[/C][C]0.252270903948811[/C][C]0.126135451974406[/C][/ROW]
[ROW][C]49[/C][C]0.7802367407472[/C][C]0.439526518505601[/C][C]0.219763259252800[/C][/ROW]
[ROW][C]50[/C][C]0.644692859470293[/C][C]0.710614281059415[/C][C]0.355307140529707[/C][/ROW]
[ROW][C]51[/C][C]0.475196763120457[/C][C]0.950393526240914[/C][C]0.524803236879543[/C][/ROW]
[/TABLE]
Source: https://freestatistics.org/blog/index.php?pk=25726&T=5

Globally Unique Identifier (entire table): ba.freestatistics.org/blog/index.php?pk=25726&T=5

As an alternative you can also use a QR Code:  

The GUIDs for individual cells are displayed in the table below:

Goldfeld-Quandt test for Heteroskedasticity
p-valuesAlternative Hypothesis
breakpoint indexgreater2-sidedless
50.3681444828120010.7362889656240030.631855517187999
60.5313491872520160.9373016254959680.468650812747984
70.887430514308070.225138971383860.11256948569193
80.937530005397240.1249399892055180.0624699946027592
90.9545786877568830.0908426244862330.0454213122431165
100.9406196886936430.1187606226127140.0593803113063569
110.904928601401350.1901427971972980.0950713985986491
120.8572093114619950.285581377076010.142790688538005
130.8412445866388060.3175108267223880.158755413361194
140.8067770919357460.3864458161285090.193222908064254
150.7560755613168720.4878488773662550.243924438683127
160.6830542779231760.6338914441536480.316945722076824
170.6361150032214020.7277699935571960.363884996778598
180.6008151586967460.7983696826065080.399184841303254
190.8454201386309240.3091597227381520.154579861369076
200.9062349510484620.1875300979030750.0937650489515377
210.9316891165647720.1366217668704550.0683108834352275
220.901057715335610.1978845693287790.0989422846643894
230.8958275134340730.2083449731318540.104172486565927
240.8564132115309330.2871735769381330.143586788469067
250.8296023463079520.3407953073840960.170397653692048
260.774395785219190.4512084295616190.225604214780809
270.7744516170102510.4510967659794970.225548382989749
280.7180411000458710.5639177999082570.281958899954129
290.662963061041980.674073877916040.33703693895802
300.6776647566565040.6446704866869920.322335243343496
310.9127370235908020.1745259528183950.0872629764091977
320.9662863310036060.06742733799278840.0337136689963942
330.950448231709010.0991035365819790.0495517682909895
340.9383368898148950.1233262203702100.0616631101851051
350.908382259043480.1832354819130400.0916177409565199
360.8683191469844360.2633617060311290.131680853015564
370.8169940064701490.3660119870597020.183005993529851
380.7559716006314140.4880567987371710.244028399368586
390.7123724205018990.5752551589962020.287627579498101
400.6553183301223670.6893633397552660.344681669877633
410.5724016352638470.8551967294723070.427598364736153
420.5360592584812970.9278814830374060.463940741518703
430.6743824287314330.6512351425371340.325617571268567
440.6634649291719310.6730701416561380.336535070828069
450.5950101039948550.809979792010290.404989896005145
460.91857441107340.1628511778532020.0814255889266009
470.9108077337947150.178384532410570.089192266205285
480.8738645480255940.2522709039488110.126135451974406
490.78023674074720.4395265185056010.219763259252800
500.6446928594702930.7106142810594150.355307140529707
510.4751967631204570.9503935262409140.524803236879543


Meta Analysis of Goldfeld-Quandt test for Heteroskedasticity
Description# significant tests% significant testsOK/NOK
1% type I error level00OK
5% type I error level00OK
10% type I error level30.0638297872340425OK

\begin{tabular}{lllllllll}
\hline
Meta Analysis of Goldfeld-Quandt test for Heteroskedasticity \tabularnewline
Description & # significant tests & % significant tests & OK/NOK \tabularnewline
1% type I error level & 0 & 0 & OK \tabularnewline
5% type I error level & 0 & 0 & OK \tabularnewline
10% type I error level & 3 & 0.0638297872340425 & OK \tabularnewline
\hline
\end{tabular}
%Source: https://freestatistics.org/blog/index.php?pk=25726&T=6

[TABLE]
[ROW][C]Meta Analysis of Goldfeld-Quandt test for Heteroskedasticity[/C][/ROW]
[ROW][C]Description[/C][C]# significant tests[/C][C]% significant tests[/C][C]OK/NOK[/C][/ROW]
[ROW][C]1% type I error level[/C][C]0[/C][C]0[/C][C]OK[/C][/ROW]
[ROW][C]5% type I error level[/C][C]0[/C][C]0[/C][C]OK[/C][/ROW]
[ROW][C]10% type I error level[/C][C]3[/C][C]0.0638297872340425[/C][C]OK[/C][/ROW]
[/TABLE]
Source: https://freestatistics.org/blog/index.php?pk=25726&T=6

Globally Unique Identifier (entire table): ba.freestatistics.org/blog/index.php?pk=25726&T=6

As an alternative you can also use a QR Code:  

The GUIDs for individual cells are displayed in the table below:

Meta Analysis of Goldfeld-Quandt test for Heteroskedasticity
Description# significant tests% significant testsOK/NOK
1% type I error level00OK
5% type I error level00OK
10% type I error level30.0638297872340425OK


Parameters (Session):
par1 = 1 ; par2 = Do not include Seasonal Dummies ; par3 = No Linear Trend ;
Parameters (R input):
par1 = 1 ; par2 = Do not include Seasonal Dummies ; par3 = No Linear Trend ;
R code (references can be found in the software module):
library(lattice)
library(lmtest)
n25 <- 25 #minimum number of obs. for Goldfeld-Quandt test
par1 <- as.numeric(par1)
x <- t(y)
k <- length(x[1,])
n <- length(x[,1])
x1 <- cbind(x[,par1], x[,1:k!=par1])
mycolnames <- c(colnames(x)[par1], colnames(x)[1:k!=par1])
colnames(x1) <- mycolnames #colnames(x)[par1]
x <- x1
if (par3 == 'First Differences'){
x2 <- array(0, dim=c(n-1,k), dimnames=list(1:(n-1), paste('(1-B)',colnames(x),sep='')))
for (i in 1:n-1) {
for (j in 1:k) {
x2[i,j] <- x[i+1,j] - x[i,j]
}
}
x <- x2
}
if (par2 == 'Include Monthly Dummies'){
x2 <- array(0, dim=c(n,11), dimnames=list(1:n, paste('M', seq(1:11), sep ='')))
for (i in 1:11){
x2[seq(i,n,12),i] <- 1
}
x <- cbind(x, x2)
}
if (par2 == 'Include Quarterly Dummies'){
x2 <- array(0, dim=c(n,3), dimnames=list(1:n, paste('Q', seq(1:3), sep ='')))
for (i in 1:3){
x2[seq(i,n,4),i] <- 1
}
x <- cbind(x, x2)
}
k <- length(x[1,])
if (par3 == 'Linear Trend'){
x <- cbind(x, c(1:n))
colnames(x)[k+1] <- 't'
}
x
k <- length(x[1,])
df <- as.data.frame(x)
(mylm <- lm(df))
(mysum <- summary(mylm))
if (n > n25) {
kp3 <- k + 3
nmkm3 <- n - k - 3
gqarr <- array(NA, dim=c(nmkm3-kp3+1,3))
numgqtests <- 0
numsignificant1 <- 0
numsignificant5 <- 0
numsignificant10 <- 0
for (mypoint in kp3:nmkm3) {
j <- 0
numgqtests <- numgqtests + 1
for (myalt in c('greater', 'two.sided', 'less')) {
j <- j + 1
gqarr[mypoint-kp3+1,j] <- gqtest(mylm, point=mypoint, alternative=myalt)$p.value
}
if (gqarr[mypoint-kp3+1,2] < 0.01) numsignificant1 <- numsignificant1 + 1
if (gqarr[mypoint-kp3+1,2] < 0.05) numsignificant5 <- numsignificant5 + 1
if (gqarr[mypoint-kp3+1,2] < 0.10) numsignificant10 <- numsignificant10 + 1
}
gqarr
}
bitmap(file='test0.png')
plot(x[,1], type='l', main='Actuals and Interpolation', ylab='value of Actuals and Interpolation (dots)', xlab='time or index')
points(x[,1]-mysum$resid)
grid()
dev.off()
bitmap(file='test1.png')
plot(mysum$resid, type='b', pch=19, main='Residuals', ylab='value of Residuals', xlab='time or index')
grid()
dev.off()
bitmap(file='test2.png')
hist(mysum$resid, main='Residual Histogram', xlab='values of Residuals')
grid()
dev.off()
bitmap(file='test3.png')
densityplot(~mysum$resid,col='black',main='Residual Density Plot', xlab='values of Residuals')
dev.off()
bitmap(file='test4.png')
qqnorm(mysum$resid, main='Residual Normal Q-Q Plot')
qqline(mysum$resid)
grid()
dev.off()
(myerror <- as.ts(mysum$resid))
bitmap(file='test5.png')
dum <- cbind(lag(myerror,k=1),myerror)
dum
dum1 <- dum[2:length(myerror),]
dum1
z <- as.data.frame(dum1)
z
plot(z,main=paste('Residual Lag plot, lowess, and regression line'), ylab='values of Residuals', xlab='lagged values of Residuals')
lines(lowess(z))
abline(lm(z))
grid()
dev.off()
bitmap(file='test6.png')
acf(mysum$resid, lag.max=length(mysum$resid)/2, main='Residual Autocorrelation Function')
grid()
dev.off()
bitmap(file='test7.png')
pacf(mysum$resid, lag.max=length(mysum$resid)/2, main='Residual Partial Autocorrelation Function')
grid()
dev.off()
bitmap(file='test8.png')
opar <- par(mfrow = c(2,2), oma = c(0, 0, 1.1, 0))
plot(mylm, las = 1, sub='Residual Diagnostics')
par(opar)
dev.off()
if (n > n25) {
bitmap(file='test9.png')
plot(kp3:nmkm3,gqarr[,2], main='Goldfeld-Quandt test',ylab='2-sided p-value',xlab='breakpoint')
grid()
dev.off()
}
load(file='createtable')
a<-table.start()
a<-table.row.start(a)
a<-table.element(a, 'Multiple Linear Regression - Estimated Regression Equation', 1, TRUE)
a<-table.row.end(a)
myeq <- colnames(x)[1]
myeq <- paste(myeq, '[t] = ', sep='')
for (i in 1:k){
if (mysum$coefficients[i,1] > 0) myeq <- paste(myeq, '+', '')
myeq <- paste(myeq, mysum$coefficients[i,1], sep=' ')
if (rownames(mysum$coefficients)[i] != '(Intercept)') {
myeq <- paste(myeq, rownames(mysum$coefficients)[i], sep='')
if (rownames(mysum$coefficients)[i] != 't') myeq <- paste(myeq, '[t]', sep='')
}
}
myeq <- paste(myeq, ' + e[t]')
a<-table.row.start(a)
a<-table.element(a, myeq)
a<-table.row.end(a)
a<-table.end(a)
table.save(a,file='mytable1.tab')
a<-table.start()
a<-table.row.start(a)
a<-table.element(a,hyperlink('ols1.htm','Multiple Linear Regression - Ordinary Least Squares',''), 6, TRUE)
a<-table.row.end(a)
a<-table.row.start(a)
a<-table.element(a,'Variable',header=TRUE)
a<-table.element(a,'Parameter',header=TRUE)
a<-table.element(a,'S.D.',header=TRUE)
a<-table.element(a,'T-STAT
H0: parameter = 0',header=TRUE)
a<-table.element(a,'2-tail p-value',header=TRUE)
a<-table.element(a,'1-tail p-value',header=TRUE)
a<-table.row.end(a)
for (i in 1:k){
a<-table.row.start(a)
a<-table.element(a,rownames(mysum$coefficients)[i],header=TRUE)
a<-table.element(a,mysum$coefficients[i,1])
a<-table.element(a, round(mysum$coefficients[i,2],6))
a<-table.element(a, round(mysum$coefficients[i,3],4))
a<-table.element(a, round(mysum$coefficients[i,4],6))
a<-table.element(a, round(mysum$coefficients[i,4]/2,6))
a<-table.row.end(a)
}
a<-table.end(a)
table.save(a,file='mytable2.tab')
a<-table.start()
a<-table.row.start(a)
a<-table.element(a, 'Multiple Linear Regression - Regression Statistics', 2, TRUE)
a<-table.row.end(a)
a<-table.row.start(a)
a<-table.element(a, 'Multiple R',1,TRUE)
a<-table.element(a, sqrt(mysum$r.squared))
a<-table.row.end(a)
a<-table.row.start(a)
a<-table.element(a, 'R-squared',1,TRUE)
a<-table.element(a, mysum$r.squared)
a<-table.row.end(a)
a<-table.row.start(a)
a<-table.element(a, 'Adjusted R-squared',1,TRUE)
a<-table.element(a, mysum$adj.r.squared)
a<-table.row.end(a)
a<-table.row.start(a)
a<-table.element(a, 'F-TEST (value)',1,TRUE)
a<-table.element(a, mysum$fstatistic[1])
a<-table.row.end(a)
a<-table.row.start(a)
a<-table.element(a, 'F-TEST (DF numerator)',1,TRUE)
a<-table.element(a, mysum$fstatistic[2])
a<-table.row.end(a)
a<-table.row.start(a)
a<-table.element(a, 'F-TEST (DF denominator)',1,TRUE)
a<-table.element(a, mysum$fstatistic[3])
a<-table.row.end(a)
a<-table.row.start(a)
a<-table.element(a, 'p-value',1,TRUE)
a<-table.element(a, 1-pf(mysum$fstatistic[1],mysum$fstatistic[2],mysum$fstatistic[3]))
a<-table.row.end(a)
a<-table.row.start(a)
a<-table.element(a, 'Multiple Linear Regression - Residual Statistics', 2, TRUE)
a<-table.row.end(a)
a<-table.row.start(a)
a<-table.element(a, 'Residual Standard Deviation',1,TRUE)
a<-table.element(a, mysum$sigma)
a<-table.row.end(a)
a<-table.row.start(a)
a<-table.element(a, 'Sum Squared Residuals',1,TRUE)
a<-table.element(a, sum(myerror*myerror))
a<-table.row.end(a)
a<-table.end(a)
table.save(a,file='mytable3.tab')
a<-table.start()
a<-table.row.start(a)
a<-table.element(a, 'Multiple Linear Regression - Actuals, Interpolation, and Residuals', 4, TRUE)
a<-table.row.end(a)
a<-table.row.start(a)
a<-table.element(a, 'Time or Index', 1, TRUE)
a<-table.element(a, 'Actuals', 1, TRUE)
a<-table.element(a, 'Interpolation
Forecast', 1, TRUE)
a<-table.element(a, 'Residuals
Prediction Error', 1, TRUE)
a<-table.row.end(a)
for (i in 1:n) {
a<-table.row.start(a)
a<-table.element(a,i, 1, TRUE)
a<-table.element(a,x[i])
a<-table.element(a,x[i]-mysum$resid[i])
a<-table.element(a,mysum$resid[i])
a<-table.row.end(a)
}
a<-table.end(a)
table.save(a,file='mytable4.tab')
if (n > n25) {
a<-table.start()
a<-table.row.start(a)
a<-table.element(a,'Goldfeld-Quandt test for Heteroskedasticity',4,TRUE)
a<-table.row.end(a)
a<-table.row.start(a)
a<-table.element(a,'p-values',header=TRUE)
a<-table.element(a,'Alternative Hypothesis',3,header=TRUE)
a<-table.row.end(a)
a<-table.row.start(a)
a<-table.element(a,'breakpoint index',header=TRUE)
a<-table.element(a,'greater',header=TRUE)
a<-table.element(a,'2-sided',header=TRUE)
a<-table.element(a,'less',header=TRUE)
a<-table.row.end(a)
for (mypoint in kp3:nmkm3) {
a<-table.row.start(a)
a<-table.element(a,mypoint,header=TRUE)
a<-table.element(a,gqarr[mypoint-kp3+1,1])
a<-table.element(a,gqarr[mypoint-kp3+1,2])
a<-table.element(a,gqarr[mypoint-kp3+1,3])
a<-table.row.end(a)
}
a<-table.end(a)
table.save(a,file='mytable5.tab')
a<-table.start()
a<-table.row.start(a)
a<-table.element(a,'Meta Analysis of Goldfeld-Quandt test for Heteroskedasticity',4,TRUE)
a<-table.row.end(a)
a<-table.row.start(a)
a<-table.element(a,'Description',header=TRUE)
a<-table.element(a,'# significant tests',header=TRUE)
a<-table.element(a,'% significant tests',header=TRUE)
a<-table.element(a,'OK/NOK',header=TRUE)
a<-table.row.end(a)
a<-table.row.start(a)
a<-table.element(a,'1% type I error level',header=TRUE)
a<-table.element(a,numsignificant1)
a<-table.element(a,numsignificant1/numgqtests)
if (numsignificant1/numgqtests < 0.01) dum <- 'OK' else dum <- 'NOK'
a<-table.element(a,dum)
a<-table.row.end(a)
a<-table.row.start(a)
a<-table.element(a,'5% type I error level',header=TRUE)
a<-table.element(a,numsignificant5)
a<-table.element(a,numsignificant5/numgqtests)
if (numsignificant5/numgqtests < 0.05) dum <- 'OK' else dum <- 'NOK'
a<-table.element(a,dum)
a<-table.row.end(a)
a<-table.row.start(a)
a<-table.element(a,'10% type I error level',header=TRUE)
a<-table.element(a,numsignificant10)
a<-table.element(a,numsignificant10/numgqtests)
if (numsignificant10/numgqtests < 0.1) dum <- 'OK' else dum <- 'NOK'
a<-table.element(a,dum)
a<-table.row.end(a)
a<-table.end(a)
table.save(a,file='mytable6.tab')
}