Free Statistics

of Irreproducible Research!

Author's title

Author*Unverified author*
R Software Modulerwasp_multipleregression.wasp
Title produced by softwareMultiple Regression
Date of computationWed, 26 Nov 2008 11:40:54 -0700
Cite this page as followsStatistical Computations at FreeStatistics.org, Office for Research Development and Education, URL https://freestatistics.org/blog/index.php?v=date/2008/Nov/26/t1227725521kqouhmmd7cn1qdo.htm/, Retrieved Sun, 19 May 2024 07:13:58 +0000
Statistical Computations at FreeStatistics.org, Office for Research Development and Education, URL https://freestatistics.org/blog/index.php?pk=25697, Retrieved Sun, 19 May 2024 07:13:58 +0000
QR Codes:

Original text written by user:
IsPrivate?No (this computation is public)
User-defined keywords
Estimated Impact173
Family? (F = Feedback message, R = changed R code, M = changed R Module, P = changed Parameters, D = changed Data)
F       [Multiple Regression] [Stefan Temmerman] [2008-11-26 18:40:54] [7866e091edc3e3e9f6a037e9d19fcaa2] [Current]
Feedback Forum
2008-12-01 13:42:35 [Alexander Hendrickx] [reply
Goede verwerking !
2008-12-01 14:14:40 [Marlies Polfliet] [reply
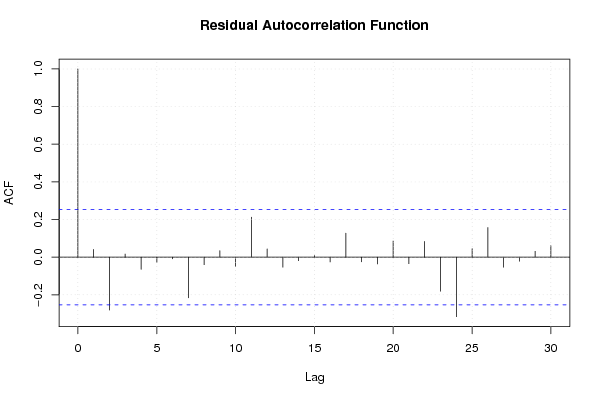
De student heeft deze vraag zeer goed beantwoord. Eerst legt hij/zij duidelijk uit waarover zijn datareeks gaat, vervolgens legt hij/zij zijn/haar gekozen dummy’s uit. Ook de berekeningen en de daaruit getrokken conclusies zijn correct.
2008-12-01 18:07:46 [Stefan Temmerman] [reply
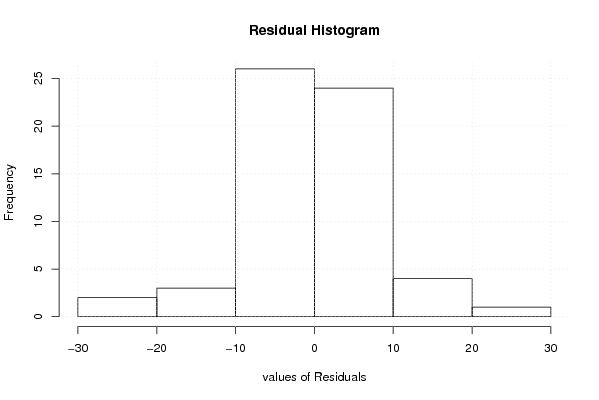
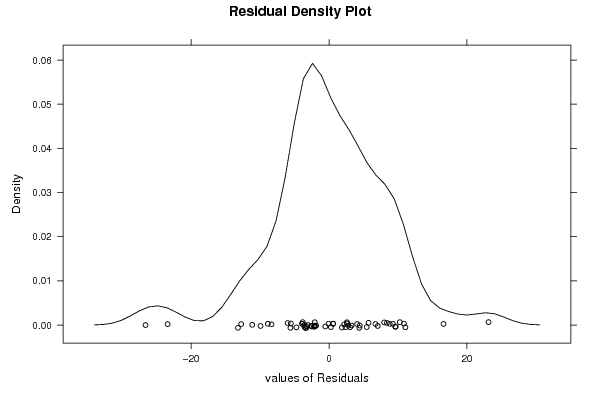
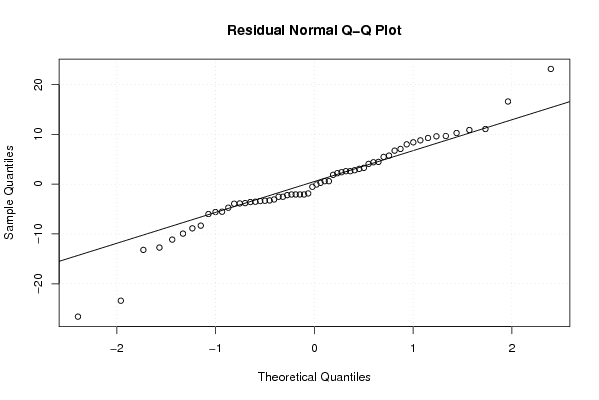
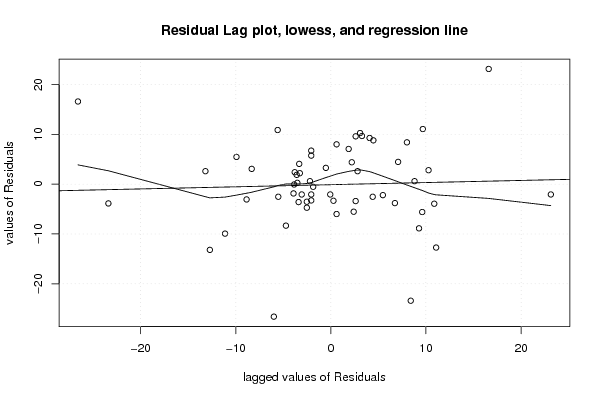
Ik heb hier de juiste methode toegepast en juist geïnterpreteerd. Wel vergeet ik te zeggen dat de residu’s normaal verdeeld zouden moeten zijn voor een goed model. Ook dat de lag plot weinig correleert, wat duidt op weinig voorspelling op basis van het verleden. Mijn besluit is correct: Het model is nog aan verbetering toe.

Post a new message
Dataseries X:
8	0
-10	0
-24	0
-19	0
8	1
24	1
14	1
7	1
9	1
-26	0
19	0
15	0
-1	0
-10	0
-21	0
-14	0
-27	0
26	0
23	0
5	0
19	0
-19	0
24	1
17	1
1	1
-9	1
-16	1
-21	1
-14	1
31	1
27	1
10	1
12	1
-23	1
13	1
26	1
-1	1
4	1
-16	1
-5	1
9	1
23	1
9	1
2	1
10	1
-29	0
17	0
9	0
9	0
-10	0
-23	0
13	0
13	0
-9	0
9	0
5	0
8	0
-18	0
7	1
4	1


Summary of computational transaction
Raw Inputview raw input (R code)
Raw Outputview raw output of R engine
Computing time3 seconds
R Server'Gwilym Jenkins' @ 72.249.127.135

\begin{tabular}{lllllllll}
\hline
Summary of computational transaction \tabularnewline
Raw Input & view raw input (R code)  \tabularnewline
Raw Output & view raw output of R engine  \tabularnewline
Computing time & 3 seconds \tabularnewline
R Server & 'Gwilym Jenkins' @ 72.249.127.135 \tabularnewline
\hline
\end{tabular}
%Source: https://freestatistics.org/blog/index.php?pk=25697&T=0

[TABLE]
[ROW][C]Summary of computational transaction[/C][/ROW]
[ROW][C]Raw Input[/C][C]view raw input (R code) [/C][/ROW]
[ROW][C]Raw Output[/C][C]view raw output of R engine [/C][/ROW]
[ROW][C]Computing time[/C][C]3 seconds[/C][/ROW]
[ROW][C]R Server[/C][C]'Gwilym Jenkins' @ 72.249.127.135[/C][/ROW]
[/TABLE]
Source: https://freestatistics.org/blog/index.php?pk=25697&T=0

Globally Unique Identifier (entire table): ba.freestatistics.org/blog/index.php?pk=25697&T=0

As an alternative you can also use a QR Code:  

The GUIDs for individual cells are displayed in the table below:

Summary of computational transaction
Raw Inputview raw input (R code)
Raw Outputview raw output of R engine
Computing time3 seconds
R Server'Gwilym Jenkins' @ 72.249.127.135


Multiple Linear Regression - Estimated Regression Equation
Woongebouwen[t] = + 12.8028571428571 + 2.32857142857144Conjunctuur[t] -10.5342857142857M1[t] -20.7342857142858M2[t] -33.7342857142857M3[t] -22.9342857142857M4[t] -16.4M5[t] + 4.79999999999998M6[t] + 2.19999999999999M7[t] -8.4M8[t] -2.60000000000001M9[t] -36.2685714285714M10[t] + 1.79999999999999M11[t] + e[t]

\begin{tabular}{lllllllll}
\hline
Multiple Linear Regression - Estimated Regression Equation \tabularnewline
Woongebouwen[t] =  +  12.8028571428571 +  2.32857142857144Conjunctuur[t] -10.5342857142857M1[t] -20.7342857142858M2[t] -33.7342857142857M3[t] -22.9342857142857M4[t] -16.4M5[t] +  4.79999999999998M6[t] +  2.19999999999999M7[t] -8.4M8[t] -2.60000000000001M9[t] -36.2685714285714M10[t] +  1.79999999999999M11[t]  + e[t] \tabularnewline
\hline
\end{tabular}
%Source: https://freestatistics.org/blog/index.php?pk=25697&T=1

[TABLE]
[ROW][C]Multiple Linear Regression - Estimated Regression Equation[/C][/ROW]
[ROW][C]Woongebouwen[t] =  +  12.8028571428571 +  2.32857142857144Conjunctuur[t] -10.5342857142857M1[t] -20.7342857142858M2[t] -33.7342857142857M3[t] -22.9342857142857M4[t] -16.4M5[t] +  4.79999999999998M6[t] +  2.19999999999999M7[t] -8.4M8[t] -2.60000000000001M9[t] -36.2685714285714M10[t] +  1.79999999999999M11[t]  + e[t][/C][/ROW]
[/TABLE]
Source: https://freestatistics.org/blog/index.php?pk=25697&T=1

Globally Unique Identifier (entire table): ba.freestatistics.org/blog/index.php?pk=25697&T=1

As an alternative you can also use a QR Code:  

The GUIDs for individual cells are displayed in the table below:

Multiple Linear Regression - Estimated Regression Equation
Woongebouwen[t] = + 12.8028571428571 + 2.32857142857144Conjunctuur[t] -10.5342857142857M1[t] -20.7342857142858M2[t] -33.7342857142857M3[t] -22.9342857142857M4[t] -16.4M5[t] + 4.79999999999998M6[t] + 2.19999999999999M7[t] -8.4M8[t] -2.60000000000001M9[t] -36.2685714285714M10[t] + 1.79999999999999M11[t] + e[t]


Multiple Linear Regression - Ordinary Least Squares
VariableParameterS.D.T-STATH0: parameter = 02-tail p-value1-tail p-value
(Intercept)12.80285714285714.4613482.86970.0061380.003069
Conjunctuur2.328571428571442.5097040.92780.3582380.179119
M1-10.53428571428575.960217-1.76740.0836480.041824
M2-20.73428571428585.960217-3.47880.0010970.000548
M3-33.73428571428575.960217-5.65991e-060
M4-22.93428571428575.960217-3.84790.0003580.000179
M5-16.45.939044-2.76140.0081850.004092
M64.799999999999985.9390440.80820.4230410.211521
M72.199999999999995.9390440.37040.7127260.356363
M8-8.45.939044-1.41440.1638440.081922
M9-2.600000000000015.939044-0.43780.663550.331775
M10-36.26857142857146.02329-6.021400
M111.799999999999995.9390440.30310.7631670.381584

\begin{tabular}{lllllllll}
\hline
Multiple Linear Regression - Ordinary Least Squares \tabularnewline
Variable & Parameter & S.D. & T-STATH0: parameter = 0 & 2-tail p-value & 1-tail p-value \tabularnewline
(Intercept) & 12.8028571428571 & 4.461348 & 2.8697 & 0.006138 & 0.003069 \tabularnewline
Conjunctuur & 2.32857142857144 & 2.509704 & 0.9278 & 0.358238 & 0.179119 \tabularnewline
M1 & -10.5342857142857 & 5.960217 & -1.7674 & 0.083648 & 0.041824 \tabularnewline
M2 & -20.7342857142858 & 5.960217 & -3.4788 & 0.001097 & 0.000548 \tabularnewline
M3 & -33.7342857142857 & 5.960217 & -5.6599 & 1e-06 & 0 \tabularnewline
M4 & -22.9342857142857 & 5.960217 & -3.8479 & 0.000358 & 0.000179 \tabularnewline
M5 & -16.4 & 5.939044 & -2.7614 & 0.008185 & 0.004092 \tabularnewline
M6 & 4.79999999999998 & 5.939044 & 0.8082 & 0.423041 & 0.211521 \tabularnewline
M7 & 2.19999999999999 & 5.939044 & 0.3704 & 0.712726 & 0.356363 \tabularnewline
M8 & -8.4 & 5.939044 & -1.4144 & 0.163844 & 0.081922 \tabularnewline
M9 & -2.60000000000001 & 5.939044 & -0.4378 & 0.66355 & 0.331775 \tabularnewline
M10 & -36.2685714285714 & 6.02329 & -6.0214 & 0 & 0 \tabularnewline
M11 & 1.79999999999999 & 5.939044 & 0.3031 & 0.763167 & 0.381584 \tabularnewline
\hline
\end{tabular}
%Source: https://freestatistics.org/blog/index.php?pk=25697&T=2

[TABLE]
[ROW][C]Multiple Linear Regression - Ordinary Least Squares[/C][/ROW]
[ROW][C]Variable[/C][C]Parameter[/C][C]S.D.[/C][C]T-STATH0: parameter = 0[/C][C]2-tail p-value[/C][C]1-tail p-value[/C][/ROW]
[ROW][C](Intercept)[/C][C]12.8028571428571[/C][C]4.461348[/C][C]2.8697[/C][C]0.006138[/C][C]0.003069[/C][/ROW]
[ROW][C]Conjunctuur[/C][C]2.32857142857144[/C][C]2.509704[/C][C]0.9278[/C][C]0.358238[/C][C]0.179119[/C][/ROW]
[ROW][C]M1[/C][C]-10.5342857142857[/C][C]5.960217[/C][C]-1.7674[/C][C]0.083648[/C][C]0.041824[/C][/ROW]
[ROW][C]M2[/C][C]-20.7342857142858[/C][C]5.960217[/C][C]-3.4788[/C][C]0.001097[/C][C]0.000548[/C][/ROW]
[ROW][C]M3[/C][C]-33.7342857142857[/C][C]5.960217[/C][C]-5.6599[/C][C]1e-06[/C][C]0[/C][/ROW]
[ROW][C]M4[/C][C]-22.9342857142857[/C][C]5.960217[/C][C]-3.8479[/C][C]0.000358[/C][C]0.000179[/C][/ROW]
[ROW][C]M5[/C][C]-16.4[/C][C]5.939044[/C][C]-2.7614[/C][C]0.008185[/C][C]0.004092[/C][/ROW]
[ROW][C]M6[/C][C]4.79999999999998[/C][C]5.939044[/C][C]0.8082[/C][C]0.423041[/C][C]0.211521[/C][/ROW]
[ROW][C]M7[/C][C]2.19999999999999[/C][C]5.939044[/C][C]0.3704[/C][C]0.712726[/C][C]0.356363[/C][/ROW]
[ROW][C]M8[/C][C]-8.4[/C][C]5.939044[/C][C]-1.4144[/C][C]0.163844[/C][C]0.081922[/C][/ROW]
[ROW][C]M9[/C][C]-2.60000000000001[/C][C]5.939044[/C][C]-0.4378[/C][C]0.66355[/C][C]0.331775[/C][/ROW]
[ROW][C]M10[/C][C]-36.2685714285714[/C][C]6.02329[/C][C]-6.0214[/C][C]0[/C][C]0[/C][/ROW]
[ROW][C]M11[/C][C]1.79999999999999[/C][C]5.939044[/C][C]0.3031[/C][C]0.763167[/C][C]0.381584[/C][/ROW]
[/TABLE]
Source: https://freestatistics.org/blog/index.php?pk=25697&T=2

Globally Unique Identifier (entire table): ba.freestatistics.org/blog/index.php?pk=25697&T=2

As an alternative you can also use a QR Code:  

The GUIDs for individual cells are displayed in the table below:

Multiple Linear Regression - Ordinary Least Squares
VariableParameterS.D.T-STATH0: parameter = 02-tail p-value1-tail p-value
(Intercept)12.80285714285714.4613482.86970.0061380.003069
Conjunctuur2.328571428571442.5097040.92780.3582380.179119
M1-10.53428571428575.960217-1.76740.0836480.041824
M2-20.73428571428585.960217-3.47880.0010970.000548
M3-33.73428571428575.960217-5.65991e-060
M4-22.93428571428575.960217-3.84790.0003580.000179
M5-16.45.939044-2.76140.0081850.004092
M64.799999999999985.9390440.80820.4230410.211521
M72.199999999999995.9390440.37040.7127260.356363
M8-8.45.939044-1.41440.1638440.081922
M9-2.600000000000015.939044-0.43780.663550.331775
M10-36.26857142857146.02329-6.021400
M111.799999999999995.9390440.30310.7631670.381584


Multiple Linear Regression - Regression Statistics
Multiple R0.85724383117176
R-squared0.734866986082036
Adjusted R-squared0.66717345061362
F-TEST (value)10.8557926690784
F-TEST (DF numerator)12
F-TEST (DF denominator)47
p-value7.0631644977226e-10
Multiple Linear Regression - Residual Statistics
Residual Standard Deviation9.3904530190367
Sum Squared Residuals4144.48857142857

\begin{tabular}{lllllllll}
\hline
Multiple Linear Regression - Regression Statistics \tabularnewline
Multiple R & 0.85724383117176 \tabularnewline
R-squared & 0.734866986082036 \tabularnewline
Adjusted R-squared & 0.66717345061362 \tabularnewline
F-TEST (value) & 10.8557926690784 \tabularnewline
F-TEST (DF numerator) & 12 \tabularnewline
F-TEST (DF denominator) & 47 \tabularnewline
p-value & 7.0631644977226e-10 \tabularnewline
Multiple Linear Regression - Residual Statistics \tabularnewline
Residual Standard Deviation & 9.3904530190367 \tabularnewline
Sum Squared Residuals & 4144.48857142857 \tabularnewline
\hline
\end{tabular}
%Source: https://freestatistics.org/blog/index.php?pk=25697&T=3

[TABLE]
[ROW][C]Multiple Linear Regression - Regression Statistics[/C][/ROW]
[ROW][C]Multiple R[/C][C]0.85724383117176[/C][/ROW]
[ROW][C]R-squared[/C][C]0.734866986082036[/C][/ROW]
[ROW][C]Adjusted R-squared[/C][C]0.66717345061362[/C][/ROW]
[ROW][C]F-TEST (value)[/C][C]10.8557926690784[/C][/ROW]
[ROW][C]F-TEST (DF numerator)[/C][C]12[/C][/ROW]
[ROW][C]F-TEST (DF denominator)[/C][C]47[/C][/ROW]
[ROW][C]p-value[/C][C]7.0631644977226e-10[/C][/ROW]
[ROW][C]Multiple Linear Regression - Residual Statistics[/C][/ROW]
[ROW][C]Residual Standard Deviation[/C][C]9.3904530190367[/C][/ROW]
[ROW][C]Sum Squared Residuals[/C][C]4144.48857142857[/C][/ROW]
[/TABLE]
Source: https://freestatistics.org/blog/index.php?pk=25697&T=3

Globally Unique Identifier (entire table): ba.freestatistics.org/blog/index.php?pk=25697&T=3

As an alternative you can also use a QR Code:  

The GUIDs for individual cells are displayed in the table below:

Multiple Linear Regression - Regression Statistics
Multiple R0.85724383117176
R-squared0.734866986082036
Adjusted R-squared0.66717345061362
F-TEST (value)10.8557926690784
F-TEST (DF numerator)12
F-TEST (DF denominator)47
p-value7.0631644977226e-10
Multiple Linear Regression - Residual Statistics
Residual Standard Deviation9.3904530190367
Sum Squared Residuals4144.48857142857


Multiple Linear Regression - Actuals, Interpolation, and Residuals
Time or IndexActualsInterpolationForecastResidualsPrediction Error
182.268571428571445.73142857142856
2-10-7.93142857142855-2.06857142857145
3-24-20.9314285714286-3.06857142857143
4-19-10.1314285714286-8.8685714285714
58-1.268571428571439.26857142857143
62419.93142857142864.06857142857139
71417.3314285714286-3.33142857142859
876.731428571428570.268571428571433
9912.5314285714286-3.53142857142858
10-26-23.4657142857143-2.53428571428572
111914.60285714285724.39714285714285
121512.80285714285722.19714285714283
13-12.26857142857143-3.26857142857143
14-10-7.93142857142858-2.06857142857142
15-21-20.9314285714286-0.06857142857143
16-14-10.1314285714286-3.86857142857144
17-27-3.59714285714286-23.4028571428571
182617.60285714285718.39714285714287
192315.00285714285717.99714285714286
2054.402857142857140.597142857142855
211910.20285714285718.79714285714286
22-19-23.46571428571434.46571428571429
232416.93142857142867.06857142857143
241715.13142857142861.86857142857143
2514.59714285714285-3.59714285714285
26-9-5.60285714285716-3.39714285714284
27-16-18.60285714285712.60285714285714
28-21-7.80285714285713-13.1971428571429
29-14-1.26857142857143-12.7314285714286
303119.931428571428611.0685714285714
312717.33142857142869.66857142857143
32106.731428571428573.26857142857143
331212.5314285714286-0.531428571428566
34-23-21.1371428571429-1.86285714285714
351316.9314285714286-3.93142857142857
362615.131428571428610.8685714285714
37-14.59714285714285-5.59714285714285
384-5.602857142857169.60285714285716
39-16-18.60285714285712.60285714285714
40-5-7.802857142857142.80285714285714
419-1.2685714285714310.2685714285714
422319.93142857142863.06857142857144
43917.3314285714286-8.33142857142856
4426.73142857142857-4.73142857142857
451012.5314285714286-2.53142857142857
46-29-23.4657142857143-5.53428571428571
471714.60285714285712.39714285714285
48912.8028571428572-3.80285714285715
4992.268571428571426.73142857142858
50-10-7.93142857142858-2.06857142857142
51-23-20.9314285714286-2.06857142857143
5213-10.131428571428623.1314285714286
5313-3.5971428571428616.5971428571429
54-917.6028571428571-26.6028571428571
55915.0028571428571-6.00285714285713
5654.402857142857140.597142857142855
57810.2028571428571-2.20285714285714
58-18-23.46571428571435.46571428571429
59716.9314285714286-9.93142857142857
60415.1314285714286-11.1314285714286

\begin{tabular}{lllllllll}
\hline
Multiple Linear Regression - Actuals, Interpolation, and Residuals \tabularnewline
Time or Index & Actuals & InterpolationForecast & ResidualsPrediction Error \tabularnewline
1 & 8 & 2.26857142857144 & 5.73142857142856 \tabularnewline
2 & -10 & -7.93142857142855 & -2.06857142857145 \tabularnewline
3 & -24 & -20.9314285714286 & -3.06857142857143 \tabularnewline
4 & -19 & -10.1314285714286 & -8.8685714285714 \tabularnewline
5 & 8 & -1.26857142857143 & 9.26857142857143 \tabularnewline
6 & 24 & 19.9314285714286 & 4.06857142857139 \tabularnewline
7 & 14 & 17.3314285714286 & -3.33142857142859 \tabularnewline
8 & 7 & 6.73142857142857 & 0.268571428571433 \tabularnewline
9 & 9 & 12.5314285714286 & -3.53142857142858 \tabularnewline
10 & -26 & -23.4657142857143 & -2.53428571428572 \tabularnewline
11 & 19 & 14.6028571428572 & 4.39714285714285 \tabularnewline
12 & 15 & 12.8028571428572 & 2.19714285714283 \tabularnewline
13 & -1 & 2.26857142857143 & -3.26857142857143 \tabularnewline
14 & -10 & -7.93142857142858 & -2.06857142857142 \tabularnewline
15 & -21 & -20.9314285714286 & -0.06857142857143 \tabularnewline
16 & -14 & -10.1314285714286 & -3.86857142857144 \tabularnewline
17 & -27 & -3.59714285714286 & -23.4028571428571 \tabularnewline
18 & 26 & 17.6028571428571 & 8.39714285714287 \tabularnewline
19 & 23 & 15.0028571428571 & 7.99714285714286 \tabularnewline
20 & 5 & 4.40285714285714 & 0.597142857142855 \tabularnewline
21 & 19 & 10.2028571428571 & 8.79714285714286 \tabularnewline
22 & -19 & -23.4657142857143 & 4.46571428571429 \tabularnewline
23 & 24 & 16.9314285714286 & 7.06857142857143 \tabularnewline
24 & 17 & 15.1314285714286 & 1.86857142857143 \tabularnewline
25 & 1 & 4.59714285714285 & -3.59714285714285 \tabularnewline
26 & -9 & -5.60285714285716 & -3.39714285714284 \tabularnewline
27 & -16 & -18.6028571428571 & 2.60285714285714 \tabularnewline
28 & -21 & -7.80285714285713 & -13.1971428571429 \tabularnewline
29 & -14 & -1.26857142857143 & -12.7314285714286 \tabularnewline
30 & 31 & 19.9314285714286 & 11.0685714285714 \tabularnewline
31 & 27 & 17.3314285714286 & 9.66857142857143 \tabularnewline
32 & 10 & 6.73142857142857 & 3.26857142857143 \tabularnewline
33 & 12 & 12.5314285714286 & -0.531428571428566 \tabularnewline
34 & -23 & -21.1371428571429 & -1.86285714285714 \tabularnewline
35 & 13 & 16.9314285714286 & -3.93142857142857 \tabularnewline
36 & 26 & 15.1314285714286 & 10.8685714285714 \tabularnewline
37 & -1 & 4.59714285714285 & -5.59714285714285 \tabularnewline
38 & 4 & -5.60285714285716 & 9.60285714285716 \tabularnewline
39 & -16 & -18.6028571428571 & 2.60285714285714 \tabularnewline
40 & -5 & -7.80285714285714 & 2.80285714285714 \tabularnewline
41 & 9 & -1.26857142857143 & 10.2685714285714 \tabularnewline
42 & 23 & 19.9314285714286 & 3.06857142857144 \tabularnewline
43 & 9 & 17.3314285714286 & -8.33142857142856 \tabularnewline
44 & 2 & 6.73142857142857 & -4.73142857142857 \tabularnewline
45 & 10 & 12.5314285714286 & -2.53142857142857 \tabularnewline
46 & -29 & -23.4657142857143 & -5.53428571428571 \tabularnewline
47 & 17 & 14.6028571428571 & 2.39714285714285 \tabularnewline
48 & 9 & 12.8028571428572 & -3.80285714285715 \tabularnewline
49 & 9 & 2.26857142857142 & 6.73142857142858 \tabularnewline
50 & -10 & -7.93142857142858 & -2.06857142857142 \tabularnewline
51 & -23 & -20.9314285714286 & -2.06857142857143 \tabularnewline
52 & 13 & -10.1314285714286 & 23.1314285714286 \tabularnewline
53 & 13 & -3.59714285714286 & 16.5971428571429 \tabularnewline
54 & -9 & 17.6028571428571 & -26.6028571428571 \tabularnewline
55 & 9 & 15.0028571428571 & -6.00285714285713 \tabularnewline
56 & 5 & 4.40285714285714 & 0.597142857142855 \tabularnewline
57 & 8 & 10.2028571428571 & -2.20285714285714 \tabularnewline
58 & -18 & -23.4657142857143 & 5.46571428571429 \tabularnewline
59 & 7 & 16.9314285714286 & -9.93142857142857 \tabularnewline
60 & 4 & 15.1314285714286 & -11.1314285714286 \tabularnewline
\hline
\end{tabular}
%Source: https://freestatistics.org/blog/index.php?pk=25697&T=4

[TABLE]
[ROW][C]Multiple Linear Regression - Actuals, Interpolation, and Residuals[/C][/ROW]
[ROW][C]Time or Index[/C][C]Actuals[/C][C]InterpolationForecast[/C][C]ResidualsPrediction Error[/C][/ROW]
[ROW][C]1[/C][C]8[/C][C]2.26857142857144[/C][C]5.73142857142856[/C][/ROW]
[ROW][C]2[/C][C]-10[/C][C]-7.93142857142855[/C][C]-2.06857142857145[/C][/ROW]
[ROW][C]3[/C][C]-24[/C][C]-20.9314285714286[/C][C]-3.06857142857143[/C][/ROW]
[ROW][C]4[/C][C]-19[/C][C]-10.1314285714286[/C][C]-8.8685714285714[/C][/ROW]
[ROW][C]5[/C][C]8[/C][C]-1.26857142857143[/C][C]9.26857142857143[/C][/ROW]
[ROW][C]6[/C][C]24[/C][C]19.9314285714286[/C][C]4.06857142857139[/C][/ROW]
[ROW][C]7[/C][C]14[/C][C]17.3314285714286[/C][C]-3.33142857142859[/C][/ROW]
[ROW][C]8[/C][C]7[/C][C]6.73142857142857[/C][C]0.268571428571433[/C][/ROW]
[ROW][C]9[/C][C]9[/C][C]12.5314285714286[/C][C]-3.53142857142858[/C][/ROW]
[ROW][C]10[/C][C]-26[/C][C]-23.4657142857143[/C][C]-2.53428571428572[/C][/ROW]
[ROW][C]11[/C][C]19[/C][C]14.6028571428572[/C][C]4.39714285714285[/C][/ROW]
[ROW][C]12[/C][C]15[/C][C]12.8028571428572[/C][C]2.19714285714283[/C][/ROW]
[ROW][C]13[/C][C]-1[/C][C]2.26857142857143[/C][C]-3.26857142857143[/C][/ROW]
[ROW][C]14[/C][C]-10[/C][C]-7.93142857142858[/C][C]-2.06857142857142[/C][/ROW]
[ROW][C]15[/C][C]-21[/C][C]-20.9314285714286[/C][C]-0.06857142857143[/C][/ROW]
[ROW][C]16[/C][C]-14[/C][C]-10.1314285714286[/C][C]-3.86857142857144[/C][/ROW]
[ROW][C]17[/C][C]-27[/C][C]-3.59714285714286[/C][C]-23.4028571428571[/C][/ROW]
[ROW][C]18[/C][C]26[/C][C]17.6028571428571[/C][C]8.39714285714287[/C][/ROW]
[ROW][C]19[/C][C]23[/C][C]15.0028571428571[/C][C]7.99714285714286[/C][/ROW]
[ROW][C]20[/C][C]5[/C][C]4.40285714285714[/C][C]0.597142857142855[/C][/ROW]
[ROW][C]21[/C][C]19[/C][C]10.2028571428571[/C][C]8.79714285714286[/C][/ROW]
[ROW][C]22[/C][C]-19[/C][C]-23.4657142857143[/C][C]4.46571428571429[/C][/ROW]
[ROW][C]23[/C][C]24[/C][C]16.9314285714286[/C][C]7.06857142857143[/C][/ROW]
[ROW][C]24[/C][C]17[/C][C]15.1314285714286[/C][C]1.86857142857143[/C][/ROW]
[ROW][C]25[/C][C]1[/C][C]4.59714285714285[/C][C]-3.59714285714285[/C][/ROW]
[ROW][C]26[/C][C]-9[/C][C]-5.60285714285716[/C][C]-3.39714285714284[/C][/ROW]
[ROW][C]27[/C][C]-16[/C][C]-18.6028571428571[/C][C]2.60285714285714[/C][/ROW]
[ROW][C]28[/C][C]-21[/C][C]-7.80285714285713[/C][C]-13.1971428571429[/C][/ROW]
[ROW][C]29[/C][C]-14[/C][C]-1.26857142857143[/C][C]-12.7314285714286[/C][/ROW]
[ROW][C]30[/C][C]31[/C][C]19.9314285714286[/C][C]11.0685714285714[/C][/ROW]
[ROW][C]31[/C][C]27[/C][C]17.3314285714286[/C][C]9.66857142857143[/C][/ROW]
[ROW][C]32[/C][C]10[/C][C]6.73142857142857[/C][C]3.26857142857143[/C][/ROW]
[ROW][C]33[/C][C]12[/C][C]12.5314285714286[/C][C]-0.531428571428566[/C][/ROW]
[ROW][C]34[/C][C]-23[/C][C]-21.1371428571429[/C][C]-1.86285714285714[/C][/ROW]
[ROW][C]35[/C][C]13[/C][C]16.9314285714286[/C][C]-3.93142857142857[/C][/ROW]
[ROW][C]36[/C][C]26[/C][C]15.1314285714286[/C][C]10.8685714285714[/C][/ROW]
[ROW][C]37[/C][C]-1[/C][C]4.59714285714285[/C][C]-5.59714285714285[/C][/ROW]
[ROW][C]38[/C][C]4[/C][C]-5.60285714285716[/C][C]9.60285714285716[/C][/ROW]
[ROW][C]39[/C][C]-16[/C][C]-18.6028571428571[/C][C]2.60285714285714[/C][/ROW]
[ROW][C]40[/C][C]-5[/C][C]-7.80285714285714[/C][C]2.80285714285714[/C][/ROW]
[ROW][C]41[/C][C]9[/C][C]-1.26857142857143[/C][C]10.2685714285714[/C][/ROW]
[ROW][C]42[/C][C]23[/C][C]19.9314285714286[/C][C]3.06857142857144[/C][/ROW]
[ROW][C]43[/C][C]9[/C][C]17.3314285714286[/C][C]-8.33142857142856[/C][/ROW]
[ROW][C]44[/C][C]2[/C][C]6.73142857142857[/C][C]-4.73142857142857[/C][/ROW]
[ROW][C]45[/C][C]10[/C][C]12.5314285714286[/C][C]-2.53142857142857[/C][/ROW]
[ROW][C]46[/C][C]-29[/C][C]-23.4657142857143[/C][C]-5.53428571428571[/C][/ROW]
[ROW][C]47[/C][C]17[/C][C]14.6028571428571[/C][C]2.39714285714285[/C][/ROW]
[ROW][C]48[/C][C]9[/C][C]12.8028571428572[/C][C]-3.80285714285715[/C][/ROW]
[ROW][C]49[/C][C]9[/C][C]2.26857142857142[/C][C]6.73142857142858[/C][/ROW]
[ROW][C]50[/C][C]-10[/C][C]-7.93142857142858[/C][C]-2.06857142857142[/C][/ROW]
[ROW][C]51[/C][C]-23[/C][C]-20.9314285714286[/C][C]-2.06857142857143[/C][/ROW]
[ROW][C]52[/C][C]13[/C][C]-10.1314285714286[/C][C]23.1314285714286[/C][/ROW]
[ROW][C]53[/C][C]13[/C][C]-3.59714285714286[/C][C]16.5971428571429[/C][/ROW]
[ROW][C]54[/C][C]-9[/C][C]17.6028571428571[/C][C]-26.6028571428571[/C][/ROW]
[ROW][C]55[/C][C]9[/C][C]15.0028571428571[/C][C]-6.00285714285713[/C][/ROW]
[ROW][C]56[/C][C]5[/C][C]4.40285714285714[/C][C]0.597142857142855[/C][/ROW]
[ROW][C]57[/C][C]8[/C][C]10.2028571428571[/C][C]-2.20285714285714[/C][/ROW]
[ROW][C]58[/C][C]-18[/C][C]-23.4657142857143[/C][C]5.46571428571429[/C][/ROW]
[ROW][C]59[/C][C]7[/C][C]16.9314285714286[/C][C]-9.93142857142857[/C][/ROW]
[ROW][C]60[/C][C]4[/C][C]15.1314285714286[/C][C]-11.1314285714286[/C][/ROW]
[/TABLE]
Source: https://freestatistics.org/blog/index.php?pk=25697&T=4

Globally Unique Identifier (entire table): ba.freestatistics.org/blog/index.php?pk=25697&T=4

As an alternative you can also use a QR Code:  

The GUIDs for individual cells are displayed in the table below:

Multiple Linear Regression - Actuals, Interpolation, and Residuals
Time or IndexActualsInterpolationForecastResidualsPrediction Error
182.268571428571445.73142857142856
2-10-7.93142857142855-2.06857142857145
3-24-20.9314285714286-3.06857142857143
4-19-10.1314285714286-8.8685714285714
58-1.268571428571439.26857142857143
62419.93142857142864.06857142857139
71417.3314285714286-3.33142857142859
876.731428571428570.268571428571433
9912.5314285714286-3.53142857142858
10-26-23.4657142857143-2.53428571428572
111914.60285714285724.39714285714285
121512.80285714285722.19714285714283
13-12.26857142857143-3.26857142857143
14-10-7.93142857142858-2.06857142857142
15-21-20.9314285714286-0.06857142857143
16-14-10.1314285714286-3.86857142857144
17-27-3.59714285714286-23.4028571428571
182617.60285714285718.39714285714287
192315.00285714285717.99714285714286
2054.402857142857140.597142857142855
211910.20285714285718.79714285714286
22-19-23.46571428571434.46571428571429
232416.93142857142867.06857142857143
241715.13142857142861.86857142857143
2514.59714285714285-3.59714285714285
26-9-5.60285714285716-3.39714285714284
27-16-18.60285714285712.60285714285714
28-21-7.80285714285713-13.1971428571429
29-14-1.26857142857143-12.7314285714286
303119.931428571428611.0685714285714
312717.33142857142869.66857142857143
32106.731428571428573.26857142857143
331212.5314285714286-0.531428571428566
34-23-21.1371428571429-1.86285714285714
351316.9314285714286-3.93142857142857
362615.131428571428610.8685714285714
37-14.59714285714285-5.59714285714285
384-5.602857142857169.60285714285716
39-16-18.60285714285712.60285714285714
40-5-7.802857142857142.80285714285714
419-1.2685714285714310.2685714285714
422319.93142857142863.06857142857144
43917.3314285714286-8.33142857142856
4426.73142857142857-4.73142857142857
451012.5314285714286-2.53142857142857
46-29-23.4657142857143-5.53428571428571
471714.60285714285712.39714285714285
48912.8028571428572-3.80285714285715
4992.268571428571426.73142857142858
50-10-7.93142857142858-2.06857142857142
51-23-20.9314285714286-2.06857142857143
5213-10.131428571428623.1314285714286
5313-3.5971428571428616.5971428571429
54-917.6028571428571-26.6028571428571
55915.0028571428571-6.00285714285713
5654.402857142857140.597142857142855
57810.2028571428571-2.20285714285714
58-18-23.46571428571435.46571428571429
59716.9314285714286-9.93142857142857
60415.1314285714286-11.1314285714286


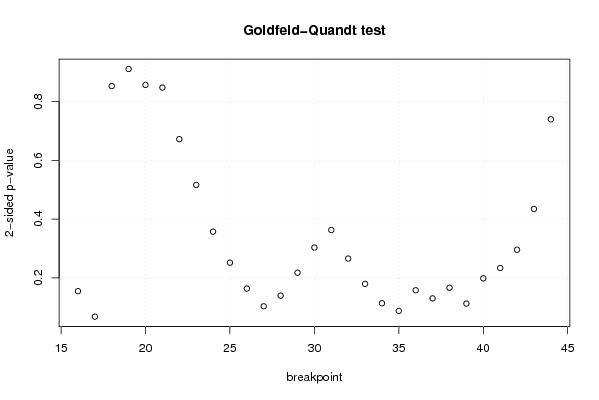
Goldfeld-Quandt test for Heteroskedasticity
p-valuesAlternative Hypothesis
breakpoint indexgreater2-sidedless
160.07749431923310730.1549886384662150.922505680766893
170.0341636397849150.068327279569830.965836360215085
180.426351708274990.852703416549980.57364829172501
190.5445112492637390.9109775014725230.455488750736261
200.4282839792463060.8565679584926120.571716020753694
210.4237918313855840.8475836627711690.576208168614416
220.3360677946814640.6721355893629290.663932205318536
230.2581853079166370.5163706158332750.741814692083363
240.1787423045176870.3574846090353730.821257695482313
250.1259966556224580.2519933112449170.874003344377542
260.08194223089724380.1638844617944880.918057769102756
270.05176819749870070.1035363949974010.9482318025013
280.06990782112386540.1398156422477310.930092178876135
290.1089168259293470.2178336518586930.891083174070653
300.1517376904207340.3034753808414680.848262309579266
310.181494989129310.362989978258620.81850501087069
320.1330088183447520.2660176366895050.866991181655248
330.0898718494395730.1797436988791460.910128150560427
340.05695927588706760.1139185517741350.943040724112932
350.04388407233019100.08776814466038210.95611592766981
360.0790065403825270.1580130807650540.920993459617473
370.06526884377257460.1305376875451490.934731156227425
380.08335448365082620.1667089673016520.916645516349174
390.05638142173307520.1127628434661500.943618578266925
400.09931349842176870.1986269968435370.900686501578231
410.1169270993936350.2338541987872690.883072900606365
420.8519958449345150.2960083101309700.148004155065485
430.7826835925418950.434632814916210.217316407458105
440.6301181002803940.7397637994392120.369881899719606

\begin{tabular}{lllllllll}
\hline
Goldfeld-Quandt test for Heteroskedasticity \tabularnewline
p-values & Alternative Hypothesis \tabularnewline
breakpoint index & greater & 2-sided & less \tabularnewline
16 & 0.0774943192331073 & 0.154988638466215 & 0.922505680766893 \tabularnewline
17 & 0.034163639784915 & 0.06832727956983 & 0.965836360215085 \tabularnewline
18 & 0.42635170827499 & 0.85270341654998 & 0.57364829172501 \tabularnewline
19 & 0.544511249263739 & 0.910977501472523 & 0.455488750736261 \tabularnewline
20 & 0.428283979246306 & 0.856567958492612 & 0.571716020753694 \tabularnewline
21 & 0.423791831385584 & 0.847583662771169 & 0.576208168614416 \tabularnewline
22 & 0.336067794681464 & 0.672135589362929 & 0.663932205318536 \tabularnewline
23 & 0.258185307916637 & 0.516370615833275 & 0.741814692083363 \tabularnewline
24 & 0.178742304517687 & 0.357484609035373 & 0.821257695482313 \tabularnewline
25 & 0.125996655622458 & 0.251993311244917 & 0.874003344377542 \tabularnewline
26 & 0.0819422308972438 & 0.163884461794488 & 0.918057769102756 \tabularnewline
27 & 0.0517681974987007 & 0.103536394997401 & 0.9482318025013 \tabularnewline
28 & 0.0699078211238654 & 0.139815642247731 & 0.930092178876135 \tabularnewline
29 & 0.108916825929347 & 0.217833651858693 & 0.891083174070653 \tabularnewline
30 & 0.151737690420734 & 0.303475380841468 & 0.848262309579266 \tabularnewline
31 & 0.18149498912931 & 0.36298997825862 & 0.81850501087069 \tabularnewline
32 & 0.133008818344752 & 0.266017636689505 & 0.866991181655248 \tabularnewline
33 & 0.089871849439573 & 0.179743698879146 & 0.910128150560427 \tabularnewline
34 & 0.0569592758870676 & 0.113918551774135 & 0.943040724112932 \tabularnewline
35 & 0.0438840723301910 & 0.0877681446603821 & 0.95611592766981 \tabularnewline
36 & 0.079006540382527 & 0.158013080765054 & 0.920993459617473 \tabularnewline
37 & 0.0652688437725746 & 0.130537687545149 & 0.934731156227425 \tabularnewline
38 & 0.0833544836508262 & 0.166708967301652 & 0.916645516349174 \tabularnewline
39 & 0.0563814217330752 & 0.112762843466150 & 0.943618578266925 \tabularnewline
40 & 0.0993134984217687 & 0.198626996843537 & 0.900686501578231 \tabularnewline
41 & 0.116927099393635 & 0.233854198787269 & 0.883072900606365 \tabularnewline
42 & 0.851995844934515 & 0.296008310130970 & 0.148004155065485 \tabularnewline
43 & 0.782683592541895 & 0.43463281491621 & 0.217316407458105 \tabularnewline
44 & 0.630118100280394 & 0.739763799439212 & 0.369881899719606 \tabularnewline
\hline
\end{tabular}
%Source: https://freestatistics.org/blog/index.php?pk=25697&T=5

[TABLE]
[ROW][C]Goldfeld-Quandt test for Heteroskedasticity[/C][/ROW]
[ROW][C]p-values[/C][C]Alternative Hypothesis[/C][/ROW]
[ROW][C]breakpoint index[/C][C]greater[/C][C]2-sided[/C][C]less[/C][/ROW]
[ROW][C]16[/C][C]0.0774943192331073[/C][C]0.154988638466215[/C][C]0.922505680766893[/C][/ROW]
[ROW][C]17[/C][C]0.034163639784915[/C][C]0.06832727956983[/C][C]0.965836360215085[/C][/ROW]
[ROW][C]18[/C][C]0.42635170827499[/C][C]0.85270341654998[/C][C]0.57364829172501[/C][/ROW]
[ROW][C]19[/C][C]0.544511249263739[/C][C]0.910977501472523[/C][C]0.455488750736261[/C][/ROW]
[ROW][C]20[/C][C]0.428283979246306[/C][C]0.856567958492612[/C][C]0.571716020753694[/C][/ROW]
[ROW][C]21[/C][C]0.423791831385584[/C][C]0.847583662771169[/C][C]0.576208168614416[/C][/ROW]
[ROW][C]22[/C][C]0.336067794681464[/C][C]0.672135589362929[/C][C]0.663932205318536[/C][/ROW]
[ROW][C]23[/C][C]0.258185307916637[/C][C]0.516370615833275[/C][C]0.741814692083363[/C][/ROW]
[ROW][C]24[/C][C]0.178742304517687[/C][C]0.357484609035373[/C][C]0.821257695482313[/C][/ROW]
[ROW][C]25[/C][C]0.125996655622458[/C][C]0.251993311244917[/C][C]0.874003344377542[/C][/ROW]
[ROW][C]26[/C][C]0.0819422308972438[/C][C]0.163884461794488[/C][C]0.918057769102756[/C][/ROW]
[ROW][C]27[/C][C]0.0517681974987007[/C][C]0.103536394997401[/C][C]0.9482318025013[/C][/ROW]
[ROW][C]28[/C][C]0.0699078211238654[/C][C]0.139815642247731[/C][C]0.930092178876135[/C][/ROW]
[ROW][C]29[/C][C]0.108916825929347[/C][C]0.217833651858693[/C][C]0.891083174070653[/C][/ROW]
[ROW][C]30[/C][C]0.151737690420734[/C][C]0.303475380841468[/C][C]0.848262309579266[/C][/ROW]
[ROW][C]31[/C][C]0.18149498912931[/C][C]0.36298997825862[/C][C]0.81850501087069[/C][/ROW]
[ROW][C]32[/C][C]0.133008818344752[/C][C]0.266017636689505[/C][C]0.866991181655248[/C][/ROW]
[ROW][C]33[/C][C]0.089871849439573[/C][C]0.179743698879146[/C][C]0.910128150560427[/C][/ROW]
[ROW][C]34[/C][C]0.0569592758870676[/C][C]0.113918551774135[/C][C]0.943040724112932[/C][/ROW]
[ROW][C]35[/C][C]0.0438840723301910[/C][C]0.0877681446603821[/C][C]0.95611592766981[/C][/ROW]
[ROW][C]36[/C][C]0.079006540382527[/C][C]0.158013080765054[/C][C]0.920993459617473[/C][/ROW]
[ROW][C]37[/C][C]0.0652688437725746[/C][C]0.130537687545149[/C][C]0.934731156227425[/C][/ROW]
[ROW][C]38[/C][C]0.0833544836508262[/C][C]0.166708967301652[/C][C]0.916645516349174[/C][/ROW]
[ROW][C]39[/C][C]0.0563814217330752[/C][C]0.112762843466150[/C][C]0.943618578266925[/C][/ROW]
[ROW][C]40[/C][C]0.0993134984217687[/C][C]0.198626996843537[/C][C]0.900686501578231[/C][/ROW]
[ROW][C]41[/C][C]0.116927099393635[/C][C]0.233854198787269[/C][C]0.883072900606365[/C][/ROW]
[ROW][C]42[/C][C]0.851995844934515[/C][C]0.296008310130970[/C][C]0.148004155065485[/C][/ROW]
[ROW][C]43[/C][C]0.782683592541895[/C][C]0.43463281491621[/C][C]0.217316407458105[/C][/ROW]
[ROW][C]44[/C][C]0.630118100280394[/C][C]0.739763799439212[/C][C]0.369881899719606[/C][/ROW]
[/TABLE]
Source: https://freestatistics.org/blog/index.php?pk=25697&T=5

Globally Unique Identifier (entire table): ba.freestatistics.org/blog/index.php?pk=25697&T=5

As an alternative you can also use a QR Code:  

The GUIDs for individual cells are displayed in the table below:

Goldfeld-Quandt test for Heteroskedasticity
p-valuesAlternative Hypothesis
breakpoint indexgreater2-sidedless
160.07749431923310730.1549886384662150.922505680766893
170.0341636397849150.068327279569830.965836360215085
180.426351708274990.852703416549980.57364829172501
190.5445112492637390.9109775014725230.455488750736261
200.4282839792463060.8565679584926120.571716020753694
210.4237918313855840.8475836627711690.576208168614416
220.3360677946814640.6721355893629290.663932205318536
230.2581853079166370.5163706158332750.741814692083363
240.1787423045176870.3574846090353730.821257695482313
250.1259966556224580.2519933112449170.874003344377542
260.08194223089724380.1638844617944880.918057769102756
270.05176819749870070.1035363949974010.9482318025013
280.06990782112386540.1398156422477310.930092178876135
290.1089168259293470.2178336518586930.891083174070653
300.1517376904207340.3034753808414680.848262309579266
310.181494989129310.362989978258620.81850501087069
320.1330088183447520.2660176366895050.866991181655248
330.0898718494395730.1797436988791460.910128150560427
340.05695927588706760.1139185517741350.943040724112932
350.04388407233019100.08776814466038210.95611592766981
360.0790065403825270.1580130807650540.920993459617473
370.06526884377257460.1305376875451490.934731156227425
380.08335448365082620.1667089673016520.916645516349174
390.05638142173307520.1127628434661500.943618578266925
400.09931349842176870.1986269968435370.900686501578231
410.1169270993936350.2338541987872690.883072900606365
420.8519958449345150.2960083101309700.148004155065485
430.7826835925418950.434632814916210.217316407458105
440.6301181002803940.7397637994392120.369881899719606


Meta Analysis of Goldfeld-Quandt test for Heteroskedasticity
Description# significant tests% significant testsOK/NOK
1% type I error level00OK
5% type I error level00OK
10% type I error level20.0689655172413793OK

\begin{tabular}{lllllllll}
\hline
Meta Analysis of Goldfeld-Quandt test for Heteroskedasticity \tabularnewline
Description & # significant tests & % significant tests & OK/NOK \tabularnewline
1% type I error level & 0 & 0 & OK \tabularnewline
5% type I error level & 0 & 0 & OK \tabularnewline
10% type I error level & 2 & 0.0689655172413793 & OK \tabularnewline
\hline
\end{tabular}
%Source: https://freestatistics.org/blog/index.php?pk=25697&T=6

[TABLE]
[ROW][C]Meta Analysis of Goldfeld-Quandt test for Heteroskedasticity[/C][/ROW]
[ROW][C]Description[/C][C]# significant tests[/C][C]% significant tests[/C][C]OK/NOK[/C][/ROW]
[ROW][C]1% type I error level[/C][C]0[/C][C]0[/C][C]OK[/C][/ROW]
[ROW][C]5% type I error level[/C][C]0[/C][C]0[/C][C]OK[/C][/ROW]
[ROW][C]10% type I error level[/C][C]2[/C][C]0.0689655172413793[/C][C]OK[/C][/ROW]
[/TABLE]
Source: https://freestatistics.org/blog/index.php?pk=25697&T=6

Globally Unique Identifier (entire table): ba.freestatistics.org/blog/index.php?pk=25697&T=6

As an alternative you can also use a QR Code:  

The GUIDs for individual cells are displayed in the table below:

Meta Analysis of Goldfeld-Quandt test for Heteroskedasticity
Description# significant tests% significant testsOK/NOK
1% type I error level00OK
5% type I error level00OK
10% type I error level20.0689655172413793OK


Parameters (Session):
par1 = 1 ; par2 = Include Monthly Dummies ; par3 = No Linear Trend ;
Parameters (R input):
par1 = 1 ; par2 = Include Monthly Dummies ; par3 = No Linear Trend ;
R code (references can be found in the software module):
library(lattice)
library(lmtest)
n25 <- 25 #minimum number of obs. for Goldfeld-Quandt test
par1 <- as.numeric(par1)
x <- t(y)
k <- length(x[1,])
n <- length(x[,1])
x1 <- cbind(x[,par1], x[,1:k!=par1])
mycolnames <- c(colnames(x)[par1], colnames(x)[1:k!=par1])
colnames(x1) <- mycolnames #colnames(x)[par1]
x <- x1
if (par3 == 'First Differences'){
x2 <- array(0, dim=c(n-1,k), dimnames=list(1:(n-1), paste('(1-B)',colnames(x),sep='')))
for (i in 1:n-1) {
for (j in 1:k) {
x2[i,j] <- x[i+1,j] - x[i,j]
}
}
x <- x2
}
if (par2 == 'Include Monthly Dummies'){
x2 <- array(0, dim=c(n,11), dimnames=list(1:n, paste('M', seq(1:11), sep ='')))
for (i in 1:11){
x2[seq(i,n,12),i] <- 1
}
x <- cbind(x, x2)
}
if (par2 == 'Include Quarterly Dummies'){
x2 <- array(0, dim=c(n,3), dimnames=list(1:n, paste('Q', seq(1:3), sep ='')))
for (i in 1:3){
x2[seq(i,n,4),i] <- 1
}
x <- cbind(x, x2)
}
k <- length(x[1,])
if (par3 == 'Linear Trend'){
x <- cbind(x, c(1:n))
colnames(x)[k+1] <- 't'
}
x
k <- length(x[1,])
df <- as.data.frame(x)
(mylm <- lm(df))
(mysum <- summary(mylm))
if (n > n25) {
kp3 <- k + 3
nmkm3 <- n - k - 3
gqarr <- array(NA, dim=c(nmkm3-kp3+1,3))
numgqtests <- 0
numsignificant1 <- 0
numsignificant5 <- 0
numsignificant10 <- 0
for (mypoint in kp3:nmkm3) {
j <- 0
numgqtests <- numgqtests + 1
for (myalt in c('greater', 'two.sided', 'less')) {
j <- j + 1
gqarr[mypoint-kp3+1,j] <- gqtest(mylm, point=mypoint, alternative=myalt)$p.value
}
if (gqarr[mypoint-kp3+1,2] < 0.01) numsignificant1 <- numsignificant1 + 1
if (gqarr[mypoint-kp3+1,2] < 0.05) numsignificant5 <- numsignificant5 + 1
if (gqarr[mypoint-kp3+1,2] < 0.10) numsignificant10 <- numsignificant10 + 1
}
gqarr
}
bitmap(file='test0.png')
plot(x[,1], type='l', main='Actuals and Interpolation', ylab='value of Actuals and Interpolation (dots)', xlab='time or index')
points(x[,1]-mysum$resid)
grid()
dev.off()
bitmap(file='test1.png')
plot(mysum$resid, type='b', pch=19, main='Residuals', ylab='value of Residuals', xlab='time or index')
grid()
dev.off()
bitmap(file='test2.png')
hist(mysum$resid, main='Residual Histogram', xlab='values of Residuals')
grid()
dev.off()
bitmap(file='test3.png')
densityplot(~mysum$resid,col='black',main='Residual Density Plot', xlab='values of Residuals')
dev.off()
bitmap(file='test4.png')
qqnorm(mysum$resid, main='Residual Normal Q-Q Plot')
qqline(mysum$resid)
grid()
dev.off()
(myerror <- as.ts(mysum$resid))
bitmap(file='test5.png')
dum <- cbind(lag(myerror,k=1),myerror)
dum
dum1 <- dum[2:length(myerror),]
dum1
z <- as.data.frame(dum1)
z
plot(z,main=paste('Residual Lag plot, lowess, and regression line'), ylab='values of Residuals', xlab='lagged values of Residuals')
lines(lowess(z))
abline(lm(z))
grid()
dev.off()
bitmap(file='test6.png')
acf(mysum$resid, lag.max=length(mysum$resid)/2, main='Residual Autocorrelation Function')
grid()
dev.off()
bitmap(file='test7.png')
pacf(mysum$resid, lag.max=length(mysum$resid)/2, main='Residual Partial Autocorrelation Function')
grid()
dev.off()
bitmap(file='test8.png')
opar <- par(mfrow = c(2,2), oma = c(0, 0, 1.1, 0))
plot(mylm, las = 1, sub='Residual Diagnostics')
par(opar)
dev.off()
if (n > n25) {
bitmap(file='test9.png')
plot(kp3:nmkm3,gqarr[,2], main='Goldfeld-Quandt test',ylab='2-sided p-value',xlab='breakpoint')
grid()
dev.off()
}
load(file='createtable')
a<-table.start()
a<-table.row.start(a)
a<-table.element(a, 'Multiple Linear Regression - Estimated Regression Equation', 1, TRUE)
a<-table.row.end(a)
myeq <- colnames(x)[1]
myeq <- paste(myeq, '[t] = ', sep='')
for (i in 1:k){
if (mysum$coefficients[i,1] > 0) myeq <- paste(myeq, '+', '')
myeq <- paste(myeq, mysum$coefficients[i,1], sep=' ')
if (rownames(mysum$coefficients)[i] != '(Intercept)') {
myeq <- paste(myeq, rownames(mysum$coefficients)[i], sep='')
if (rownames(mysum$coefficients)[i] != 't') myeq <- paste(myeq, '[t]', sep='')
}
}
myeq <- paste(myeq, ' + e[t]')
a<-table.row.start(a)
a<-table.element(a, myeq)
a<-table.row.end(a)
a<-table.end(a)
table.save(a,file='mytable1.tab')
a<-table.start()
a<-table.row.start(a)
a<-table.element(a,hyperlink('ols1.htm','Multiple Linear Regression - Ordinary Least Squares',''), 6, TRUE)
a<-table.row.end(a)
a<-table.row.start(a)
a<-table.element(a,'Variable',header=TRUE)
a<-table.element(a,'Parameter',header=TRUE)
a<-table.element(a,'S.D.',header=TRUE)
a<-table.element(a,'T-STAT
H0: parameter = 0',header=TRUE)
a<-table.element(a,'2-tail p-value',header=TRUE)
a<-table.element(a,'1-tail p-value',header=TRUE)
a<-table.row.end(a)
for (i in 1:k){
a<-table.row.start(a)
a<-table.element(a,rownames(mysum$coefficients)[i],header=TRUE)
a<-table.element(a,mysum$coefficients[i,1])
a<-table.element(a, round(mysum$coefficients[i,2],6))
a<-table.element(a, round(mysum$coefficients[i,3],4))
a<-table.element(a, round(mysum$coefficients[i,4],6))
a<-table.element(a, round(mysum$coefficients[i,4]/2,6))
a<-table.row.end(a)
}
a<-table.end(a)
table.save(a,file='mytable2.tab')
a<-table.start()
a<-table.row.start(a)
a<-table.element(a, 'Multiple Linear Regression - Regression Statistics', 2, TRUE)
a<-table.row.end(a)
a<-table.row.start(a)
a<-table.element(a, 'Multiple R',1,TRUE)
a<-table.element(a, sqrt(mysum$r.squared))
a<-table.row.end(a)
a<-table.row.start(a)
a<-table.element(a, 'R-squared',1,TRUE)
a<-table.element(a, mysum$r.squared)
a<-table.row.end(a)
a<-table.row.start(a)
a<-table.element(a, 'Adjusted R-squared',1,TRUE)
a<-table.element(a, mysum$adj.r.squared)
a<-table.row.end(a)
a<-table.row.start(a)
a<-table.element(a, 'F-TEST (value)',1,TRUE)
a<-table.element(a, mysum$fstatistic[1])
a<-table.row.end(a)
a<-table.row.start(a)
a<-table.element(a, 'F-TEST (DF numerator)',1,TRUE)
a<-table.element(a, mysum$fstatistic[2])
a<-table.row.end(a)
a<-table.row.start(a)
a<-table.element(a, 'F-TEST (DF denominator)',1,TRUE)
a<-table.element(a, mysum$fstatistic[3])
a<-table.row.end(a)
a<-table.row.start(a)
a<-table.element(a, 'p-value',1,TRUE)
a<-table.element(a, 1-pf(mysum$fstatistic[1],mysum$fstatistic[2],mysum$fstatistic[3]))
a<-table.row.end(a)
a<-table.row.start(a)
a<-table.element(a, 'Multiple Linear Regression - Residual Statistics', 2, TRUE)
a<-table.row.end(a)
a<-table.row.start(a)
a<-table.element(a, 'Residual Standard Deviation',1,TRUE)
a<-table.element(a, mysum$sigma)
a<-table.row.end(a)
a<-table.row.start(a)
a<-table.element(a, 'Sum Squared Residuals',1,TRUE)
a<-table.element(a, sum(myerror*myerror))
a<-table.row.end(a)
a<-table.end(a)
table.save(a,file='mytable3.tab')
a<-table.start()
a<-table.row.start(a)
a<-table.element(a, 'Multiple Linear Regression - Actuals, Interpolation, and Residuals', 4, TRUE)
a<-table.row.end(a)
a<-table.row.start(a)
a<-table.element(a, 'Time or Index', 1, TRUE)
a<-table.element(a, 'Actuals', 1, TRUE)
a<-table.element(a, 'Interpolation
Forecast', 1, TRUE)
a<-table.element(a, 'Residuals
Prediction Error', 1, TRUE)
a<-table.row.end(a)
for (i in 1:n) {
a<-table.row.start(a)
a<-table.element(a,i, 1, TRUE)
a<-table.element(a,x[i])
a<-table.element(a,x[i]-mysum$resid[i])
a<-table.element(a,mysum$resid[i])
a<-table.row.end(a)
}
a<-table.end(a)
table.save(a,file='mytable4.tab')
if (n > n25) {
a<-table.start()
a<-table.row.start(a)
a<-table.element(a,'Goldfeld-Quandt test for Heteroskedasticity',4,TRUE)
a<-table.row.end(a)
a<-table.row.start(a)
a<-table.element(a,'p-values',header=TRUE)
a<-table.element(a,'Alternative Hypothesis',3,header=TRUE)
a<-table.row.end(a)
a<-table.row.start(a)
a<-table.element(a,'breakpoint index',header=TRUE)
a<-table.element(a,'greater',header=TRUE)
a<-table.element(a,'2-sided',header=TRUE)
a<-table.element(a,'less',header=TRUE)
a<-table.row.end(a)
for (mypoint in kp3:nmkm3) {
a<-table.row.start(a)
a<-table.element(a,mypoint,header=TRUE)
a<-table.element(a,gqarr[mypoint-kp3+1,1])
a<-table.element(a,gqarr[mypoint-kp3+1,2])
a<-table.element(a,gqarr[mypoint-kp3+1,3])
a<-table.row.end(a)
}
a<-table.end(a)
table.save(a,file='mytable5.tab')
a<-table.start()
a<-table.row.start(a)
a<-table.element(a,'Meta Analysis of Goldfeld-Quandt test for Heteroskedasticity',4,TRUE)
a<-table.row.end(a)
a<-table.row.start(a)
a<-table.element(a,'Description',header=TRUE)
a<-table.element(a,'# significant tests',header=TRUE)
a<-table.element(a,'% significant tests',header=TRUE)
a<-table.element(a,'OK/NOK',header=TRUE)
a<-table.row.end(a)
a<-table.row.start(a)
a<-table.element(a,'1% type I error level',header=TRUE)
a<-table.element(a,numsignificant1)
a<-table.element(a,numsignificant1/numgqtests)
if (numsignificant1/numgqtests < 0.01) dum <- 'OK' else dum <- 'NOK'
a<-table.element(a,dum)
a<-table.row.end(a)
a<-table.row.start(a)
a<-table.element(a,'5% type I error level',header=TRUE)
a<-table.element(a,numsignificant5)
a<-table.element(a,numsignificant5/numgqtests)
if (numsignificant5/numgqtests < 0.05) dum <- 'OK' else dum <- 'NOK'
a<-table.element(a,dum)
a<-table.row.end(a)
a<-table.row.start(a)
a<-table.element(a,'10% type I error level',header=TRUE)
a<-table.element(a,numsignificant10)
a<-table.element(a,numsignificant10/numgqtests)
if (numsignificant10/numgqtests < 0.1) dum <- 'OK' else dum <- 'NOK'
a<-table.element(a,dum)
a<-table.row.end(a)
a<-table.end(a)
table.save(a,file='mytable6.tab')
}