Free Statistics

of Irreproducible Research!

Author's title

Author*The author of this computation has been verified*
R Software Modulerwasp_multipleregression.wasp
Title produced by softwareMultiple Regression
Date of computationWed, 26 Nov 2008 09:44:09 -0700
Cite this page as followsStatistical Computations at FreeStatistics.org, Office for Research Development and Education, URL https://freestatistics.org/blog/index.php?v=date/2008/Nov/26/t1227717881lh90l2vgxheeovk.htm/, Retrieved Sun, 19 May 2024 06:01:29 +0000
Statistical Computations at FreeStatistics.org, Office for Research Development and Education, URL https://freestatistics.org/blog/index.php?pk=25658, Retrieved Sun, 19 May 2024 06:01:29 +0000
QR Codes:

Original text written by user:
IsPrivate?No (this computation is public)
User-defined keywords
Estimated Impact188
Family? (F = Feedback message, R = changed R code, M = changed R Module, P = changed Parameters, D = changed Data)
F       [Multiple Regression] [Case: the Seatbel...] [2008-11-26 16:44:09] [1828943283e41f5e3270e2e73d6433b4] [Current]
Feedback Forum
2008-11-29 13:29:20 [Sofie Sergoynne] [reply
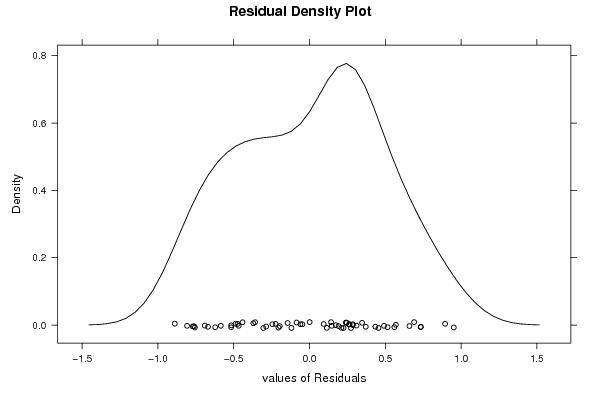
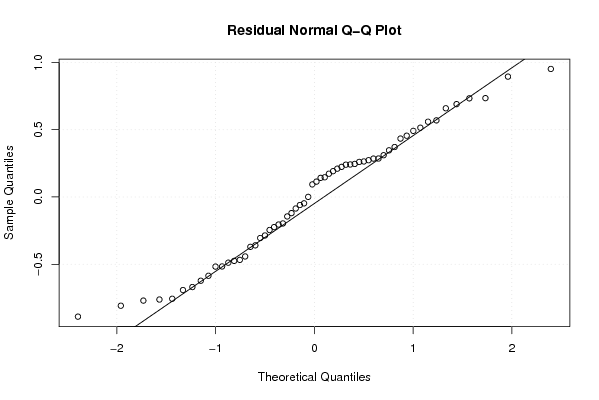
De tabel met de monthly dummies is correct. Ik zou hier nog iets extra bij vermelden over de 1-tail en 2-tail (= oppervlakte van de staarten). Naar welke je kijkt... en waarom. Ook dat M7 een negatief getal heeft en de rest niet, vraagt om een verklaring. Ik denk dat in deze maand de inflatie van de energiedragers sterk gedaald is ten opzichte van de referentiemaand. We kunnen idd zien op de grafiek dat dit topic weinig seizoensgebonden is. Er zit namelijk helemaal geen wederkerend patroon in. Voor de residus zou ik nog een verklaring geven waarom ze niet schommelen rond 0.
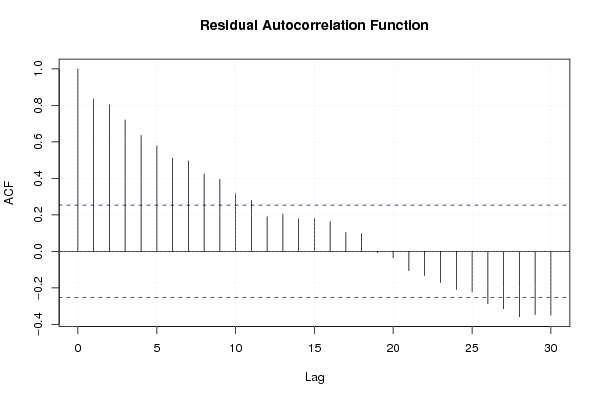
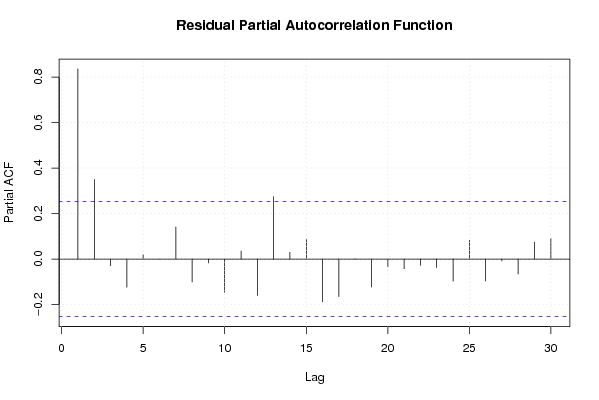
De rest van de grafieken zijn vrij correct geïnterpreteerd.
2008-11-30 16:08:29 [Stephanie Vanderlinden] [reply
De verklaringen bij de grafieken zijn goed. De verklaringen bij de tabellen kon beter. Alle maanden hebben maar een kleine afwijking van het intercept, maar 1 maand vertoont een negatieve afwijkingen. De verklaring hiervoor ontbreekt.
2008-12-01 12:59:57 [Alexander Hendrickx] [reply
De tabellen en grafieken zijn goed opgemaakt de conclusies van de grafieken zijn oké ik zou enkel nog de negatieve afwijking van het intercept in maand 7 verklaren.

Post a new message
Dataseries X:
4.8	19.2
5.5	26.6
5.4	26.6
5.9	31.4
5.8	31.2
5.1	26.4
4.1	20.7
4.4	20.7
3.6	15
3.5	13.3
3.1	8.7
2.9	10.2
2.2	4.3
1.4	-0.1
1.2	-4.6
1.3	-3.9
1.3	-3.5
1.3	-3.4
1.8	-2.5
1.8	-1.1
1.8	0.3
1.7	-0.9
2.1	3.6
2	2.7
1.7	-0.2
1.9	-1
2.3	5.8
2.4	6.4
2.5	9.6
2.8	13.2
2.6	10.6
2.2	10.9
2.8	12.9
2.8	15.9
2.8	12.2
2.3	9.1
2.2	9
3	17.4
2.9	14.7
2.7	17
2.7	13.7
2.3	9.5
2.4	14.8
2.8	13.6
2.3	12.6
2	8.9
1.9	10.2
2.3	12.7
2.7	16
1.8	10.4
2	9.9
2.1	9.5
2	8.6
2.4	10
1.7	3.5
1	-4.2
1.2	-4.4
1.4	-1.5
1.7	-0.1
1.8	0.8


Summary of computational transaction
Raw Inputview raw input (R code)
Raw Outputview raw output of R engine
Computing time4 seconds
R Server'Gwilym Jenkins' @ 72.249.127.135

\begin{tabular}{lllllllll}
\hline
Summary of computational transaction \tabularnewline
Raw Input & view raw input (R code)  \tabularnewline
Raw Output & view raw output of R engine  \tabularnewline
Computing time & 4 seconds \tabularnewline
R Server & 'Gwilym Jenkins' @ 72.249.127.135 \tabularnewline
\hline
\end{tabular}
%Source: https://freestatistics.org/blog/index.php?pk=25658&T=0

[TABLE]
[ROW][C]Summary of computational transaction[/C][/ROW]
[ROW][C]Raw Input[/C][C]view raw input (R code) [/C][/ROW]
[ROW][C]Raw Output[/C][C]view raw output of R engine [/C][/ROW]
[ROW][C]Computing time[/C][C]4 seconds[/C][/ROW]
[ROW][C]R Server[/C][C]'Gwilym Jenkins' @ 72.249.127.135[/C][/ROW]
[/TABLE]
Source: https://freestatistics.org/blog/index.php?pk=25658&T=0

Globally Unique Identifier (entire table): ba.freestatistics.org/blog/index.php?pk=25658&T=0

As an alternative you can also use a QR Code:  

The GUIDs for individual cells are displayed in the table below:

Summary of computational transaction
Raw Inputview raw input (R code)
Raw Outputview raw output of R engine
Computing time4 seconds
R Server'Gwilym Jenkins' @ 72.249.127.135


Multiple Linear Regression - Estimated Regression Equation
Inflatie_België[t] = + 1.42011577718145 + 0.118293552509654Inflatie_energiedragers[t] + 0.157168505575281M1[t] + 0.0388749530656324M2[t] + 0.100167792517370M3[t] + 0.030898108501924M4[t] + 0.0298250769034686M5[t] + 0.0420940478609984M6[t] -0.0144410418223971M7[t] + 0.0759016737915046M8[t] + 0.0587071605482621M9[t] + 0.0152682578996135M10[t] + 0.0812928394517373M11[t] + e[t]

\begin{tabular}{lllllllll}
\hline
Multiple Linear Regression - Estimated Regression Equation \tabularnewline
Inflatie_België[t] =  +  1.42011577718145 +  0.118293552509654Inflatie_energiedragers[t] +  0.157168505575281M1[t] +  0.0388749530656324M2[t] +  0.100167792517370M3[t] +  0.030898108501924M4[t] +  0.0298250769034686M5[t] +  0.0420940478609984M6[t] -0.0144410418223971M7[t] +  0.0759016737915046M8[t] +  0.0587071605482621M9[t] +  0.0152682578996135M10[t] +  0.0812928394517373M11[t]  + e[t] \tabularnewline
\hline
\end{tabular}
%Source: https://freestatistics.org/blog/index.php?pk=25658&T=1

[TABLE]
[ROW][C]Multiple Linear Regression - Estimated Regression Equation[/C][/ROW]
[ROW][C]Inflatie_België[t] =  +  1.42011577718145 +  0.118293552509654Inflatie_energiedragers[t] +  0.157168505575281M1[t] +  0.0388749530656324M2[t] +  0.100167792517370M3[t] +  0.030898108501924M4[t] +  0.0298250769034686M5[t] +  0.0420940478609984M6[t] -0.0144410418223971M7[t] +  0.0759016737915046M8[t] +  0.0587071605482621M9[t] +  0.0152682578996135M10[t] +  0.0812928394517373M11[t]  + e[t][/C][/ROW]
[/TABLE]
Source: https://freestatistics.org/blog/index.php?pk=25658&T=1

Globally Unique Identifier (entire table): ba.freestatistics.org/blog/index.php?pk=25658&T=1

As an alternative you can also use a QR Code:  

The GUIDs for individual cells are displayed in the table below:

Multiple Linear Regression - Estimated Regression Equation
Inflatie_België[t] = + 1.42011577718145 + 0.118293552509654Inflatie_energiedragers[t] + 0.157168505575281M1[t] + 0.0388749530656324M2[t] + 0.100167792517370M3[t] + 0.030898108501924M4[t] + 0.0298250769034686M5[t] + 0.0420940478609984M6[t] -0.0144410418223971M7[t] + 0.0759016737915046M8[t] + 0.0587071605482621M9[t] + 0.0152682578996135M10[t] + 0.0812928394517373M11[t] + e[t]


Multiple Linear Regression - Ordinary Least Squares
VariableParameterS.D.T-STATH0: parameter = 02-tail p-value1-tail p-value
(Intercept)1.420115777181450.2442675.81381e-060
Inflatie_energiedragers0.1182935525096540.00780515.155500
M10.1571685055752810.337030.46630.6431310.321566
M20.03887495306563240.3375830.11520.9088110.454406
M30.1001677925173700.337470.29680.7679120.383956
M40.0308981085019240.3386750.09120.9276960.463848
M50.02982507690346860.3385340.08810.9301710.465086
M60.04209404786099840.3379120.12460.9013940.450697
M7-0.01444104182239710.336924-0.04290.9659940.482997
M80.07590167379150460.3365080.22560.8225240.411262
M90.05870716054826210.336440.17450.8622260.431113
M100.01526825789961350.3364380.04540.9639950.481997
M110.08129283945173730.336440.24160.8101210.40506

\begin{tabular}{lllllllll}
\hline
Multiple Linear Regression - Ordinary Least Squares \tabularnewline
Variable & Parameter & S.D. & T-STATH0: parameter = 0 & 2-tail p-value & 1-tail p-value \tabularnewline
(Intercept) & 1.42011577718145 & 0.244267 & 5.8138 & 1e-06 & 0 \tabularnewline
Inflatie_energiedragers & 0.118293552509654 & 0.007805 & 15.1555 & 0 & 0 \tabularnewline
M1 & 0.157168505575281 & 0.33703 & 0.4663 & 0.643131 & 0.321566 \tabularnewline
M2 & 0.0388749530656324 & 0.337583 & 0.1152 & 0.908811 & 0.454406 \tabularnewline
M3 & 0.100167792517370 & 0.33747 & 0.2968 & 0.767912 & 0.383956 \tabularnewline
M4 & 0.030898108501924 & 0.338675 & 0.0912 & 0.927696 & 0.463848 \tabularnewline
M5 & 0.0298250769034686 & 0.338534 & 0.0881 & 0.930171 & 0.465086 \tabularnewline
M6 & 0.0420940478609984 & 0.337912 & 0.1246 & 0.901394 & 0.450697 \tabularnewline
M7 & -0.0144410418223971 & 0.336924 & -0.0429 & 0.965994 & 0.482997 \tabularnewline
M8 & 0.0759016737915046 & 0.336508 & 0.2256 & 0.822524 & 0.411262 \tabularnewline
M9 & 0.0587071605482621 & 0.33644 & 0.1745 & 0.862226 & 0.431113 \tabularnewline
M10 & 0.0152682578996135 & 0.336438 & 0.0454 & 0.963995 & 0.481997 \tabularnewline
M11 & 0.0812928394517373 & 0.33644 & 0.2416 & 0.810121 & 0.40506 \tabularnewline
\hline
\end{tabular}
%Source: https://freestatistics.org/blog/index.php?pk=25658&T=2

[TABLE]
[ROW][C]Multiple Linear Regression - Ordinary Least Squares[/C][/ROW]
[ROW][C]Variable[/C][C]Parameter[/C][C]S.D.[/C][C]T-STATH0: parameter = 0[/C][C]2-tail p-value[/C][C]1-tail p-value[/C][/ROW]
[ROW][C](Intercept)[/C][C]1.42011577718145[/C][C]0.244267[/C][C]5.8138[/C][C]1e-06[/C][C]0[/C][/ROW]
[ROW][C]Inflatie_energiedragers[/C][C]0.118293552509654[/C][C]0.007805[/C][C]15.1555[/C][C]0[/C][C]0[/C][/ROW]
[ROW][C]M1[/C][C]0.157168505575281[/C][C]0.33703[/C][C]0.4663[/C][C]0.643131[/C][C]0.321566[/C][/ROW]
[ROW][C]M2[/C][C]0.0388749530656324[/C][C]0.337583[/C][C]0.1152[/C][C]0.908811[/C][C]0.454406[/C][/ROW]
[ROW][C]M3[/C][C]0.100167792517370[/C][C]0.33747[/C][C]0.2968[/C][C]0.767912[/C][C]0.383956[/C][/ROW]
[ROW][C]M4[/C][C]0.030898108501924[/C][C]0.338675[/C][C]0.0912[/C][C]0.927696[/C][C]0.463848[/C][/ROW]
[ROW][C]M5[/C][C]0.0298250769034686[/C][C]0.338534[/C][C]0.0881[/C][C]0.930171[/C][C]0.465086[/C][/ROW]
[ROW][C]M6[/C][C]0.0420940478609984[/C][C]0.337912[/C][C]0.1246[/C][C]0.901394[/C][C]0.450697[/C][/ROW]
[ROW][C]M7[/C][C]-0.0144410418223971[/C][C]0.336924[/C][C]-0.0429[/C][C]0.965994[/C][C]0.482997[/C][/ROW]
[ROW][C]M8[/C][C]0.0759016737915046[/C][C]0.336508[/C][C]0.2256[/C][C]0.822524[/C][C]0.411262[/C][/ROW]
[ROW][C]M9[/C][C]0.0587071605482621[/C][C]0.33644[/C][C]0.1745[/C][C]0.862226[/C][C]0.431113[/C][/ROW]
[ROW][C]M10[/C][C]0.0152682578996135[/C][C]0.336438[/C][C]0.0454[/C][C]0.963995[/C][C]0.481997[/C][/ROW]
[ROW][C]M11[/C][C]0.0812928394517373[/C][C]0.33644[/C][C]0.2416[/C][C]0.810121[/C][C]0.40506[/C][/ROW]
[/TABLE]
Source: https://freestatistics.org/blog/index.php?pk=25658&T=2

Globally Unique Identifier (entire table): ba.freestatistics.org/blog/index.php?pk=25658&T=2

As an alternative you can also use a QR Code:  

The GUIDs for individual cells are displayed in the table below:

Multiple Linear Regression - Ordinary Least Squares
VariableParameterS.D.T-STATH0: parameter = 02-tail p-value1-tail p-value
(Intercept)1.420115777181450.2442675.81381e-060
Inflatie_energiedragers0.1182935525096540.00780515.155500
M10.1571685055752810.337030.46630.6431310.321566
M20.03887495306563240.3375830.11520.9088110.454406
M30.1001677925173700.337470.29680.7679120.383956
M40.0308981085019240.3386750.09120.9276960.463848
M50.02982507690346860.3385340.08810.9301710.465086
M60.04209404786099840.3379120.12460.9013940.450697
M7-0.01444104182239710.336924-0.04290.9659940.482997
M80.07590167379150460.3365080.22560.8225240.411262
M90.05870716054826210.336440.17450.8622260.431113
M100.01526825789961350.3364380.04540.9639950.481997
M110.08129283945173730.336440.24160.8101210.40506


Multiple Linear Regression - Regression Statistics
Multiple R0.914661630495795
R-squared0.836605898301226
Adjusted R-squared0.794888255314305
F-TEST (value)20.0540068518136
F-TEST (DF numerator)12
F-TEST (DF denominator)47
p-value1.49880108324396e-14
Multiple Linear Regression - Residual Statistics
Residual Standard Deviation0.531954328560216
Sum Squared Residuals13.2998441606757

\begin{tabular}{lllllllll}
\hline
Multiple Linear Regression - Regression Statistics \tabularnewline
Multiple R & 0.914661630495795 \tabularnewline
R-squared & 0.836605898301226 \tabularnewline
Adjusted R-squared & 0.794888255314305 \tabularnewline
F-TEST (value) & 20.0540068518136 \tabularnewline
F-TEST (DF numerator) & 12 \tabularnewline
F-TEST (DF denominator) & 47 \tabularnewline
p-value & 1.49880108324396e-14 \tabularnewline
Multiple Linear Regression - Residual Statistics \tabularnewline
Residual Standard Deviation & 0.531954328560216 \tabularnewline
Sum Squared Residuals & 13.2998441606757 \tabularnewline
\hline
\end{tabular}
%Source: https://freestatistics.org/blog/index.php?pk=25658&T=3

[TABLE]
[ROW][C]Multiple Linear Regression - Regression Statistics[/C][/ROW]
[ROW][C]Multiple R[/C][C]0.914661630495795[/C][/ROW]
[ROW][C]R-squared[/C][C]0.836605898301226[/C][/ROW]
[ROW][C]Adjusted R-squared[/C][C]0.794888255314305[/C][/ROW]
[ROW][C]F-TEST (value)[/C][C]20.0540068518136[/C][/ROW]
[ROW][C]F-TEST (DF numerator)[/C][C]12[/C][/ROW]
[ROW][C]F-TEST (DF denominator)[/C][C]47[/C][/ROW]
[ROW][C]p-value[/C][C]1.49880108324396e-14[/C][/ROW]
[ROW][C]Multiple Linear Regression - Residual Statistics[/C][/ROW]
[ROW][C]Residual Standard Deviation[/C][C]0.531954328560216[/C][/ROW]
[ROW][C]Sum Squared Residuals[/C][C]13.2998441606757[/C][/ROW]
[/TABLE]
Source: https://freestatistics.org/blog/index.php?pk=25658&T=3

Globally Unique Identifier (entire table): ba.freestatistics.org/blog/index.php?pk=25658&T=3

As an alternative you can also use a QR Code:  

The GUIDs for individual cells are displayed in the table below:

Multiple Linear Regression - Regression Statistics
Multiple R0.914661630495795
R-squared0.836605898301226
Adjusted R-squared0.794888255314305
F-TEST (value)20.0540068518136
F-TEST (DF numerator)12
F-TEST (DF denominator)47
p-value1.49880108324396e-14
Multiple Linear Regression - Residual Statistics
Residual Standard Deviation0.531954328560216
Sum Squared Residuals13.2998441606757


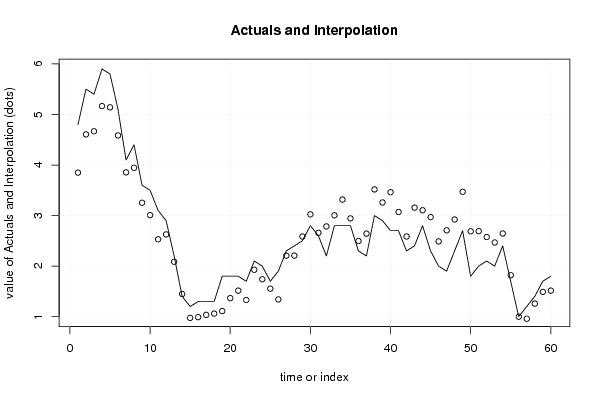
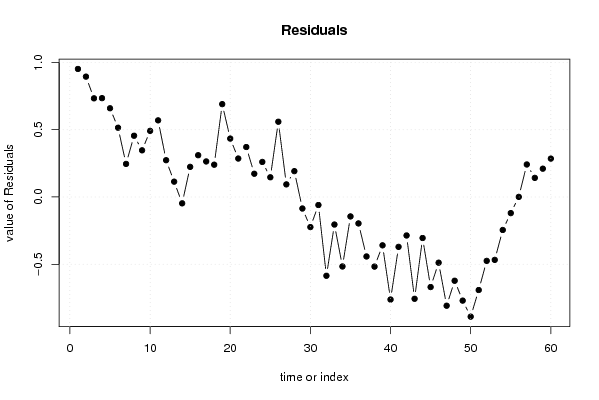
Multiple Linear Regression - Actuals, Interpolation, and Residuals
Time or IndexActualsInterpolationForecastResidualsPrediction Error
14.83.848520490942120.951479509057882
25.54.605599227003880.894400772996119
35.44.666892066455620.733107933544381
45.95.165431434486510.734568565513489
55.85.140699692386130.659300307613875
65.14.585159611297320.514840388702683
74.13.854351272308890.245648727691105
84.43.94469398792280.455306012077204
93.63.253226225374530.346773774625473
103.53.008688283459470.491311716540533
113.12.530562523467180.569437476532816
122.92.626710012779930.273289987220073
132.22.085946558548250.11405344145175
141.41.44716137499613-0.0471613749961258
151.20.976133228154420.223866771845579
161.30.9896690308957330.310330969104267
171.31.035913420301140.264086579698862
181.31.060011746509630.239988253490367
191.81.109940854084930.690059145915074
201.81.365894543212340.434105456787656
211.81.514311003482620.285688996517383
221.71.328919837822380.371080162177617
232.11.927265405667950.172734594332051
2421.739508368957520.260491631042477
251.71.553625572254810.146374427745192
261.91.340697177737440.559302822262563
272.32.206386174254820.09361382574518
282.42.208092621745170.191907378254833
292.52.58555895817760-0.0855589581776032
302.83.02368471816989-0.223684718169887
312.62.65958639196139-0.0595863919613912
322.22.78541717332819-0.585417173328189
332.83.00480976510425-0.204809765104254
342.83.31625151998457-0.516251519984567
352.82.94458995725097-0.144589957250972
362.32.49658710501931-0.196587105019308
372.22.64192625534362-0.441926255343623
3833.51729854391507-0.517298543915066
392.93.25919879159074-0.359198791590739
402.73.4620042783475-0.762004278347497
412.73.07056252346718-0.370562523467184
422.32.58599857388417-0.285998573884168
432.43.15641931250194-0.756419312501937
442.83.10480976510425-0.304809765104255
452.32.96932169935136-0.669321699351358
4622.48819665241699-0.48819665241699
471.92.70800285223166-0.808002852231664
482.32.92244389405406-0.622443894054062
492.73.4699811229112-0.7699811229112
501.82.68924367634749-0.88924367634749
5122.6913897395444-0.691389739544401
522.12.57480263452509-0.474802634525093
5322.46726540566795-0.46726540566795
542.42.64514535013899-0.245145350138995
551.71.81970216914285-0.119702169142850
5610.9991845304324170.00081546956758323
571.20.9583313066872430.241668693312756
581.41.257943706316590.142056293683409
591.71.489579261382230.210420738617770
601.81.514750619189180.285249380810819

\begin{tabular}{lllllllll}
\hline
Multiple Linear Regression - Actuals, Interpolation, and Residuals \tabularnewline
Time or Index & Actuals & InterpolationForecast & ResidualsPrediction Error \tabularnewline
1 & 4.8 & 3.84852049094212 & 0.951479509057882 \tabularnewline
2 & 5.5 & 4.60559922700388 & 0.894400772996119 \tabularnewline
3 & 5.4 & 4.66689206645562 & 0.733107933544381 \tabularnewline
4 & 5.9 & 5.16543143448651 & 0.734568565513489 \tabularnewline
5 & 5.8 & 5.14069969238613 & 0.659300307613875 \tabularnewline
6 & 5.1 & 4.58515961129732 & 0.514840388702683 \tabularnewline
7 & 4.1 & 3.85435127230889 & 0.245648727691105 \tabularnewline
8 & 4.4 & 3.9446939879228 & 0.455306012077204 \tabularnewline
9 & 3.6 & 3.25322622537453 & 0.346773774625473 \tabularnewline
10 & 3.5 & 3.00868828345947 & 0.491311716540533 \tabularnewline
11 & 3.1 & 2.53056252346718 & 0.569437476532816 \tabularnewline
12 & 2.9 & 2.62671001277993 & 0.273289987220073 \tabularnewline
13 & 2.2 & 2.08594655854825 & 0.11405344145175 \tabularnewline
14 & 1.4 & 1.44716137499613 & -0.0471613749961258 \tabularnewline
15 & 1.2 & 0.97613322815442 & 0.223866771845579 \tabularnewline
16 & 1.3 & 0.989669030895733 & 0.310330969104267 \tabularnewline
17 & 1.3 & 1.03591342030114 & 0.264086579698862 \tabularnewline
18 & 1.3 & 1.06001174650963 & 0.239988253490367 \tabularnewline
19 & 1.8 & 1.10994085408493 & 0.690059145915074 \tabularnewline
20 & 1.8 & 1.36589454321234 & 0.434105456787656 \tabularnewline
21 & 1.8 & 1.51431100348262 & 0.285688996517383 \tabularnewline
22 & 1.7 & 1.32891983782238 & 0.371080162177617 \tabularnewline
23 & 2.1 & 1.92726540566795 & 0.172734594332051 \tabularnewline
24 & 2 & 1.73950836895752 & 0.260491631042477 \tabularnewline
25 & 1.7 & 1.55362557225481 & 0.146374427745192 \tabularnewline
26 & 1.9 & 1.34069717773744 & 0.559302822262563 \tabularnewline
27 & 2.3 & 2.20638617425482 & 0.09361382574518 \tabularnewline
28 & 2.4 & 2.20809262174517 & 0.191907378254833 \tabularnewline
29 & 2.5 & 2.58555895817760 & -0.0855589581776032 \tabularnewline
30 & 2.8 & 3.02368471816989 & -0.223684718169887 \tabularnewline
31 & 2.6 & 2.65958639196139 & -0.0595863919613912 \tabularnewline
32 & 2.2 & 2.78541717332819 & -0.585417173328189 \tabularnewline
33 & 2.8 & 3.00480976510425 & -0.204809765104254 \tabularnewline
34 & 2.8 & 3.31625151998457 & -0.516251519984567 \tabularnewline
35 & 2.8 & 2.94458995725097 & -0.144589957250972 \tabularnewline
36 & 2.3 & 2.49658710501931 & -0.196587105019308 \tabularnewline
37 & 2.2 & 2.64192625534362 & -0.441926255343623 \tabularnewline
38 & 3 & 3.51729854391507 & -0.517298543915066 \tabularnewline
39 & 2.9 & 3.25919879159074 & -0.359198791590739 \tabularnewline
40 & 2.7 & 3.4620042783475 & -0.762004278347497 \tabularnewline
41 & 2.7 & 3.07056252346718 & -0.370562523467184 \tabularnewline
42 & 2.3 & 2.58599857388417 & -0.285998573884168 \tabularnewline
43 & 2.4 & 3.15641931250194 & -0.756419312501937 \tabularnewline
44 & 2.8 & 3.10480976510425 & -0.304809765104255 \tabularnewline
45 & 2.3 & 2.96932169935136 & -0.669321699351358 \tabularnewline
46 & 2 & 2.48819665241699 & -0.48819665241699 \tabularnewline
47 & 1.9 & 2.70800285223166 & -0.808002852231664 \tabularnewline
48 & 2.3 & 2.92244389405406 & -0.622443894054062 \tabularnewline
49 & 2.7 & 3.4699811229112 & -0.7699811229112 \tabularnewline
50 & 1.8 & 2.68924367634749 & -0.88924367634749 \tabularnewline
51 & 2 & 2.6913897395444 & -0.691389739544401 \tabularnewline
52 & 2.1 & 2.57480263452509 & -0.474802634525093 \tabularnewline
53 & 2 & 2.46726540566795 & -0.46726540566795 \tabularnewline
54 & 2.4 & 2.64514535013899 & -0.245145350138995 \tabularnewline
55 & 1.7 & 1.81970216914285 & -0.119702169142850 \tabularnewline
56 & 1 & 0.999184530432417 & 0.00081546956758323 \tabularnewline
57 & 1.2 & 0.958331306687243 & 0.241668693312756 \tabularnewline
58 & 1.4 & 1.25794370631659 & 0.142056293683409 \tabularnewline
59 & 1.7 & 1.48957926138223 & 0.210420738617770 \tabularnewline
60 & 1.8 & 1.51475061918918 & 0.285249380810819 \tabularnewline
\hline
\end{tabular}
%Source: https://freestatistics.org/blog/index.php?pk=25658&T=4

[TABLE]
[ROW][C]Multiple Linear Regression - Actuals, Interpolation, and Residuals[/C][/ROW]
[ROW][C]Time or Index[/C][C]Actuals[/C][C]InterpolationForecast[/C][C]ResidualsPrediction Error[/C][/ROW]
[ROW][C]1[/C][C]4.8[/C][C]3.84852049094212[/C][C]0.951479509057882[/C][/ROW]
[ROW][C]2[/C][C]5.5[/C][C]4.60559922700388[/C][C]0.894400772996119[/C][/ROW]
[ROW][C]3[/C][C]5.4[/C][C]4.66689206645562[/C][C]0.733107933544381[/C][/ROW]
[ROW][C]4[/C][C]5.9[/C][C]5.16543143448651[/C][C]0.734568565513489[/C][/ROW]
[ROW][C]5[/C][C]5.8[/C][C]5.14069969238613[/C][C]0.659300307613875[/C][/ROW]
[ROW][C]6[/C][C]5.1[/C][C]4.58515961129732[/C][C]0.514840388702683[/C][/ROW]
[ROW][C]7[/C][C]4.1[/C][C]3.85435127230889[/C][C]0.245648727691105[/C][/ROW]
[ROW][C]8[/C][C]4.4[/C][C]3.9446939879228[/C][C]0.455306012077204[/C][/ROW]
[ROW][C]9[/C][C]3.6[/C][C]3.25322622537453[/C][C]0.346773774625473[/C][/ROW]
[ROW][C]10[/C][C]3.5[/C][C]3.00868828345947[/C][C]0.491311716540533[/C][/ROW]
[ROW][C]11[/C][C]3.1[/C][C]2.53056252346718[/C][C]0.569437476532816[/C][/ROW]
[ROW][C]12[/C][C]2.9[/C][C]2.62671001277993[/C][C]0.273289987220073[/C][/ROW]
[ROW][C]13[/C][C]2.2[/C][C]2.08594655854825[/C][C]0.11405344145175[/C][/ROW]
[ROW][C]14[/C][C]1.4[/C][C]1.44716137499613[/C][C]-0.0471613749961258[/C][/ROW]
[ROW][C]15[/C][C]1.2[/C][C]0.97613322815442[/C][C]0.223866771845579[/C][/ROW]
[ROW][C]16[/C][C]1.3[/C][C]0.989669030895733[/C][C]0.310330969104267[/C][/ROW]
[ROW][C]17[/C][C]1.3[/C][C]1.03591342030114[/C][C]0.264086579698862[/C][/ROW]
[ROW][C]18[/C][C]1.3[/C][C]1.06001174650963[/C][C]0.239988253490367[/C][/ROW]
[ROW][C]19[/C][C]1.8[/C][C]1.10994085408493[/C][C]0.690059145915074[/C][/ROW]
[ROW][C]20[/C][C]1.8[/C][C]1.36589454321234[/C][C]0.434105456787656[/C][/ROW]
[ROW][C]21[/C][C]1.8[/C][C]1.51431100348262[/C][C]0.285688996517383[/C][/ROW]
[ROW][C]22[/C][C]1.7[/C][C]1.32891983782238[/C][C]0.371080162177617[/C][/ROW]
[ROW][C]23[/C][C]2.1[/C][C]1.92726540566795[/C][C]0.172734594332051[/C][/ROW]
[ROW][C]24[/C][C]2[/C][C]1.73950836895752[/C][C]0.260491631042477[/C][/ROW]
[ROW][C]25[/C][C]1.7[/C][C]1.55362557225481[/C][C]0.146374427745192[/C][/ROW]
[ROW][C]26[/C][C]1.9[/C][C]1.34069717773744[/C][C]0.559302822262563[/C][/ROW]
[ROW][C]27[/C][C]2.3[/C][C]2.20638617425482[/C][C]0.09361382574518[/C][/ROW]
[ROW][C]28[/C][C]2.4[/C][C]2.20809262174517[/C][C]0.191907378254833[/C][/ROW]
[ROW][C]29[/C][C]2.5[/C][C]2.58555895817760[/C][C]-0.0855589581776032[/C][/ROW]
[ROW][C]30[/C][C]2.8[/C][C]3.02368471816989[/C][C]-0.223684718169887[/C][/ROW]
[ROW][C]31[/C][C]2.6[/C][C]2.65958639196139[/C][C]-0.0595863919613912[/C][/ROW]
[ROW][C]32[/C][C]2.2[/C][C]2.78541717332819[/C][C]-0.585417173328189[/C][/ROW]
[ROW][C]33[/C][C]2.8[/C][C]3.00480976510425[/C][C]-0.204809765104254[/C][/ROW]
[ROW][C]34[/C][C]2.8[/C][C]3.31625151998457[/C][C]-0.516251519984567[/C][/ROW]
[ROW][C]35[/C][C]2.8[/C][C]2.94458995725097[/C][C]-0.144589957250972[/C][/ROW]
[ROW][C]36[/C][C]2.3[/C][C]2.49658710501931[/C][C]-0.196587105019308[/C][/ROW]
[ROW][C]37[/C][C]2.2[/C][C]2.64192625534362[/C][C]-0.441926255343623[/C][/ROW]
[ROW][C]38[/C][C]3[/C][C]3.51729854391507[/C][C]-0.517298543915066[/C][/ROW]
[ROW][C]39[/C][C]2.9[/C][C]3.25919879159074[/C][C]-0.359198791590739[/C][/ROW]
[ROW][C]40[/C][C]2.7[/C][C]3.4620042783475[/C][C]-0.762004278347497[/C][/ROW]
[ROW][C]41[/C][C]2.7[/C][C]3.07056252346718[/C][C]-0.370562523467184[/C][/ROW]
[ROW][C]42[/C][C]2.3[/C][C]2.58599857388417[/C][C]-0.285998573884168[/C][/ROW]
[ROW][C]43[/C][C]2.4[/C][C]3.15641931250194[/C][C]-0.756419312501937[/C][/ROW]
[ROW][C]44[/C][C]2.8[/C][C]3.10480976510425[/C][C]-0.304809765104255[/C][/ROW]
[ROW][C]45[/C][C]2.3[/C][C]2.96932169935136[/C][C]-0.669321699351358[/C][/ROW]
[ROW][C]46[/C][C]2[/C][C]2.48819665241699[/C][C]-0.48819665241699[/C][/ROW]
[ROW][C]47[/C][C]1.9[/C][C]2.70800285223166[/C][C]-0.808002852231664[/C][/ROW]
[ROW][C]48[/C][C]2.3[/C][C]2.92244389405406[/C][C]-0.622443894054062[/C][/ROW]
[ROW][C]49[/C][C]2.7[/C][C]3.4699811229112[/C][C]-0.7699811229112[/C][/ROW]
[ROW][C]50[/C][C]1.8[/C][C]2.68924367634749[/C][C]-0.88924367634749[/C][/ROW]
[ROW][C]51[/C][C]2[/C][C]2.6913897395444[/C][C]-0.691389739544401[/C][/ROW]
[ROW][C]52[/C][C]2.1[/C][C]2.57480263452509[/C][C]-0.474802634525093[/C][/ROW]
[ROW][C]53[/C][C]2[/C][C]2.46726540566795[/C][C]-0.46726540566795[/C][/ROW]
[ROW][C]54[/C][C]2.4[/C][C]2.64514535013899[/C][C]-0.245145350138995[/C][/ROW]
[ROW][C]55[/C][C]1.7[/C][C]1.81970216914285[/C][C]-0.119702169142850[/C][/ROW]
[ROW][C]56[/C][C]1[/C][C]0.999184530432417[/C][C]0.00081546956758323[/C][/ROW]
[ROW][C]57[/C][C]1.2[/C][C]0.958331306687243[/C][C]0.241668693312756[/C][/ROW]
[ROW][C]58[/C][C]1.4[/C][C]1.25794370631659[/C][C]0.142056293683409[/C][/ROW]
[ROW][C]59[/C][C]1.7[/C][C]1.48957926138223[/C][C]0.210420738617770[/C][/ROW]
[ROW][C]60[/C][C]1.8[/C][C]1.51475061918918[/C][C]0.285249380810819[/C][/ROW]
[/TABLE]
Source: https://freestatistics.org/blog/index.php?pk=25658&T=4

Globally Unique Identifier (entire table): ba.freestatistics.org/blog/index.php?pk=25658&T=4

As an alternative you can also use a QR Code:  

The GUIDs for individual cells are displayed in the table below:

Multiple Linear Regression - Actuals, Interpolation, and Residuals
Time or IndexActualsInterpolationForecastResidualsPrediction Error
14.83.848520490942120.951479509057882
25.54.605599227003880.894400772996119
35.44.666892066455620.733107933544381
45.95.165431434486510.734568565513489
55.85.140699692386130.659300307613875
65.14.585159611297320.514840388702683
74.13.854351272308890.245648727691105
84.43.94469398792280.455306012077204
93.63.253226225374530.346773774625473
103.53.008688283459470.491311716540533
113.12.530562523467180.569437476532816
122.92.626710012779930.273289987220073
132.22.085946558548250.11405344145175
141.41.44716137499613-0.0471613749961258
151.20.976133228154420.223866771845579
161.30.9896690308957330.310330969104267
171.31.035913420301140.264086579698862
181.31.060011746509630.239988253490367
191.81.109940854084930.690059145915074
201.81.365894543212340.434105456787656
211.81.514311003482620.285688996517383
221.71.328919837822380.371080162177617
232.11.927265405667950.172734594332051
2421.739508368957520.260491631042477
251.71.553625572254810.146374427745192
261.91.340697177737440.559302822262563
272.32.206386174254820.09361382574518
282.42.208092621745170.191907378254833
292.52.58555895817760-0.0855589581776032
302.83.02368471816989-0.223684718169887
312.62.65958639196139-0.0595863919613912
322.22.78541717332819-0.585417173328189
332.83.00480976510425-0.204809765104254
342.83.31625151998457-0.516251519984567
352.82.94458995725097-0.144589957250972
362.32.49658710501931-0.196587105019308
372.22.64192625534362-0.441926255343623
3833.51729854391507-0.517298543915066
392.93.25919879159074-0.359198791590739
402.73.4620042783475-0.762004278347497
412.73.07056252346718-0.370562523467184
422.32.58599857388417-0.285998573884168
432.43.15641931250194-0.756419312501937
442.83.10480976510425-0.304809765104255
452.32.96932169935136-0.669321699351358
4622.48819665241699-0.48819665241699
471.92.70800285223166-0.808002852231664
482.32.92244389405406-0.622443894054062
492.73.4699811229112-0.7699811229112
501.82.68924367634749-0.88924367634749
5122.6913897395444-0.691389739544401
522.12.57480263452509-0.474802634525093
5322.46726540566795-0.46726540566795
542.42.64514535013899-0.245145350138995
551.71.81970216914285-0.119702169142850
5610.9991845304324170.00081546956758323
571.20.9583313066872430.241668693312756
581.41.257943706316590.142056293683409
591.71.489579261382230.210420738617770
601.81.514750619189180.285249380810819


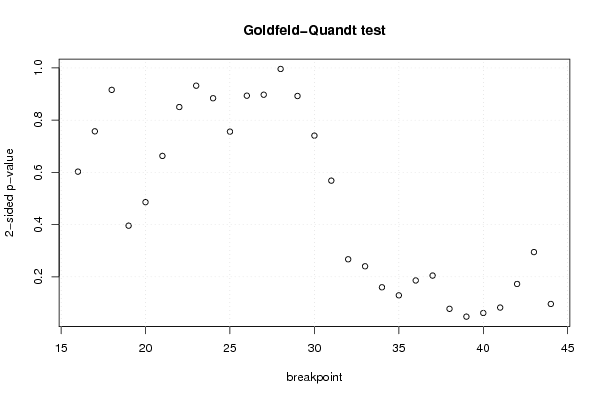
Goldfeld-Quandt test for Heteroskedasticity
p-valuesAlternative Hypothesis
breakpoint indexgreater2-sidedless
160.6986166959121730.6027666081756540.301383304087827
170.6213910214233440.7572179571533130.378608978576656
180.5420208088827080.9159583822345840.457979191117292
190.8020344729668980.3959310540662040.197965527033102
200.757030583039650.4859388339206990.242969416960350
210.6684734933514290.6630530132971420.331526506648571
220.5749274536322750.8501450927354490.425072546367725
230.5340147371176720.9319705257646570.465985262882328
240.4419727720418280.8839455440836550.558027227958172
250.3779623332526120.7559246665052230.622037666747388
260.446832433655320.893664867310640.55316756634468
270.4486809646656240.8973619293312490.551319035334376
280.4980286092468410.9960572184936810.501971390753159
290.5537579483745880.8924841032508250.446242051625412
300.6296413203598880.7407173592802240.370358679640112
310.7158238076592710.5683523846814570.284176192340729
320.8663653691051110.2672692617897780.133634630894889
330.8797872445050230.2404255109899540.120212755494977
340.9199938931821650.1600122136356690.0800061068178347
350.9354008568219480.1291982863561040.0645991431780521
360.9069242626627090.1861514746745830.0930757373372913
370.897554341034530.2048913179309410.102445658965471
380.9612045484726540.0775909030546920.038795451527346
390.9762079436144210.04758411277115750.0237920563855787
400.9691803559276940.06163928814461280.0308196440723064
410.9588149064092890.08237018718142230.0411850935907111
420.9136305290377280.1727389419245450.0863694709622724
430.8525456816624230.2949086366751540.147454318337577
440.9519018630021570.09619627399568520.0480981369978426

\begin{tabular}{lllllllll}
\hline
Goldfeld-Quandt test for Heteroskedasticity \tabularnewline
p-values & Alternative Hypothesis \tabularnewline
breakpoint index & greater & 2-sided & less \tabularnewline
16 & 0.698616695912173 & 0.602766608175654 & 0.301383304087827 \tabularnewline
17 & 0.621391021423344 & 0.757217957153313 & 0.378608978576656 \tabularnewline
18 & 0.542020808882708 & 0.915958382234584 & 0.457979191117292 \tabularnewline
19 & 0.802034472966898 & 0.395931054066204 & 0.197965527033102 \tabularnewline
20 & 0.75703058303965 & 0.485938833920699 & 0.242969416960350 \tabularnewline
21 & 0.668473493351429 & 0.663053013297142 & 0.331526506648571 \tabularnewline
22 & 0.574927453632275 & 0.850145092735449 & 0.425072546367725 \tabularnewline
23 & 0.534014737117672 & 0.931970525764657 & 0.465985262882328 \tabularnewline
24 & 0.441972772041828 & 0.883945544083655 & 0.558027227958172 \tabularnewline
25 & 0.377962333252612 & 0.755924666505223 & 0.622037666747388 \tabularnewline
26 & 0.44683243365532 & 0.89366486731064 & 0.55316756634468 \tabularnewline
27 & 0.448680964665624 & 0.897361929331249 & 0.551319035334376 \tabularnewline
28 & 0.498028609246841 & 0.996057218493681 & 0.501971390753159 \tabularnewline
29 & 0.553757948374588 & 0.892484103250825 & 0.446242051625412 \tabularnewline
30 & 0.629641320359888 & 0.740717359280224 & 0.370358679640112 \tabularnewline
31 & 0.715823807659271 & 0.568352384681457 & 0.284176192340729 \tabularnewline
32 & 0.866365369105111 & 0.267269261789778 & 0.133634630894889 \tabularnewline
33 & 0.879787244505023 & 0.240425510989954 & 0.120212755494977 \tabularnewline
34 & 0.919993893182165 & 0.160012213635669 & 0.0800061068178347 \tabularnewline
35 & 0.935400856821948 & 0.129198286356104 & 0.0645991431780521 \tabularnewline
36 & 0.906924262662709 & 0.186151474674583 & 0.0930757373372913 \tabularnewline
37 & 0.89755434103453 & 0.204891317930941 & 0.102445658965471 \tabularnewline
38 & 0.961204548472654 & 0.077590903054692 & 0.038795451527346 \tabularnewline
39 & 0.976207943614421 & 0.0475841127711575 & 0.0237920563855787 \tabularnewline
40 & 0.969180355927694 & 0.0616392881446128 & 0.0308196440723064 \tabularnewline
41 & 0.958814906409289 & 0.0823701871814223 & 0.0411850935907111 \tabularnewline
42 & 0.913630529037728 & 0.172738941924545 & 0.0863694709622724 \tabularnewline
43 & 0.852545681662423 & 0.294908636675154 & 0.147454318337577 \tabularnewline
44 & 0.951901863002157 & 0.0961962739956852 & 0.0480981369978426 \tabularnewline
\hline
\end{tabular}
%Source: https://freestatistics.org/blog/index.php?pk=25658&T=5

[TABLE]
[ROW][C]Goldfeld-Quandt test for Heteroskedasticity[/C][/ROW]
[ROW][C]p-values[/C][C]Alternative Hypothesis[/C][/ROW]
[ROW][C]breakpoint index[/C][C]greater[/C][C]2-sided[/C][C]less[/C][/ROW]
[ROW][C]16[/C][C]0.698616695912173[/C][C]0.602766608175654[/C][C]0.301383304087827[/C][/ROW]
[ROW][C]17[/C][C]0.621391021423344[/C][C]0.757217957153313[/C][C]0.378608978576656[/C][/ROW]
[ROW][C]18[/C][C]0.542020808882708[/C][C]0.915958382234584[/C][C]0.457979191117292[/C][/ROW]
[ROW][C]19[/C][C]0.802034472966898[/C][C]0.395931054066204[/C][C]0.197965527033102[/C][/ROW]
[ROW][C]20[/C][C]0.75703058303965[/C][C]0.485938833920699[/C][C]0.242969416960350[/C][/ROW]
[ROW][C]21[/C][C]0.668473493351429[/C][C]0.663053013297142[/C][C]0.331526506648571[/C][/ROW]
[ROW][C]22[/C][C]0.574927453632275[/C][C]0.850145092735449[/C][C]0.425072546367725[/C][/ROW]
[ROW][C]23[/C][C]0.534014737117672[/C][C]0.931970525764657[/C][C]0.465985262882328[/C][/ROW]
[ROW][C]24[/C][C]0.441972772041828[/C][C]0.883945544083655[/C][C]0.558027227958172[/C][/ROW]
[ROW][C]25[/C][C]0.377962333252612[/C][C]0.755924666505223[/C][C]0.622037666747388[/C][/ROW]
[ROW][C]26[/C][C]0.44683243365532[/C][C]0.89366486731064[/C][C]0.55316756634468[/C][/ROW]
[ROW][C]27[/C][C]0.448680964665624[/C][C]0.897361929331249[/C][C]0.551319035334376[/C][/ROW]
[ROW][C]28[/C][C]0.498028609246841[/C][C]0.996057218493681[/C][C]0.501971390753159[/C][/ROW]
[ROW][C]29[/C][C]0.553757948374588[/C][C]0.892484103250825[/C][C]0.446242051625412[/C][/ROW]
[ROW][C]30[/C][C]0.629641320359888[/C][C]0.740717359280224[/C][C]0.370358679640112[/C][/ROW]
[ROW][C]31[/C][C]0.715823807659271[/C][C]0.568352384681457[/C][C]0.284176192340729[/C][/ROW]
[ROW][C]32[/C][C]0.866365369105111[/C][C]0.267269261789778[/C][C]0.133634630894889[/C][/ROW]
[ROW][C]33[/C][C]0.879787244505023[/C][C]0.240425510989954[/C][C]0.120212755494977[/C][/ROW]
[ROW][C]34[/C][C]0.919993893182165[/C][C]0.160012213635669[/C][C]0.0800061068178347[/C][/ROW]
[ROW][C]35[/C][C]0.935400856821948[/C][C]0.129198286356104[/C][C]0.0645991431780521[/C][/ROW]
[ROW][C]36[/C][C]0.906924262662709[/C][C]0.186151474674583[/C][C]0.0930757373372913[/C][/ROW]
[ROW][C]37[/C][C]0.89755434103453[/C][C]0.204891317930941[/C][C]0.102445658965471[/C][/ROW]
[ROW][C]38[/C][C]0.961204548472654[/C][C]0.077590903054692[/C][C]0.038795451527346[/C][/ROW]
[ROW][C]39[/C][C]0.976207943614421[/C][C]0.0475841127711575[/C][C]0.0237920563855787[/C][/ROW]
[ROW][C]40[/C][C]0.969180355927694[/C][C]0.0616392881446128[/C][C]0.0308196440723064[/C][/ROW]
[ROW][C]41[/C][C]0.958814906409289[/C][C]0.0823701871814223[/C][C]0.0411850935907111[/C][/ROW]
[ROW][C]42[/C][C]0.913630529037728[/C][C]0.172738941924545[/C][C]0.0863694709622724[/C][/ROW]
[ROW][C]43[/C][C]0.852545681662423[/C][C]0.294908636675154[/C][C]0.147454318337577[/C][/ROW]
[ROW][C]44[/C][C]0.951901863002157[/C][C]0.0961962739956852[/C][C]0.0480981369978426[/C][/ROW]
[/TABLE]
Source: https://freestatistics.org/blog/index.php?pk=25658&T=5

Globally Unique Identifier (entire table): ba.freestatistics.org/blog/index.php?pk=25658&T=5

As an alternative you can also use a QR Code:  

The GUIDs for individual cells are displayed in the table below:

Goldfeld-Quandt test for Heteroskedasticity
p-valuesAlternative Hypothesis
breakpoint indexgreater2-sidedless
160.6986166959121730.6027666081756540.301383304087827
170.6213910214233440.7572179571533130.378608978576656
180.5420208088827080.9159583822345840.457979191117292
190.8020344729668980.3959310540662040.197965527033102
200.757030583039650.4859388339206990.242969416960350
210.6684734933514290.6630530132971420.331526506648571
220.5749274536322750.8501450927354490.425072546367725
230.5340147371176720.9319705257646570.465985262882328
240.4419727720418280.8839455440836550.558027227958172
250.3779623332526120.7559246665052230.622037666747388
260.446832433655320.893664867310640.55316756634468
270.4486809646656240.8973619293312490.551319035334376
280.4980286092468410.9960572184936810.501971390753159
290.5537579483745880.8924841032508250.446242051625412
300.6296413203598880.7407173592802240.370358679640112
310.7158238076592710.5683523846814570.284176192340729
320.8663653691051110.2672692617897780.133634630894889
330.8797872445050230.2404255109899540.120212755494977
340.9199938931821650.1600122136356690.0800061068178347
350.9354008568219480.1291982863561040.0645991431780521
360.9069242626627090.1861514746745830.0930757373372913
370.897554341034530.2048913179309410.102445658965471
380.9612045484726540.0775909030546920.038795451527346
390.9762079436144210.04758411277115750.0237920563855787
400.9691803559276940.06163928814461280.0308196440723064
410.9588149064092890.08237018718142230.0411850935907111
420.9136305290377280.1727389419245450.0863694709622724
430.8525456816624230.2949086366751540.147454318337577
440.9519018630021570.09619627399568520.0480981369978426


Meta Analysis of Goldfeld-Quandt test for Heteroskedasticity
Description# significant tests% significant testsOK/NOK
1% type I error level00OK
5% type I error level10.0344827586206897OK
10% type I error level50.172413793103448NOK

\begin{tabular}{lllllllll}
\hline
Meta Analysis of Goldfeld-Quandt test for Heteroskedasticity \tabularnewline
Description & # significant tests & % significant tests & OK/NOK \tabularnewline
1% type I error level & 0 & 0 & OK \tabularnewline
5% type I error level & 1 & 0.0344827586206897 & OK \tabularnewline
10% type I error level & 5 & 0.172413793103448 & NOK \tabularnewline
\hline
\end{tabular}
%Source: https://freestatistics.org/blog/index.php?pk=25658&T=6

[TABLE]
[ROW][C]Meta Analysis of Goldfeld-Quandt test for Heteroskedasticity[/C][/ROW]
[ROW][C]Description[/C][C]# significant tests[/C][C]% significant tests[/C][C]OK/NOK[/C][/ROW]
[ROW][C]1% type I error level[/C][C]0[/C][C]0[/C][C]OK[/C][/ROW]
[ROW][C]5% type I error level[/C][C]1[/C][C]0.0344827586206897[/C][C]OK[/C][/ROW]
[ROW][C]10% type I error level[/C][C]5[/C][C]0.172413793103448[/C][C]NOK[/C][/ROW]
[/TABLE]
Source: https://freestatistics.org/blog/index.php?pk=25658&T=6

Globally Unique Identifier (entire table): ba.freestatistics.org/blog/index.php?pk=25658&T=6

As an alternative you can also use a QR Code:  

The GUIDs for individual cells are displayed in the table below:

Meta Analysis of Goldfeld-Quandt test for Heteroskedasticity
Description# significant tests% significant testsOK/NOK
1% type I error level00OK
5% type I error level10.0344827586206897OK
10% type I error level50.172413793103448NOK


Parameters (Session):
par1 = 1 ; par2 = Include Monthly Dummies ; par3 = No Linear Trend ;
Parameters (R input):
par1 = 1 ; par2 = Include Monthly Dummies ; par3 = No Linear Trend ;
R code (references can be found in the software module):
library(lattice)
library(lmtest)
n25 <- 25 #minimum number of obs. for Goldfeld-Quandt test
par1 <- as.numeric(par1)
x <- t(y)
k <- length(x[1,])
n <- length(x[,1])
x1 <- cbind(x[,par1], x[,1:k!=par1])
mycolnames <- c(colnames(x)[par1], colnames(x)[1:k!=par1])
colnames(x1) <- mycolnames #colnames(x)[par1]
x <- x1
if (par3 == 'First Differences'){
x2 <- array(0, dim=c(n-1,k), dimnames=list(1:(n-1), paste('(1-B)',colnames(x),sep='')))
for (i in 1:n-1) {
for (j in 1:k) {
x2[i,j] <- x[i+1,j] - x[i,j]
}
}
x <- x2
}
if (par2 == 'Include Monthly Dummies'){
x2 <- array(0, dim=c(n,11), dimnames=list(1:n, paste('M', seq(1:11), sep ='')))
for (i in 1:11){
x2[seq(i,n,12),i] <- 1
}
x <- cbind(x, x2)
}
if (par2 == 'Include Quarterly Dummies'){
x2 <- array(0, dim=c(n,3), dimnames=list(1:n, paste('Q', seq(1:3), sep ='')))
for (i in 1:3){
x2[seq(i,n,4),i] <- 1
}
x <- cbind(x, x2)
}
k <- length(x[1,])
if (par3 == 'Linear Trend'){
x <- cbind(x, c(1:n))
colnames(x)[k+1] <- 't'
}
x
k <- length(x[1,])
df <- as.data.frame(x)
(mylm <- lm(df))
(mysum <- summary(mylm))
if (n > n25) {
kp3 <- k + 3
nmkm3 <- n - k - 3
gqarr <- array(NA, dim=c(nmkm3-kp3+1,3))
numgqtests <- 0
numsignificant1 <- 0
numsignificant5 <- 0
numsignificant10 <- 0
for (mypoint in kp3:nmkm3) {
j <- 0
numgqtests <- numgqtests + 1
for (myalt in c('greater', 'two.sided', 'less')) {
j <- j + 1
gqarr[mypoint-kp3+1,j] <- gqtest(mylm, point=mypoint, alternative=myalt)$p.value
}
if (gqarr[mypoint-kp3+1,2] < 0.01) numsignificant1 <- numsignificant1 + 1
if (gqarr[mypoint-kp3+1,2] < 0.05) numsignificant5 <- numsignificant5 + 1
if (gqarr[mypoint-kp3+1,2] < 0.10) numsignificant10 <- numsignificant10 + 1
}
gqarr
}
bitmap(file='test0.png')
plot(x[,1], type='l', main='Actuals and Interpolation', ylab='value of Actuals and Interpolation (dots)', xlab='time or index')
points(x[,1]-mysum$resid)
grid()
dev.off()
bitmap(file='test1.png')
plot(mysum$resid, type='b', pch=19, main='Residuals', ylab='value of Residuals', xlab='time or index')
grid()
dev.off()
bitmap(file='test2.png')
hist(mysum$resid, main='Residual Histogram', xlab='values of Residuals')
grid()
dev.off()
bitmap(file='test3.png')
densityplot(~mysum$resid,col='black',main='Residual Density Plot', xlab='values of Residuals')
dev.off()
bitmap(file='test4.png')
qqnorm(mysum$resid, main='Residual Normal Q-Q Plot')
qqline(mysum$resid)
grid()
dev.off()
(myerror <- as.ts(mysum$resid))
bitmap(file='test5.png')
dum <- cbind(lag(myerror,k=1),myerror)
dum
dum1 <- dum[2:length(myerror),]
dum1
z <- as.data.frame(dum1)
z
plot(z,main=paste('Residual Lag plot, lowess, and regression line'), ylab='values of Residuals', xlab='lagged values of Residuals')
lines(lowess(z))
abline(lm(z))
grid()
dev.off()
bitmap(file='test6.png')
acf(mysum$resid, lag.max=length(mysum$resid)/2, main='Residual Autocorrelation Function')
grid()
dev.off()
bitmap(file='test7.png')
pacf(mysum$resid, lag.max=length(mysum$resid)/2, main='Residual Partial Autocorrelation Function')
grid()
dev.off()
bitmap(file='test8.png')
opar <- par(mfrow = c(2,2), oma = c(0, 0, 1.1, 0))
plot(mylm, las = 1, sub='Residual Diagnostics')
par(opar)
dev.off()
if (n > n25) {
bitmap(file='test9.png')
plot(kp3:nmkm3,gqarr[,2], main='Goldfeld-Quandt test',ylab='2-sided p-value',xlab='breakpoint')
grid()
dev.off()
}
load(file='createtable')
a<-table.start()
a<-table.row.start(a)
a<-table.element(a, 'Multiple Linear Regression - Estimated Regression Equation', 1, TRUE)
a<-table.row.end(a)
myeq <- colnames(x)[1]
myeq <- paste(myeq, '[t] = ', sep='')
for (i in 1:k){
if (mysum$coefficients[i,1] > 0) myeq <- paste(myeq, '+', '')
myeq <- paste(myeq, mysum$coefficients[i,1], sep=' ')
if (rownames(mysum$coefficients)[i] != '(Intercept)') {
myeq <- paste(myeq, rownames(mysum$coefficients)[i], sep='')
if (rownames(mysum$coefficients)[i] != 't') myeq <- paste(myeq, '[t]', sep='')
}
}
myeq <- paste(myeq, ' + e[t]')
a<-table.row.start(a)
a<-table.element(a, myeq)
a<-table.row.end(a)
a<-table.end(a)
table.save(a,file='mytable1.tab')
a<-table.start()
a<-table.row.start(a)
a<-table.element(a,hyperlink('ols1.htm','Multiple Linear Regression - Ordinary Least Squares',''), 6, TRUE)
a<-table.row.end(a)
a<-table.row.start(a)
a<-table.element(a,'Variable',header=TRUE)
a<-table.element(a,'Parameter',header=TRUE)
a<-table.element(a,'S.D.',header=TRUE)
a<-table.element(a,'T-STAT
H0: parameter = 0',header=TRUE)
a<-table.element(a,'2-tail p-value',header=TRUE)
a<-table.element(a,'1-tail p-value',header=TRUE)
a<-table.row.end(a)
for (i in 1:k){
a<-table.row.start(a)
a<-table.element(a,rownames(mysum$coefficients)[i],header=TRUE)
a<-table.element(a,mysum$coefficients[i,1])
a<-table.element(a, round(mysum$coefficients[i,2],6))
a<-table.element(a, round(mysum$coefficients[i,3],4))
a<-table.element(a, round(mysum$coefficients[i,4],6))
a<-table.element(a, round(mysum$coefficients[i,4]/2,6))
a<-table.row.end(a)
}
a<-table.end(a)
table.save(a,file='mytable2.tab')
a<-table.start()
a<-table.row.start(a)
a<-table.element(a, 'Multiple Linear Regression - Regression Statistics', 2, TRUE)
a<-table.row.end(a)
a<-table.row.start(a)
a<-table.element(a, 'Multiple R',1,TRUE)
a<-table.element(a, sqrt(mysum$r.squared))
a<-table.row.end(a)
a<-table.row.start(a)
a<-table.element(a, 'R-squared',1,TRUE)
a<-table.element(a, mysum$r.squared)
a<-table.row.end(a)
a<-table.row.start(a)
a<-table.element(a, 'Adjusted R-squared',1,TRUE)
a<-table.element(a, mysum$adj.r.squared)
a<-table.row.end(a)
a<-table.row.start(a)
a<-table.element(a, 'F-TEST (value)',1,TRUE)
a<-table.element(a, mysum$fstatistic[1])
a<-table.row.end(a)
a<-table.row.start(a)
a<-table.element(a, 'F-TEST (DF numerator)',1,TRUE)
a<-table.element(a, mysum$fstatistic[2])
a<-table.row.end(a)
a<-table.row.start(a)
a<-table.element(a, 'F-TEST (DF denominator)',1,TRUE)
a<-table.element(a, mysum$fstatistic[3])
a<-table.row.end(a)
a<-table.row.start(a)
a<-table.element(a, 'p-value',1,TRUE)
a<-table.element(a, 1-pf(mysum$fstatistic[1],mysum$fstatistic[2],mysum$fstatistic[3]))
a<-table.row.end(a)
a<-table.row.start(a)
a<-table.element(a, 'Multiple Linear Regression - Residual Statistics', 2, TRUE)
a<-table.row.end(a)
a<-table.row.start(a)
a<-table.element(a, 'Residual Standard Deviation',1,TRUE)
a<-table.element(a, mysum$sigma)
a<-table.row.end(a)
a<-table.row.start(a)
a<-table.element(a, 'Sum Squared Residuals',1,TRUE)
a<-table.element(a, sum(myerror*myerror))
a<-table.row.end(a)
a<-table.end(a)
table.save(a,file='mytable3.tab')
a<-table.start()
a<-table.row.start(a)
a<-table.element(a, 'Multiple Linear Regression - Actuals, Interpolation, and Residuals', 4, TRUE)
a<-table.row.end(a)
a<-table.row.start(a)
a<-table.element(a, 'Time or Index', 1, TRUE)
a<-table.element(a, 'Actuals', 1, TRUE)
a<-table.element(a, 'Interpolation
Forecast', 1, TRUE)
a<-table.element(a, 'Residuals
Prediction Error', 1, TRUE)
a<-table.row.end(a)
for (i in 1:n) {
a<-table.row.start(a)
a<-table.element(a,i, 1, TRUE)
a<-table.element(a,x[i])
a<-table.element(a,x[i]-mysum$resid[i])
a<-table.element(a,mysum$resid[i])
a<-table.row.end(a)
}
a<-table.end(a)
table.save(a,file='mytable4.tab')
if (n > n25) {
a<-table.start()
a<-table.row.start(a)
a<-table.element(a,'Goldfeld-Quandt test for Heteroskedasticity',4,TRUE)
a<-table.row.end(a)
a<-table.row.start(a)
a<-table.element(a,'p-values',header=TRUE)
a<-table.element(a,'Alternative Hypothesis',3,header=TRUE)
a<-table.row.end(a)
a<-table.row.start(a)
a<-table.element(a,'breakpoint index',header=TRUE)
a<-table.element(a,'greater',header=TRUE)
a<-table.element(a,'2-sided',header=TRUE)
a<-table.element(a,'less',header=TRUE)
a<-table.row.end(a)
for (mypoint in kp3:nmkm3) {
a<-table.row.start(a)
a<-table.element(a,mypoint,header=TRUE)
a<-table.element(a,gqarr[mypoint-kp3+1,1])
a<-table.element(a,gqarr[mypoint-kp3+1,2])
a<-table.element(a,gqarr[mypoint-kp3+1,3])
a<-table.row.end(a)
}
a<-table.end(a)
table.save(a,file='mytable5.tab')
a<-table.start()
a<-table.row.start(a)
a<-table.element(a,'Meta Analysis of Goldfeld-Quandt test for Heteroskedasticity',4,TRUE)
a<-table.row.end(a)
a<-table.row.start(a)
a<-table.element(a,'Description',header=TRUE)
a<-table.element(a,'# significant tests',header=TRUE)
a<-table.element(a,'% significant tests',header=TRUE)
a<-table.element(a,'OK/NOK',header=TRUE)
a<-table.row.end(a)
a<-table.row.start(a)
a<-table.element(a,'1% type I error level',header=TRUE)
a<-table.element(a,numsignificant1)
a<-table.element(a,numsignificant1/numgqtests)
if (numsignificant1/numgqtests < 0.01) dum <- 'OK' else dum <- 'NOK'
a<-table.element(a,dum)
a<-table.row.end(a)
a<-table.row.start(a)
a<-table.element(a,'5% type I error level',header=TRUE)
a<-table.element(a,numsignificant5)
a<-table.element(a,numsignificant5/numgqtests)
if (numsignificant5/numgqtests < 0.05) dum <- 'OK' else dum <- 'NOK'
a<-table.element(a,dum)
a<-table.row.end(a)
a<-table.row.start(a)
a<-table.element(a,'10% type I error level',header=TRUE)
a<-table.element(a,numsignificant10)
a<-table.element(a,numsignificant10/numgqtests)
if (numsignificant10/numgqtests < 0.1) dum <- 'OK' else dum <- 'NOK'
a<-table.element(a,dum)
a<-table.row.end(a)
a<-table.end(a)
table.save(a,file='mytable6.tab')
}