Free Statistics

of Irreproducible Research!

Author's title

Author*The author of this computation has been verified*
R Software Modulerwasp_multipleregression.wasp
Title produced by softwareMultiple Regression
Date of computationSun, 23 Nov 2008 13:23:12 -0700
Cite this page as followsStatistical Computations at FreeStatistics.org, Office for Research Development and Education, URL https://freestatistics.org/blog/index.php?v=date/2008/Nov/23/t12274718194i0nebkxt90ksk1.htm/, Retrieved Sun, 19 May 2024 10:43:39 +0000
Statistical Computations at FreeStatistics.org, Office for Research Development and Education, URL https://freestatistics.org/blog/index.php?pk=25338, Retrieved Sun, 19 May 2024 10:43:39 +0000
QR Codes:

Original text written by user:
IsPrivate?No (this computation is public)
User-defined keywords
Estimated Impact130
Family? (F = Feedback message, R = changed R code, M = changed R Module, P = changed Parameters, D = changed Data)
F       [Multiple Regression] [vraag 3] [2008-11-23 20:23:12] [3dc594a6c62226e1e98766c4d385bfaa] [Current]
- RMPD    [Central Tendency] [vraag 3] [2008-12-01 20:39:59] [c45c87b96bbf32ffc2144fc37d767b2e]
Feedback Forum
2008-11-29 12:35:35 [Jeroen Michel] [reply
Ook hier verwijs ik naar de analyse die je hebt gemaakt bij Q1. De conclusie die je hebt gemaakt voor je eigen tijdreeks is volledig en ook juist. Je toont de gevonden resultaten aan door grafische weergaves en tabellen.

Zie ook onderstaande link voor bijkomende feedback:

http://www.freestatistics.org/blog/date/2008/Nov/21/t12272726020eq37cysp0xq92b.htm
2008-12-01 20:46:14 [Michaël De Kuyer] [reply
- Het aantal werklozen zal dalen met 90, + of - 9 (dit is de standaardafwijking)
- Ik kon me ook nog afvragen of de effecten per maand toe te schrijven zijn aan het toeval. Hiervoor baseren we ons op de T-STAT. De nulhypothese houdt in dat het succes van dienstencheques geen effect heeft tenzij het tegendeel wordt bewezen. We gaan een eenzijdige toetsing doen want het succes van dienstencheques kan alleen maar de werkloosheid doen dalen. Aan de hand van de p-value zien we dat er zeer veel afwijkende waarden zijn. Hieruit kan ik concluderen dat het gunstig effect van het succes van dienstencheques op de daling van de werkloosheid gebaseerd kan zijn op toeval.
- Ook hier dient opgemerkt te worden dat het een deterministische trend is. De langetermijntrend zal niet steeds blijven stijgen. Het is dus niet realistisch.

-De analyse van vaste component had ik kunnen verbeteren door een analyse te doen van de residu's via central tendency: http://www.freestatistics.org/blog/date/2008/Dec/01/t1228164065xt6ipfnon56kqcs.htm Zo had ik kunnen vasstellen dat er wel een vaste component is. We kunnen immers, zowel bij de winsorized mean als de trimmed mean, een lullijn trekken zoander het betrouwbaarheidsinterval te overschrijden.
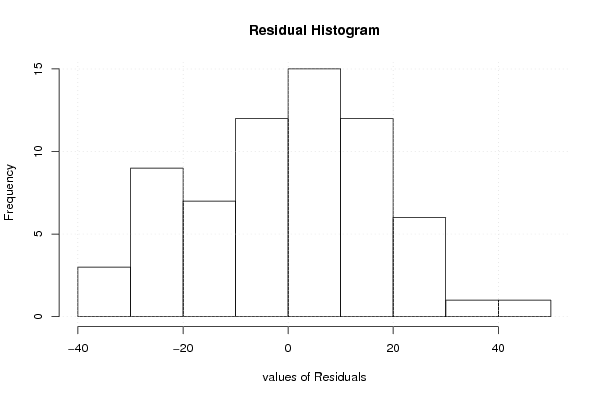
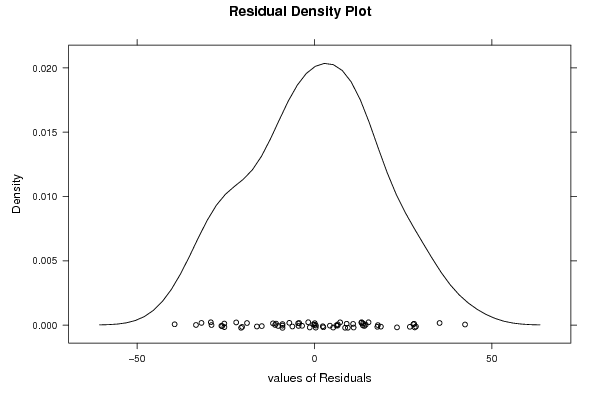
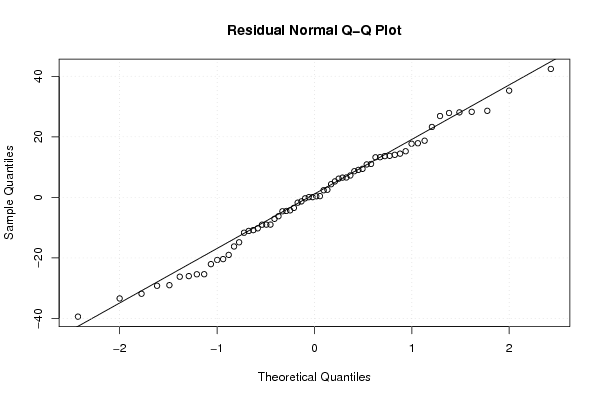
- De analyse van vaste verdeling is correct.
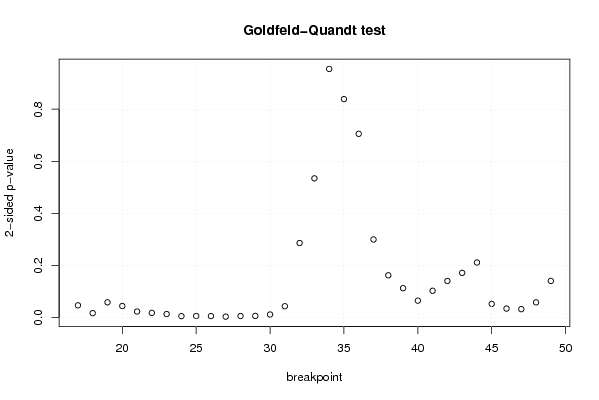
- De analyse van vaste variantie is gedeeltelijk correct. Ik had me niet moeten baseren op de Goldfeld-Quandt.
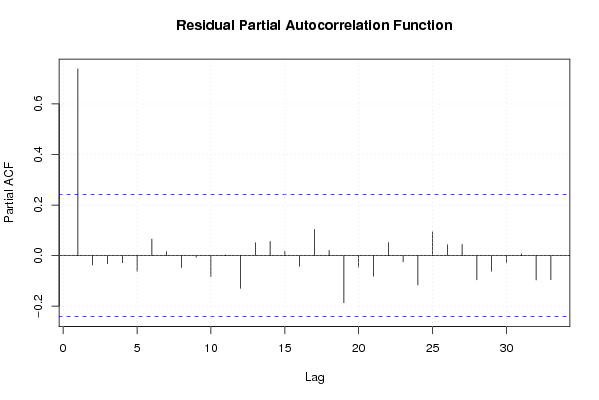
- Autocorrelatie had ik moeten controleren met de residual autocorrelation function. Zo had ik kunnen vaststellen dat er uit de autocorrelatie seizonaliteit blijkt. In het begin wordt het betrouwbaarheidsinterval overschreden.

Post a new message
Dataseries X:
519	0
517	0
510	0
509	0
501	0
507	0
569	0
580	0
578	0
565	0
547	0
555	0
562	0
561	0
555	0
544	0
537	0
543	0
594	0
611	0
613	0
611	0
594	0
595	0
591	0
589	0
584	0
573	0
567	0
569	0
621	0
629	0
628	0
612	0
595	0
597	0
593	0
590	0
580	0
574	0
573	0
573	0
620	0
626	0
620	0
588	0
566	0
557	0
561	1
549	1
532	1
526	1
511	1
499	1
555	1
565	1
542	1
527	1
510	1
514	1
517	1
508	1
493	1
490	1
469	1
478	1


Summary of computational transaction
Raw Inputview raw input (R code)
Raw Outputview raw output of R engine
Computing time4 seconds
R Server'George Udny Yule' @ 72.249.76.132

\begin{tabular}{lllllllll}
\hline
Summary of computational transaction \tabularnewline
Raw Input & view raw input (R code)  \tabularnewline
Raw Output & view raw output of R engine  \tabularnewline
Computing time & 4 seconds \tabularnewline
R Server & 'George Udny Yule' @ 72.249.76.132 \tabularnewline
\hline
\end{tabular}
%Source: https://freestatistics.org/blog/index.php?pk=25338&T=0

[TABLE]
[ROW][C]Summary of computational transaction[/C][/ROW]
[ROW][C]Raw Input[/C][C]view raw input (R code) [/C][/ROW]
[ROW][C]Raw Output[/C][C]view raw output of R engine [/C][/ROW]
[ROW][C]Computing time[/C][C]4 seconds[/C][/ROW]
[ROW][C]R Server[/C][C]'George Udny Yule' @ 72.249.76.132[/C][/ROW]
[/TABLE]
Source: https://freestatistics.org/blog/index.php?pk=25338&T=0

Globally Unique Identifier (entire table): ba.freestatistics.org/blog/index.php?pk=25338&T=0

As an alternative you can also use a QR Code:  

The GUIDs for individual cells are displayed in the table below:

Summary of computational transaction
Raw Inputview raw input (R code)
Raw Outputview raw output of R engine
Computing time4 seconds
R Server'George Udny Yule' @ 72.249.76.132


Multiple Linear Regression - Estimated Regression Equation
Aantal_werklozen[t] = + 537.846078431373 -90.8186274509804Dummyvariabele[t] + 11.7754901960784M1[t] + 5.72222222222224M2[t] -5.49771241830064M3[t] -13.0509803921569M4[t] -23.9375816993464M5[t] -23.3241830065359M6[t] + 34.2996732026144M7[t] + 43.4797385620915M8[t] + 36.2598039215686M9[t] + 19.4398692810458M10[t] + 0.0199346405228985M11[t] + 1.21993464052288t + e[t]

\begin{tabular}{lllllllll}
\hline
Multiple Linear Regression - Estimated Regression Equation \tabularnewline
Aantal_werklozen[t] =  +  537.846078431373 -90.8186274509804Dummyvariabele[t] +  11.7754901960784M1[t] +  5.72222222222224M2[t] -5.49771241830064M3[t] -13.0509803921569M4[t] -23.9375816993464M5[t] -23.3241830065359M6[t] +  34.2996732026144M7[t] +  43.4797385620915M8[t] +  36.2598039215686M9[t] +  19.4398692810458M10[t] +  0.0199346405228985M11[t] +  1.21993464052288t  + e[t] \tabularnewline
\hline
\end{tabular}
%Source: https://freestatistics.org/blog/index.php?pk=25338&T=1

[TABLE]
[ROW][C]Multiple Linear Regression - Estimated Regression Equation[/C][/ROW]
[ROW][C]Aantal_werklozen[t] =  +  537.846078431373 -90.8186274509804Dummyvariabele[t] +  11.7754901960784M1[t] +  5.72222222222224M2[t] -5.49771241830064M3[t] -13.0509803921569M4[t] -23.9375816993464M5[t] -23.3241830065359M6[t] +  34.2996732026144M7[t] +  43.4797385620915M8[t] +  36.2598039215686M9[t] +  19.4398692810458M10[t] +  0.0199346405228985M11[t] +  1.21993464052288t  + e[t][/C][/ROW]
[/TABLE]
Source: https://freestatistics.org/blog/index.php?pk=25338&T=1

Globally Unique Identifier (entire table): ba.freestatistics.org/blog/index.php?pk=25338&T=1

As an alternative you can also use a QR Code:  

The GUIDs for individual cells are displayed in the table below:

Multiple Linear Regression - Estimated Regression Equation
Aantal_werklozen[t] = + 537.846078431373 -90.8186274509804Dummyvariabele[t] + 11.7754901960784M1[t] + 5.72222222222224M2[t] -5.49771241830064M3[t] -13.0509803921569M4[t] -23.9375816993464M5[t] -23.3241830065359M6[t] + 34.2996732026144M7[t] + 43.4797385620915M8[t] + 36.2598039215686M9[t] + 19.4398692810458M10[t] + 0.0199346405228985M11[t] + 1.21993464052288t + e[t]


Multiple Linear Regression - Ordinary Least Squares
VariableParameterS.D.T-STATH0: parameter = 02-tail p-value1-tail p-value
(Intercept)537.84607843137311.10666648.425500
Dummyvariabele-90.81862745098049.17482-9.898700
M111.775490196078412.5424240.93890.3521470.176073
M25.7222222222222412.5098410.45740.6492760.324638
M3-5.4977124183006412.480808-0.44050.6614060.330703
M4-13.050980392156912.455348-1.04780.2995670.149783
M5-23.937581699346412.433483-1.92530.0596750.029838
M6-23.324183006535912.415234-1.87870.06590.03295
M734.299673202614412.948042.6490.0106650.005333
M843.479738562091512.932273.36210.0014570.000728
M936.259803921568612.9199922.80650.0070330.003516
M1019.439869281045812.9112141.50570.1382060.069103
M110.019934640522898512.9059440.00150.9987730.499387
t1.219934640522880.2129515.72871e-060

\begin{tabular}{lllllllll}
\hline
Multiple Linear Regression - Ordinary Least Squares \tabularnewline
Variable & Parameter & S.D. & T-STATH0: parameter = 0 & 2-tail p-value & 1-tail p-value \tabularnewline
(Intercept) & 537.846078431373 & 11.106666 & 48.4255 & 0 & 0 \tabularnewline
Dummyvariabele & -90.8186274509804 & 9.17482 & -9.8987 & 0 & 0 \tabularnewline
M1 & 11.7754901960784 & 12.542424 & 0.9389 & 0.352147 & 0.176073 \tabularnewline
M2 & 5.72222222222224 & 12.509841 & 0.4574 & 0.649276 & 0.324638 \tabularnewline
M3 & -5.49771241830064 & 12.480808 & -0.4405 & 0.661406 & 0.330703 \tabularnewline
M4 & -13.0509803921569 & 12.455348 & -1.0478 & 0.299567 & 0.149783 \tabularnewline
M5 & -23.9375816993464 & 12.433483 & -1.9253 & 0.059675 & 0.029838 \tabularnewline
M6 & -23.3241830065359 & 12.415234 & -1.8787 & 0.0659 & 0.03295 \tabularnewline
M7 & 34.2996732026144 & 12.94804 & 2.649 & 0.010665 & 0.005333 \tabularnewline
M8 & 43.4797385620915 & 12.93227 & 3.3621 & 0.001457 & 0.000728 \tabularnewline
M9 & 36.2598039215686 & 12.919992 & 2.8065 & 0.007033 & 0.003516 \tabularnewline
M10 & 19.4398692810458 & 12.911214 & 1.5057 & 0.138206 & 0.069103 \tabularnewline
M11 & 0.0199346405228985 & 12.905944 & 0.0015 & 0.998773 & 0.499387 \tabularnewline
t & 1.21993464052288 & 0.212951 & 5.7287 & 1e-06 & 0 \tabularnewline
\hline
\end{tabular}
%Source: https://freestatistics.org/blog/index.php?pk=25338&T=2

[TABLE]
[ROW][C]Multiple Linear Regression - Ordinary Least Squares[/C][/ROW]
[ROW][C]Variable[/C][C]Parameter[/C][C]S.D.[/C][C]T-STATH0: parameter = 0[/C][C]2-tail p-value[/C][C]1-tail p-value[/C][/ROW]
[ROW][C](Intercept)[/C][C]537.846078431373[/C][C]11.106666[/C][C]48.4255[/C][C]0[/C][C]0[/C][/ROW]
[ROW][C]Dummyvariabele[/C][C]-90.8186274509804[/C][C]9.17482[/C][C]-9.8987[/C][C]0[/C][C]0[/C][/ROW]
[ROW][C]M1[/C][C]11.7754901960784[/C][C]12.542424[/C][C]0.9389[/C][C]0.352147[/C][C]0.176073[/C][/ROW]
[ROW][C]M2[/C][C]5.72222222222224[/C][C]12.509841[/C][C]0.4574[/C][C]0.649276[/C][C]0.324638[/C][/ROW]
[ROW][C]M3[/C][C]-5.49771241830064[/C][C]12.480808[/C][C]-0.4405[/C][C]0.661406[/C][C]0.330703[/C][/ROW]
[ROW][C]M4[/C][C]-13.0509803921569[/C][C]12.455348[/C][C]-1.0478[/C][C]0.299567[/C][C]0.149783[/C][/ROW]
[ROW][C]M5[/C][C]-23.9375816993464[/C][C]12.433483[/C][C]-1.9253[/C][C]0.059675[/C][C]0.029838[/C][/ROW]
[ROW][C]M6[/C][C]-23.3241830065359[/C][C]12.415234[/C][C]-1.8787[/C][C]0.0659[/C][C]0.03295[/C][/ROW]
[ROW][C]M7[/C][C]34.2996732026144[/C][C]12.94804[/C][C]2.649[/C][C]0.010665[/C][C]0.005333[/C][/ROW]
[ROW][C]M8[/C][C]43.4797385620915[/C][C]12.93227[/C][C]3.3621[/C][C]0.001457[/C][C]0.000728[/C][/ROW]
[ROW][C]M9[/C][C]36.2598039215686[/C][C]12.919992[/C][C]2.8065[/C][C]0.007033[/C][C]0.003516[/C][/ROW]
[ROW][C]M10[/C][C]19.4398692810458[/C][C]12.911214[/C][C]1.5057[/C][C]0.138206[/C][C]0.069103[/C][/ROW]
[ROW][C]M11[/C][C]0.0199346405228985[/C][C]12.905944[/C][C]0.0015[/C][C]0.998773[/C][C]0.499387[/C][/ROW]
[ROW][C]t[/C][C]1.21993464052288[/C][C]0.212951[/C][C]5.7287[/C][C]1e-06[/C][C]0[/C][/ROW]
[/TABLE]
Source: https://freestatistics.org/blog/index.php?pk=25338&T=2

Globally Unique Identifier (entire table): ba.freestatistics.org/blog/index.php?pk=25338&T=2

As an alternative you can also use a QR Code:  

The GUIDs for individual cells are displayed in the table below:

Multiple Linear Regression - Ordinary Least Squares
VariableParameterS.D.T-STATH0: parameter = 02-tail p-value1-tail p-value
(Intercept)537.84607843137311.10666648.425500
Dummyvariabele-90.81862745098049.17482-9.898700
M111.775490196078412.5424240.93890.3521470.176073
M25.7222222222222412.5098410.45740.6492760.324638
M3-5.4977124183006412.480808-0.44050.6614060.330703
M4-13.050980392156912.455348-1.04780.2995670.149783
M5-23.937581699346412.433483-1.92530.0596750.029838
M6-23.324183006535912.415234-1.87870.06590.03295
M734.299673202614412.948042.6490.0106650.005333
M843.479738562091512.932273.36210.0014570.000728
M936.259803921568612.9199922.80650.0070330.003516
M1019.439869281045812.9112141.50570.1382060.069103
M110.019934640522898512.9059440.00150.9987730.499387
t1.219934640522880.2129515.72871e-060


Multiple Linear Regression - Regression Statistics
Multiple R0.894377518331342
R-squared0.79991114529653
Adjusted R-squared0.749888931620663
F-TEST (value)15.9911184754792
F-TEST (DF numerator)13
F-TEST (DF denominator)52
p-value8.34887714518118e-14
Multiple Linear Regression - Residual Statistics
Residual Standard Deviation20.4033115737979
Sum Squared Residuals21647.3464052288

\begin{tabular}{lllllllll}
\hline
Multiple Linear Regression - Regression Statistics \tabularnewline
Multiple R & 0.894377518331342 \tabularnewline
R-squared & 0.79991114529653 \tabularnewline
Adjusted R-squared & 0.749888931620663 \tabularnewline
F-TEST (value) & 15.9911184754792 \tabularnewline
F-TEST (DF numerator) & 13 \tabularnewline
F-TEST (DF denominator) & 52 \tabularnewline
p-value & 8.34887714518118e-14 \tabularnewline
Multiple Linear Regression - Residual Statistics \tabularnewline
Residual Standard Deviation & 20.4033115737979 \tabularnewline
Sum Squared Residuals & 21647.3464052288 \tabularnewline
\hline
\end{tabular}
%Source: https://freestatistics.org/blog/index.php?pk=25338&T=3

[TABLE]
[ROW][C]Multiple Linear Regression - Regression Statistics[/C][/ROW]
[ROW][C]Multiple R[/C][C]0.894377518331342[/C][/ROW]
[ROW][C]R-squared[/C][C]0.79991114529653[/C][/ROW]
[ROW][C]Adjusted R-squared[/C][C]0.749888931620663[/C][/ROW]
[ROW][C]F-TEST (value)[/C][C]15.9911184754792[/C][/ROW]
[ROW][C]F-TEST (DF numerator)[/C][C]13[/C][/ROW]
[ROW][C]F-TEST (DF denominator)[/C][C]52[/C][/ROW]
[ROW][C]p-value[/C][C]8.34887714518118e-14[/C][/ROW]
[ROW][C]Multiple Linear Regression - Residual Statistics[/C][/ROW]
[ROW][C]Residual Standard Deviation[/C][C]20.4033115737979[/C][/ROW]
[ROW][C]Sum Squared Residuals[/C][C]21647.3464052288[/C][/ROW]
[/TABLE]
Source: https://freestatistics.org/blog/index.php?pk=25338&T=3

Globally Unique Identifier (entire table): ba.freestatistics.org/blog/index.php?pk=25338&T=3

As an alternative you can also use a QR Code:  

The GUIDs for individual cells are displayed in the table below:

Multiple Linear Regression - Regression Statistics
Multiple R0.894377518331342
R-squared0.79991114529653
Adjusted R-squared0.749888931620663
F-TEST (value)15.9911184754792
F-TEST (DF numerator)13
F-TEST (DF denominator)52
p-value8.34887714518118e-14
Multiple Linear Regression - Residual Statistics
Residual Standard Deviation20.4033115737979
Sum Squared Residuals21647.3464052288


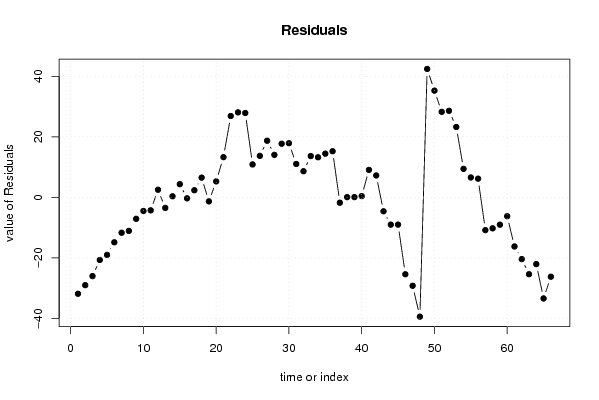
Multiple Linear Regression - Actuals, Interpolation, and Residuals
Time or IndexActualsInterpolationForecastResidualsPrediction Error
1519550.841503267974-31.8415032679741
2517546.00816993464-29.0081699346405
3510536.008169934640-26.0081699346405
4509529.674836601307-20.6748366013072
5501520.008169934640-19.0081699346405
6507521.841503267974-14.8415032679739
7569580.685294117647-11.6852941176470
8580591.085294117647-11.0852941176470
9578585.085294117647-7.08529411764702
10565569.485294117647-4.48529411764705
11547551.285294117647-4.28529411764703
12555552.4852941176472.51470588235297
13562565.480718954248-3.48071895424830
14561560.6473856209150.352614379084963
15555550.6473856209154.35261437908497
16544544.314052287582-0.314052287581688
17537534.6473856209152.35261437908497
18543536.4807189542486.51928104575164
19594595.324509803922-1.32450980392157
20611605.7245098039225.27549019607845
21613599.72450980392213.2754901960784
22611584.12450980392226.8754901960784
23594565.92450980392228.0754901960784
24595567.12450980392227.8754901960785
25591580.11993464052310.8800653594772
26589575.2866013071913.7133986928104
27584565.2866013071918.7133986928105
28573558.95326797385614.0467320261438
29567549.2866013071917.7133986928104
30569551.11993464052317.8800653594771
31621609.96372549019611.0362745098039
32629620.3637254901968.63627450980392
33628614.36372549019613.6362745098039
34612598.76372549019613.2362745098039
35595580.56372549019614.4362745098039
36597581.76372549019615.2362745098039
37593594.759150326797-1.75915032679735
38590589.9258169934640.0741830065359235
39580579.9258169934640.0741830065359395
40574573.5924836601310.40751633986927
41573563.9258169934649.07418300653593
42573565.7591503267977.2408496732026
43620624.602941176471-4.60294117647060
44626635.00294117647-9.0029411764706
45620629.00294117647-9.00294117647061
46588613.402941176471-25.4029411764706
47566595.202941176471-29.2029411764706
48557596.402941176471-39.4029411764706
49561518.57973856209242.4202614379085
50549513.74640522875835.2535947712418
51532503.74640522875828.2535947712418
52526497.41307189542528.5869281045752
53511487.74640522875823.2535947712418
54499489.5797385620929.4202614379085
55555548.4235294117656.5764705882353
56565558.8235294117656.1764705882353
57542552.823529411765-10.8235294117647
58527537.223529411765-10.2235294117647
59510519.023529411765-9.02352941176471
60514520.223529411765-6.22352941176471
61517533.218954248366-16.2189542483660
62508528.385620915033-20.3856209150327
63493518.385620915033-25.3856209150327
64490512.052287581699-22.0522875816993
65469502.385620915033-33.3856209150327
66478504.218954248366-26.218954248366

\begin{tabular}{lllllllll}
\hline
Multiple Linear Regression - Actuals, Interpolation, and Residuals \tabularnewline
Time or Index & Actuals & InterpolationForecast & ResidualsPrediction Error \tabularnewline
1 & 519 & 550.841503267974 & -31.8415032679741 \tabularnewline
2 & 517 & 546.00816993464 & -29.0081699346405 \tabularnewline
3 & 510 & 536.008169934640 & -26.0081699346405 \tabularnewline
4 & 509 & 529.674836601307 & -20.6748366013072 \tabularnewline
5 & 501 & 520.008169934640 & -19.0081699346405 \tabularnewline
6 & 507 & 521.841503267974 & -14.8415032679739 \tabularnewline
7 & 569 & 580.685294117647 & -11.6852941176470 \tabularnewline
8 & 580 & 591.085294117647 & -11.0852941176470 \tabularnewline
9 & 578 & 585.085294117647 & -7.08529411764702 \tabularnewline
10 & 565 & 569.485294117647 & -4.48529411764705 \tabularnewline
11 & 547 & 551.285294117647 & -4.28529411764703 \tabularnewline
12 & 555 & 552.485294117647 & 2.51470588235297 \tabularnewline
13 & 562 & 565.480718954248 & -3.48071895424830 \tabularnewline
14 & 561 & 560.647385620915 & 0.352614379084963 \tabularnewline
15 & 555 & 550.647385620915 & 4.35261437908497 \tabularnewline
16 & 544 & 544.314052287582 & -0.314052287581688 \tabularnewline
17 & 537 & 534.647385620915 & 2.35261437908497 \tabularnewline
18 & 543 & 536.480718954248 & 6.51928104575164 \tabularnewline
19 & 594 & 595.324509803922 & -1.32450980392157 \tabularnewline
20 & 611 & 605.724509803922 & 5.27549019607845 \tabularnewline
21 & 613 & 599.724509803922 & 13.2754901960784 \tabularnewline
22 & 611 & 584.124509803922 & 26.8754901960784 \tabularnewline
23 & 594 & 565.924509803922 & 28.0754901960784 \tabularnewline
24 & 595 & 567.124509803922 & 27.8754901960785 \tabularnewline
25 & 591 & 580.119934640523 & 10.8800653594772 \tabularnewline
26 & 589 & 575.28660130719 & 13.7133986928104 \tabularnewline
27 & 584 & 565.28660130719 & 18.7133986928105 \tabularnewline
28 & 573 & 558.953267973856 & 14.0467320261438 \tabularnewline
29 & 567 & 549.28660130719 & 17.7133986928104 \tabularnewline
30 & 569 & 551.119934640523 & 17.8800653594771 \tabularnewline
31 & 621 & 609.963725490196 & 11.0362745098039 \tabularnewline
32 & 629 & 620.363725490196 & 8.63627450980392 \tabularnewline
33 & 628 & 614.363725490196 & 13.6362745098039 \tabularnewline
34 & 612 & 598.763725490196 & 13.2362745098039 \tabularnewline
35 & 595 & 580.563725490196 & 14.4362745098039 \tabularnewline
36 & 597 & 581.763725490196 & 15.2362745098039 \tabularnewline
37 & 593 & 594.759150326797 & -1.75915032679735 \tabularnewline
38 & 590 & 589.925816993464 & 0.0741830065359235 \tabularnewline
39 & 580 & 579.925816993464 & 0.0741830065359395 \tabularnewline
40 & 574 & 573.592483660131 & 0.40751633986927 \tabularnewline
41 & 573 & 563.925816993464 & 9.07418300653593 \tabularnewline
42 & 573 & 565.759150326797 & 7.2408496732026 \tabularnewline
43 & 620 & 624.602941176471 & -4.60294117647060 \tabularnewline
44 & 626 & 635.00294117647 & -9.0029411764706 \tabularnewline
45 & 620 & 629.00294117647 & -9.00294117647061 \tabularnewline
46 & 588 & 613.402941176471 & -25.4029411764706 \tabularnewline
47 & 566 & 595.202941176471 & -29.2029411764706 \tabularnewline
48 & 557 & 596.402941176471 & -39.4029411764706 \tabularnewline
49 & 561 & 518.579738562092 & 42.4202614379085 \tabularnewline
50 & 549 & 513.746405228758 & 35.2535947712418 \tabularnewline
51 & 532 & 503.746405228758 & 28.2535947712418 \tabularnewline
52 & 526 & 497.413071895425 & 28.5869281045752 \tabularnewline
53 & 511 & 487.746405228758 & 23.2535947712418 \tabularnewline
54 & 499 & 489.579738562092 & 9.4202614379085 \tabularnewline
55 & 555 & 548.423529411765 & 6.5764705882353 \tabularnewline
56 & 565 & 558.823529411765 & 6.1764705882353 \tabularnewline
57 & 542 & 552.823529411765 & -10.8235294117647 \tabularnewline
58 & 527 & 537.223529411765 & -10.2235294117647 \tabularnewline
59 & 510 & 519.023529411765 & -9.02352941176471 \tabularnewline
60 & 514 & 520.223529411765 & -6.22352941176471 \tabularnewline
61 & 517 & 533.218954248366 & -16.2189542483660 \tabularnewline
62 & 508 & 528.385620915033 & -20.3856209150327 \tabularnewline
63 & 493 & 518.385620915033 & -25.3856209150327 \tabularnewline
64 & 490 & 512.052287581699 & -22.0522875816993 \tabularnewline
65 & 469 & 502.385620915033 & -33.3856209150327 \tabularnewline
66 & 478 & 504.218954248366 & -26.218954248366 \tabularnewline
\hline
\end{tabular}
%Source: https://freestatistics.org/blog/index.php?pk=25338&T=4

[TABLE]
[ROW][C]Multiple Linear Regression - Actuals, Interpolation, and Residuals[/C][/ROW]
[ROW][C]Time or Index[/C][C]Actuals[/C][C]InterpolationForecast[/C][C]ResidualsPrediction Error[/C][/ROW]
[ROW][C]1[/C][C]519[/C][C]550.841503267974[/C][C]-31.8415032679741[/C][/ROW]
[ROW][C]2[/C][C]517[/C][C]546.00816993464[/C][C]-29.0081699346405[/C][/ROW]
[ROW][C]3[/C][C]510[/C][C]536.008169934640[/C][C]-26.0081699346405[/C][/ROW]
[ROW][C]4[/C][C]509[/C][C]529.674836601307[/C][C]-20.6748366013072[/C][/ROW]
[ROW][C]5[/C][C]501[/C][C]520.008169934640[/C][C]-19.0081699346405[/C][/ROW]
[ROW][C]6[/C][C]507[/C][C]521.841503267974[/C][C]-14.8415032679739[/C][/ROW]
[ROW][C]7[/C][C]569[/C][C]580.685294117647[/C][C]-11.6852941176470[/C][/ROW]
[ROW][C]8[/C][C]580[/C][C]591.085294117647[/C][C]-11.0852941176470[/C][/ROW]
[ROW][C]9[/C][C]578[/C][C]585.085294117647[/C][C]-7.08529411764702[/C][/ROW]
[ROW][C]10[/C][C]565[/C][C]569.485294117647[/C][C]-4.48529411764705[/C][/ROW]
[ROW][C]11[/C][C]547[/C][C]551.285294117647[/C][C]-4.28529411764703[/C][/ROW]
[ROW][C]12[/C][C]555[/C][C]552.485294117647[/C][C]2.51470588235297[/C][/ROW]
[ROW][C]13[/C][C]562[/C][C]565.480718954248[/C][C]-3.48071895424830[/C][/ROW]
[ROW][C]14[/C][C]561[/C][C]560.647385620915[/C][C]0.352614379084963[/C][/ROW]
[ROW][C]15[/C][C]555[/C][C]550.647385620915[/C][C]4.35261437908497[/C][/ROW]
[ROW][C]16[/C][C]544[/C][C]544.314052287582[/C][C]-0.314052287581688[/C][/ROW]
[ROW][C]17[/C][C]537[/C][C]534.647385620915[/C][C]2.35261437908497[/C][/ROW]
[ROW][C]18[/C][C]543[/C][C]536.480718954248[/C][C]6.51928104575164[/C][/ROW]
[ROW][C]19[/C][C]594[/C][C]595.324509803922[/C][C]-1.32450980392157[/C][/ROW]
[ROW][C]20[/C][C]611[/C][C]605.724509803922[/C][C]5.27549019607845[/C][/ROW]
[ROW][C]21[/C][C]613[/C][C]599.724509803922[/C][C]13.2754901960784[/C][/ROW]
[ROW][C]22[/C][C]611[/C][C]584.124509803922[/C][C]26.8754901960784[/C][/ROW]
[ROW][C]23[/C][C]594[/C][C]565.924509803922[/C][C]28.0754901960784[/C][/ROW]
[ROW][C]24[/C][C]595[/C][C]567.124509803922[/C][C]27.8754901960785[/C][/ROW]
[ROW][C]25[/C][C]591[/C][C]580.119934640523[/C][C]10.8800653594772[/C][/ROW]
[ROW][C]26[/C][C]589[/C][C]575.28660130719[/C][C]13.7133986928104[/C][/ROW]
[ROW][C]27[/C][C]584[/C][C]565.28660130719[/C][C]18.7133986928105[/C][/ROW]
[ROW][C]28[/C][C]573[/C][C]558.953267973856[/C][C]14.0467320261438[/C][/ROW]
[ROW][C]29[/C][C]567[/C][C]549.28660130719[/C][C]17.7133986928104[/C][/ROW]
[ROW][C]30[/C][C]569[/C][C]551.119934640523[/C][C]17.8800653594771[/C][/ROW]
[ROW][C]31[/C][C]621[/C][C]609.963725490196[/C][C]11.0362745098039[/C][/ROW]
[ROW][C]32[/C][C]629[/C][C]620.363725490196[/C][C]8.63627450980392[/C][/ROW]
[ROW][C]33[/C][C]628[/C][C]614.363725490196[/C][C]13.6362745098039[/C][/ROW]
[ROW][C]34[/C][C]612[/C][C]598.763725490196[/C][C]13.2362745098039[/C][/ROW]
[ROW][C]35[/C][C]595[/C][C]580.563725490196[/C][C]14.4362745098039[/C][/ROW]
[ROW][C]36[/C][C]597[/C][C]581.763725490196[/C][C]15.2362745098039[/C][/ROW]
[ROW][C]37[/C][C]593[/C][C]594.759150326797[/C][C]-1.75915032679735[/C][/ROW]
[ROW][C]38[/C][C]590[/C][C]589.925816993464[/C][C]0.0741830065359235[/C][/ROW]
[ROW][C]39[/C][C]580[/C][C]579.925816993464[/C][C]0.0741830065359395[/C][/ROW]
[ROW][C]40[/C][C]574[/C][C]573.592483660131[/C][C]0.40751633986927[/C][/ROW]
[ROW][C]41[/C][C]573[/C][C]563.925816993464[/C][C]9.07418300653593[/C][/ROW]
[ROW][C]42[/C][C]573[/C][C]565.759150326797[/C][C]7.2408496732026[/C][/ROW]
[ROW][C]43[/C][C]620[/C][C]624.602941176471[/C][C]-4.60294117647060[/C][/ROW]
[ROW][C]44[/C][C]626[/C][C]635.00294117647[/C][C]-9.0029411764706[/C][/ROW]
[ROW][C]45[/C][C]620[/C][C]629.00294117647[/C][C]-9.00294117647061[/C][/ROW]
[ROW][C]46[/C][C]588[/C][C]613.402941176471[/C][C]-25.4029411764706[/C][/ROW]
[ROW][C]47[/C][C]566[/C][C]595.202941176471[/C][C]-29.2029411764706[/C][/ROW]
[ROW][C]48[/C][C]557[/C][C]596.402941176471[/C][C]-39.4029411764706[/C][/ROW]
[ROW][C]49[/C][C]561[/C][C]518.579738562092[/C][C]42.4202614379085[/C][/ROW]
[ROW][C]50[/C][C]549[/C][C]513.746405228758[/C][C]35.2535947712418[/C][/ROW]
[ROW][C]51[/C][C]532[/C][C]503.746405228758[/C][C]28.2535947712418[/C][/ROW]
[ROW][C]52[/C][C]526[/C][C]497.413071895425[/C][C]28.5869281045752[/C][/ROW]
[ROW][C]53[/C][C]511[/C][C]487.746405228758[/C][C]23.2535947712418[/C][/ROW]
[ROW][C]54[/C][C]499[/C][C]489.579738562092[/C][C]9.4202614379085[/C][/ROW]
[ROW][C]55[/C][C]555[/C][C]548.423529411765[/C][C]6.5764705882353[/C][/ROW]
[ROW][C]56[/C][C]565[/C][C]558.823529411765[/C][C]6.1764705882353[/C][/ROW]
[ROW][C]57[/C][C]542[/C][C]552.823529411765[/C][C]-10.8235294117647[/C][/ROW]
[ROW][C]58[/C][C]527[/C][C]537.223529411765[/C][C]-10.2235294117647[/C][/ROW]
[ROW][C]59[/C][C]510[/C][C]519.023529411765[/C][C]-9.02352941176471[/C][/ROW]
[ROW][C]60[/C][C]514[/C][C]520.223529411765[/C][C]-6.22352941176471[/C][/ROW]
[ROW][C]61[/C][C]517[/C][C]533.218954248366[/C][C]-16.2189542483660[/C][/ROW]
[ROW][C]62[/C][C]508[/C][C]528.385620915033[/C][C]-20.3856209150327[/C][/ROW]
[ROW][C]63[/C][C]493[/C][C]518.385620915033[/C][C]-25.3856209150327[/C][/ROW]
[ROW][C]64[/C][C]490[/C][C]512.052287581699[/C][C]-22.0522875816993[/C][/ROW]
[ROW][C]65[/C][C]469[/C][C]502.385620915033[/C][C]-33.3856209150327[/C][/ROW]
[ROW][C]66[/C][C]478[/C][C]504.218954248366[/C][C]-26.218954248366[/C][/ROW]
[/TABLE]
Source: https://freestatistics.org/blog/index.php?pk=25338&T=4

Globally Unique Identifier (entire table): ba.freestatistics.org/blog/index.php?pk=25338&T=4

As an alternative you can also use a QR Code:  

The GUIDs for individual cells are displayed in the table below:

Multiple Linear Regression - Actuals, Interpolation, and Residuals
Time or IndexActualsInterpolationForecastResidualsPrediction Error
1519550.841503267974-31.8415032679741
2517546.00816993464-29.0081699346405
3510536.008169934640-26.0081699346405
4509529.674836601307-20.6748366013072
5501520.008169934640-19.0081699346405
6507521.841503267974-14.8415032679739
7569580.685294117647-11.6852941176470
8580591.085294117647-11.0852941176470
9578585.085294117647-7.08529411764702
10565569.485294117647-4.48529411764705
11547551.285294117647-4.28529411764703
12555552.4852941176472.51470588235297
13562565.480718954248-3.48071895424830
14561560.6473856209150.352614379084963
15555550.6473856209154.35261437908497
16544544.314052287582-0.314052287581688
17537534.6473856209152.35261437908497
18543536.4807189542486.51928104575164
19594595.324509803922-1.32450980392157
20611605.7245098039225.27549019607845
21613599.72450980392213.2754901960784
22611584.12450980392226.8754901960784
23594565.92450980392228.0754901960784
24595567.12450980392227.8754901960785
25591580.11993464052310.8800653594772
26589575.2866013071913.7133986928104
27584565.2866013071918.7133986928105
28573558.95326797385614.0467320261438
29567549.2866013071917.7133986928104
30569551.11993464052317.8800653594771
31621609.96372549019611.0362745098039
32629620.3637254901968.63627450980392
33628614.36372549019613.6362745098039
34612598.76372549019613.2362745098039
35595580.56372549019614.4362745098039
36597581.76372549019615.2362745098039
37593594.759150326797-1.75915032679735
38590589.9258169934640.0741830065359235
39580579.9258169934640.0741830065359395
40574573.5924836601310.40751633986927
41573563.9258169934649.07418300653593
42573565.7591503267977.2408496732026
43620624.602941176471-4.60294117647060
44626635.00294117647-9.0029411764706
45620629.00294117647-9.00294117647061
46588613.402941176471-25.4029411764706
47566595.202941176471-29.2029411764706
48557596.402941176471-39.4029411764706
49561518.57973856209242.4202614379085
50549513.74640522875835.2535947712418
51532503.74640522875828.2535947712418
52526497.41307189542528.5869281045752
53511487.74640522875823.2535947712418
54499489.5797385620929.4202614379085
55555548.4235294117656.5764705882353
56565558.8235294117656.1764705882353
57542552.823529411765-10.8235294117647
58527537.223529411765-10.2235294117647
59510519.023529411765-9.02352941176471
60514520.223529411765-6.22352941176471
61517533.218954248366-16.2189542483660
62508528.385620915033-20.3856209150327
63493518.385620915033-25.3856209150327
64490512.052287581699-22.0522875816993
65469502.385620915033-33.3856209150327
66478504.218954248366-26.218954248366


Goldfeld-Quandt test for Heteroskedasticity
p-valuesAlternative Hypothesis
breakpoint indexgreater2-sidedless
170.02352193699338850.0470438739867770.976478063006611
180.008471858550027650.01694371710005530.991528141449972
190.02931226347529810.05862452695059610.970687736524702
200.02216581884843460.04433163769686930.977834181151565
210.01168213057518810.02336426115037620.988317869424812
220.008956683511306250.01791336702261250.991043316488694
230.006779932460119380.01355986492023880.99322006753988
240.002766779076816760.005533558153633520.997233220923183
250.003035536762775880.006071073525551760.996964463237224
260.002906186748088840.005812373496177670.997093813251911
270.001792362498441910.003584724996883810.998207637501558
280.002946249426094060.005892498852188120.997053750573906
290.003243883706996510.006487767413993010.996756116293003
300.005956093814700890.01191218762940180.9940439061853
310.02182200723401520.04364401446803050.978177992765985
320.1431074975085100.2862149950170210.85689250249149
330.2672429470823130.5344858941646270.732757052917687
340.4772623687033050.954524737406610.522737631296695
350.580620545663540.838758908672920.41937945433646
360.6472529635915260.7054940728169480.352747036408474
370.8500378713516560.2999242572966870.149962128648344
380.9188145598003880.1623708803992240.0811854401996122
390.9435697060367550.1128605879264890.0564302939632446
400.9674667955558440.06506640888831270.0325332044441563
410.948464359433480.103071281133040.05153564056652
420.929656533433870.1406869331322590.0703434665661293
430.9141480929150820.1717038141698360.085851907084918
440.8943102812290860.2113794375418280.105689718770914
450.9737233857243560.05255322855128780.0262766142756439
460.982735081859960.03452983628007960.0172649181400398
470.9838401084453130.03231978310937410.0161598915546870
480.9707396667647060.05852066647058850.0292603332352943
490.9296258085890270.1407483828219470.0703741914109735

\begin{tabular}{lllllllll}
\hline
Goldfeld-Quandt test for Heteroskedasticity \tabularnewline
p-values & Alternative Hypothesis \tabularnewline
breakpoint index & greater & 2-sided & less \tabularnewline
17 & 0.0235219369933885 & 0.047043873986777 & 0.976478063006611 \tabularnewline
18 & 0.00847185855002765 & 0.0169437171000553 & 0.991528141449972 \tabularnewline
19 & 0.0293122634752981 & 0.0586245269505961 & 0.970687736524702 \tabularnewline
20 & 0.0221658188484346 & 0.0443316376968693 & 0.977834181151565 \tabularnewline
21 & 0.0116821305751881 & 0.0233642611503762 & 0.988317869424812 \tabularnewline
22 & 0.00895668351130625 & 0.0179133670226125 & 0.991043316488694 \tabularnewline
23 & 0.00677993246011938 & 0.0135598649202388 & 0.99322006753988 \tabularnewline
24 & 0.00276677907681676 & 0.00553355815363352 & 0.997233220923183 \tabularnewline
25 & 0.00303553676277588 & 0.00607107352555176 & 0.996964463237224 \tabularnewline
26 & 0.00290618674808884 & 0.00581237349617767 & 0.997093813251911 \tabularnewline
27 & 0.00179236249844191 & 0.00358472499688381 & 0.998207637501558 \tabularnewline
28 & 0.00294624942609406 & 0.00589249885218812 & 0.997053750573906 \tabularnewline
29 & 0.00324388370699651 & 0.00648776741399301 & 0.996756116293003 \tabularnewline
30 & 0.00595609381470089 & 0.0119121876294018 & 0.9940439061853 \tabularnewline
31 & 0.0218220072340152 & 0.0436440144680305 & 0.978177992765985 \tabularnewline
32 & 0.143107497508510 & 0.286214995017021 & 0.85689250249149 \tabularnewline
33 & 0.267242947082313 & 0.534485894164627 & 0.732757052917687 \tabularnewline
34 & 0.477262368703305 & 0.95452473740661 & 0.522737631296695 \tabularnewline
35 & 0.58062054566354 & 0.83875890867292 & 0.41937945433646 \tabularnewline
36 & 0.647252963591526 & 0.705494072816948 & 0.352747036408474 \tabularnewline
37 & 0.850037871351656 & 0.299924257296687 & 0.149962128648344 \tabularnewline
38 & 0.918814559800388 & 0.162370880399224 & 0.0811854401996122 \tabularnewline
39 & 0.943569706036755 & 0.112860587926489 & 0.0564302939632446 \tabularnewline
40 & 0.967466795555844 & 0.0650664088883127 & 0.0325332044441563 \tabularnewline
41 & 0.94846435943348 & 0.10307128113304 & 0.05153564056652 \tabularnewline
42 & 0.92965653343387 & 0.140686933132259 & 0.0703434665661293 \tabularnewline
43 & 0.914148092915082 & 0.171703814169836 & 0.085851907084918 \tabularnewline
44 & 0.894310281229086 & 0.211379437541828 & 0.105689718770914 \tabularnewline
45 & 0.973723385724356 & 0.0525532285512878 & 0.0262766142756439 \tabularnewline
46 & 0.98273508185996 & 0.0345298362800796 & 0.0172649181400398 \tabularnewline
47 & 0.983840108445313 & 0.0323197831093741 & 0.0161598915546870 \tabularnewline
48 & 0.970739666764706 & 0.0585206664705885 & 0.0292603332352943 \tabularnewline
49 & 0.929625808589027 & 0.140748382821947 & 0.0703741914109735 \tabularnewline
\hline
\end{tabular}
%Source: https://freestatistics.org/blog/index.php?pk=25338&T=5

[TABLE]
[ROW][C]Goldfeld-Quandt test for Heteroskedasticity[/C][/ROW]
[ROW][C]p-values[/C][C]Alternative Hypothesis[/C][/ROW]
[ROW][C]breakpoint index[/C][C]greater[/C][C]2-sided[/C][C]less[/C][/ROW]
[ROW][C]17[/C][C]0.0235219369933885[/C][C]0.047043873986777[/C][C]0.976478063006611[/C][/ROW]
[ROW][C]18[/C][C]0.00847185855002765[/C][C]0.0169437171000553[/C][C]0.991528141449972[/C][/ROW]
[ROW][C]19[/C][C]0.0293122634752981[/C][C]0.0586245269505961[/C][C]0.970687736524702[/C][/ROW]
[ROW][C]20[/C][C]0.0221658188484346[/C][C]0.0443316376968693[/C][C]0.977834181151565[/C][/ROW]
[ROW][C]21[/C][C]0.0116821305751881[/C][C]0.0233642611503762[/C][C]0.988317869424812[/C][/ROW]
[ROW][C]22[/C][C]0.00895668351130625[/C][C]0.0179133670226125[/C][C]0.991043316488694[/C][/ROW]
[ROW][C]23[/C][C]0.00677993246011938[/C][C]0.0135598649202388[/C][C]0.99322006753988[/C][/ROW]
[ROW][C]24[/C][C]0.00276677907681676[/C][C]0.00553355815363352[/C][C]0.997233220923183[/C][/ROW]
[ROW][C]25[/C][C]0.00303553676277588[/C][C]0.00607107352555176[/C][C]0.996964463237224[/C][/ROW]
[ROW][C]26[/C][C]0.00290618674808884[/C][C]0.00581237349617767[/C][C]0.997093813251911[/C][/ROW]
[ROW][C]27[/C][C]0.00179236249844191[/C][C]0.00358472499688381[/C][C]0.998207637501558[/C][/ROW]
[ROW][C]28[/C][C]0.00294624942609406[/C][C]0.00589249885218812[/C][C]0.997053750573906[/C][/ROW]
[ROW][C]29[/C][C]0.00324388370699651[/C][C]0.00648776741399301[/C][C]0.996756116293003[/C][/ROW]
[ROW][C]30[/C][C]0.00595609381470089[/C][C]0.0119121876294018[/C][C]0.9940439061853[/C][/ROW]
[ROW][C]31[/C][C]0.0218220072340152[/C][C]0.0436440144680305[/C][C]0.978177992765985[/C][/ROW]
[ROW][C]32[/C][C]0.143107497508510[/C][C]0.286214995017021[/C][C]0.85689250249149[/C][/ROW]
[ROW][C]33[/C][C]0.267242947082313[/C][C]0.534485894164627[/C][C]0.732757052917687[/C][/ROW]
[ROW][C]34[/C][C]0.477262368703305[/C][C]0.95452473740661[/C][C]0.522737631296695[/C][/ROW]
[ROW][C]35[/C][C]0.58062054566354[/C][C]0.83875890867292[/C][C]0.41937945433646[/C][/ROW]
[ROW][C]36[/C][C]0.647252963591526[/C][C]0.705494072816948[/C][C]0.352747036408474[/C][/ROW]
[ROW][C]37[/C][C]0.850037871351656[/C][C]0.299924257296687[/C][C]0.149962128648344[/C][/ROW]
[ROW][C]38[/C][C]0.918814559800388[/C][C]0.162370880399224[/C][C]0.0811854401996122[/C][/ROW]
[ROW][C]39[/C][C]0.943569706036755[/C][C]0.112860587926489[/C][C]0.0564302939632446[/C][/ROW]
[ROW][C]40[/C][C]0.967466795555844[/C][C]0.0650664088883127[/C][C]0.0325332044441563[/C][/ROW]
[ROW][C]41[/C][C]0.94846435943348[/C][C]0.10307128113304[/C][C]0.05153564056652[/C][/ROW]
[ROW][C]42[/C][C]0.92965653343387[/C][C]0.140686933132259[/C][C]0.0703434665661293[/C][/ROW]
[ROW][C]43[/C][C]0.914148092915082[/C][C]0.171703814169836[/C][C]0.085851907084918[/C][/ROW]
[ROW][C]44[/C][C]0.894310281229086[/C][C]0.211379437541828[/C][C]0.105689718770914[/C][/ROW]
[ROW][C]45[/C][C]0.973723385724356[/C][C]0.0525532285512878[/C][C]0.0262766142756439[/C][/ROW]
[ROW][C]46[/C][C]0.98273508185996[/C][C]0.0345298362800796[/C][C]0.0172649181400398[/C][/ROW]
[ROW][C]47[/C][C]0.983840108445313[/C][C]0.0323197831093741[/C][C]0.0161598915546870[/C][/ROW]
[ROW][C]48[/C][C]0.970739666764706[/C][C]0.0585206664705885[/C][C]0.0292603332352943[/C][/ROW]
[ROW][C]49[/C][C]0.929625808589027[/C][C]0.140748382821947[/C][C]0.0703741914109735[/C][/ROW]
[/TABLE]
Source: https://freestatistics.org/blog/index.php?pk=25338&T=5

Globally Unique Identifier (entire table): ba.freestatistics.org/blog/index.php?pk=25338&T=5

As an alternative you can also use a QR Code:  

The GUIDs for individual cells are displayed in the table below:

Goldfeld-Quandt test for Heteroskedasticity
p-valuesAlternative Hypothesis
breakpoint indexgreater2-sidedless
170.02352193699338850.0470438739867770.976478063006611
180.008471858550027650.01694371710005530.991528141449972
190.02931226347529810.05862452695059610.970687736524702
200.02216581884843460.04433163769686930.977834181151565
210.01168213057518810.02336426115037620.988317869424812
220.008956683511306250.01791336702261250.991043316488694
230.006779932460119380.01355986492023880.99322006753988
240.002766779076816760.005533558153633520.997233220923183
250.003035536762775880.006071073525551760.996964463237224
260.002906186748088840.005812373496177670.997093813251911
270.001792362498441910.003584724996883810.998207637501558
280.002946249426094060.005892498852188120.997053750573906
290.003243883706996510.006487767413993010.996756116293003
300.005956093814700890.01191218762940180.9940439061853
310.02182200723401520.04364401446803050.978177992765985
320.1431074975085100.2862149950170210.85689250249149
330.2672429470823130.5344858941646270.732757052917687
340.4772623687033050.954524737406610.522737631296695
350.580620545663540.838758908672920.41937945433646
360.6472529635915260.7054940728169480.352747036408474
370.8500378713516560.2999242572966870.149962128648344
380.9188145598003880.1623708803992240.0811854401996122
390.9435697060367550.1128605879264890.0564302939632446
400.9674667955558440.06506640888831270.0325332044441563
410.948464359433480.103071281133040.05153564056652
420.929656533433870.1406869331322590.0703434665661293
430.9141480929150820.1717038141698360.085851907084918
440.8943102812290860.2113794375418280.105689718770914
450.9737233857243560.05255322855128780.0262766142756439
460.982735081859960.03452983628007960.0172649181400398
470.9838401084453130.03231978310937410.0161598915546870
480.9707396667647060.05852066647058850.0292603332352943
490.9296258085890270.1407483828219470.0703741914109735


Meta Analysis of Goldfeld-Quandt test for Heteroskedasticity
Description# significant tests% significant testsOK/NOK
1% type I error level60.181818181818182NOK
5% type I error level160.484848484848485NOK
10% type I error level200.606060606060606NOK

\begin{tabular}{lllllllll}
\hline
Meta Analysis of Goldfeld-Quandt test for Heteroskedasticity \tabularnewline
Description & # significant tests & % significant tests & OK/NOK \tabularnewline
1% type I error level & 6 & 0.181818181818182 & NOK \tabularnewline
5% type I error level & 16 & 0.484848484848485 & NOK \tabularnewline
10% type I error level & 20 & 0.606060606060606 & NOK \tabularnewline
\hline
\end{tabular}
%Source: https://freestatistics.org/blog/index.php?pk=25338&T=6

[TABLE]
[ROW][C]Meta Analysis of Goldfeld-Quandt test for Heteroskedasticity[/C][/ROW]
[ROW][C]Description[/C][C]# significant tests[/C][C]% significant tests[/C][C]OK/NOK[/C][/ROW]
[ROW][C]1% type I error level[/C][C]6[/C][C]0.181818181818182[/C][C]NOK[/C][/ROW]
[ROW][C]5% type I error level[/C][C]16[/C][C]0.484848484848485[/C][C]NOK[/C][/ROW]
[ROW][C]10% type I error level[/C][C]20[/C][C]0.606060606060606[/C][C]NOK[/C][/ROW]
[/TABLE]
Source: https://freestatistics.org/blog/index.php?pk=25338&T=6

Globally Unique Identifier (entire table): ba.freestatistics.org/blog/index.php?pk=25338&T=6

As an alternative you can also use a QR Code:  

The GUIDs for individual cells are displayed in the table below:

Meta Analysis of Goldfeld-Quandt test for Heteroskedasticity
Description# significant tests% significant testsOK/NOK
1% type I error level60.181818181818182NOK
5% type I error level160.484848484848485NOK
10% type I error level200.606060606060606NOK


Parameters (Session):
par1 = 1 ; par2 = Include Monthly Dummies ; par3 = Linear Trend ;
Parameters (R input):
par1 = 1 ; par2 = Include Monthly Dummies ; par3 = Linear Trend ;
R code (references can be found in the software module):
library(lattice)
library(lmtest)
n25 <- 25 #minimum number of obs. for Goldfeld-Quandt test
par1 <- as.numeric(par1)
x <- t(y)
k <- length(x[1,])
n <- length(x[,1])
x1 <- cbind(x[,par1], x[,1:k!=par1])
mycolnames <- c(colnames(x)[par1], colnames(x)[1:k!=par1])
colnames(x1) <- mycolnames #colnames(x)[par1]
x <- x1
if (par3 == 'First Differences'){
x2 <- array(0, dim=c(n-1,k), dimnames=list(1:(n-1), paste('(1-B)',colnames(x),sep='')))
for (i in 1:n-1) {
for (j in 1:k) {
x2[i,j] <- x[i+1,j] - x[i,j]
}
}
x <- x2
}
if (par2 == 'Include Monthly Dummies'){
x2 <- array(0, dim=c(n,11), dimnames=list(1:n, paste('M', seq(1:11), sep ='')))
for (i in 1:11){
x2[seq(i,n,12),i] <- 1
}
x <- cbind(x, x2)
}
if (par2 == 'Include Quarterly Dummies'){
x2 <- array(0, dim=c(n,3), dimnames=list(1:n, paste('Q', seq(1:3), sep ='')))
for (i in 1:3){
x2[seq(i,n,4),i] <- 1
}
x <- cbind(x, x2)
}
k <- length(x[1,])
if (par3 == 'Linear Trend'){
x <- cbind(x, c(1:n))
colnames(x)[k+1] <- 't'
}
x
k <- length(x[1,])
df <- as.data.frame(x)
(mylm <- lm(df))
(mysum <- summary(mylm))
if (n > n25) {
kp3 <- k + 3
nmkm3 <- n - k - 3
gqarr <- array(NA, dim=c(nmkm3-kp3+1,3))
numgqtests <- 0
numsignificant1 <- 0
numsignificant5 <- 0
numsignificant10 <- 0
for (mypoint in kp3:nmkm3) {
j <- 0
numgqtests <- numgqtests + 1
for (myalt in c('greater', 'two.sided', 'less')) {
j <- j + 1
gqarr[mypoint-kp3+1,j] <- gqtest(mylm, point=mypoint, alternative=myalt)$p.value
}
if (gqarr[mypoint-kp3+1,2] < 0.01) numsignificant1 <- numsignificant1 + 1
if (gqarr[mypoint-kp3+1,2] < 0.05) numsignificant5 <- numsignificant5 + 1
if (gqarr[mypoint-kp3+1,2] < 0.10) numsignificant10 <- numsignificant10 + 1
}
gqarr
}
bitmap(file='test0.png')
plot(x[,1], type='l', main='Actuals and Interpolation', ylab='value of Actuals and Interpolation (dots)', xlab='time or index')
points(x[,1]-mysum$resid)
grid()
dev.off()
bitmap(file='test1.png')
plot(mysum$resid, type='b', pch=19, main='Residuals', ylab='value of Residuals', xlab='time or index')
grid()
dev.off()
bitmap(file='test2.png')
hist(mysum$resid, main='Residual Histogram', xlab='values of Residuals')
grid()
dev.off()
bitmap(file='test3.png')
densityplot(~mysum$resid,col='black',main='Residual Density Plot', xlab='values of Residuals')
dev.off()
bitmap(file='test4.png')
qqnorm(mysum$resid, main='Residual Normal Q-Q Plot')
qqline(mysum$resid)
grid()
dev.off()
(myerror <- as.ts(mysum$resid))
bitmap(file='test5.png')
dum <- cbind(lag(myerror,k=1),myerror)
dum
dum1 <- dum[2:length(myerror),]
dum1
z <- as.data.frame(dum1)
z
plot(z,main=paste('Residual Lag plot, lowess, and regression line'), ylab='values of Residuals', xlab='lagged values of Residuals')
lines(lowess(z))
abline(lm(z))
grid()
dev.off()
bitmap(file='test6.png')
acf(mysum$resid, lag.max=length(mysum$resid)/2, main='Residual Autocorrelation Function')
grid()
dev.off()
bitmap(file='test7.png')
pacf(mysum$resid, lag.max=length(mysum$resid)/2, main='Residual Partial Autocorrelation Function')
grid()
dev.off()
bitmap(file='test8.png')
opar <- par(mfrow = c(2,2), oma = c(0, 0, 1.1, 0))
plot(mylm, las = 1, sub='Residual Diagnostics')
par(opar)
dev.off()
if (n > n25) {
bitmap(file='test9.png')
plot(kp3:nmkm3,gqarr[,2], main='Goldfeld-Quandt test',ylab='2-sided p-value',xlab='breakpoint')
grid()
dev.off()
}
load(file='createtable')
a<-table.start()
a<-table.row.start(a)
a<-table.element(a, 'Multiple Linear Regression - Estimated Regression Equation', 1, TRUE)
a<-table.row.end(a)
myeq <- colnames(x)[1]
myeq <- paste(myeq, '[t] = ', sep='')
for (i in 1:k){
if (mysum$coefficients[i,1] > 0) myeq <- paste(myeq, '+', '')
myeq <- paste(myeq, mysum$coefficients[i,1], sep=' ')
if (rownames(mysum$coefficients)[i] != '(Intercept)') {
myeq <- paste(myeq, rownames(mysum$coefficients)[i], sep='')
if (rownames(mysum$coefficients)[i] != 't') myeq <- paste(myeq, '[t]', sep='')
}
}
myeq <- paste(myeq, ' + e[t]')
a<-table.row.start(a)
a<-table.element(a, myeq)
a<-table.row.end(a)
a<-table.end(a)
table.save(a,file='mytable1.tab')
a<-table.start()
a<-table.row.start(a)
a<-table.element(a,hyperlink('ols1.htm','Multiple Linear Regression - Ordinary Least Squares',''), 6, TRUE)
a<-table.row.end(a)
a<-table.row.start(a)
a<-table.element(a,'Variable',header=TRUE)
a<-table.element(a,'Parameter',header=TRUE)
a<-table.element(a,'S.D.',header=TRUE)
a<-table.element(a,'T-STAT
H0: parameter = 0',header=TRUE)
a<-table.element(a,'2-tail p-value',header=TRUE)
a<-table.element(a,'1-tail p-value',header=TRUE)
a<-table.row.end(a)
for (i in 1:k){
a<-table.row.start(a)
a<-table.element(a,rownames(mysum$coefficients)[i],header=TRUE)
a<-table.element(a,mysum$coefficients[i,1])
a<-table.element(a, round(mysum$coefficients[i,2],6))
a<-table.element(a, round(mysum$coefficients[i,3],4))
a<-table.element(a, round(mysum$coefficients[i,4],6))
a<-table.element(a, round(mysum$coefficients[i,4]/2,6))
a<-table.row.end(a)
}
a<-table.end(a)
table.save(a,file='mytable2.tab')
a<-table.start()
a<-table.row.start(a)
a<-table.element(a, 'Multiple Linear Regression - Regression Statistics', 2, TRUE)
a<-table.row.end(a)
a<-table.row.start(a)
a<-table.element(a, 'Multiple R',1,TRUE)
a<-table.element(a, sqrt(mysum$r.squared))
a<-table.row.end(a)
a<-table.row.start(a)
a<-table.element(a, 'R-squared',1,TRUE)
a<-table.element(a, mysum$r.squared)
a<-table.row.end(a)
a<-table.row.start(a)
a<-table.element(a, 'Adjusted R-squared',1,TRUE)
a<-table.element(a, mysum$adj.r.squared)
a<-table.row.end(a)
a<-table.row.start(a)
a<-table.element(a, 'F-TEST (value)',1,TRUE)
a<-table.element(a, mysum$fstatistic[1])
a<-table.row.end(a)
a<-table.row.start(a)
a<-table.element(a, 'F-TEST (DF numerator)',1,TRUE)
a<-table.element(a, mysum$fstatistic[2])
a<-table.row.end(a)
a<-table.row.start(a)
a<-table.element(a, 'F-TEST (DF denominator)',1,TRUE)
a<-table.element(a, mysum$fstatistic[3])
a<-table.row.end(a)
a<-table.row.start(a)
a<-table.element(a, 'p-value',1,TRUE)
a<-table.element(a, 1-pf(mysum$fstatistic[1],mysum$fstatistic[2],mysum$fstatistic[3]))
a<-table.row.end(a)
a<-table.row.start(a)
a<-table.element(a, 'Multiple Linear Regression - Residual Statistics', 2, TRUE)
a<-table.row.end(a)
a<-table.row.start(a)
a<-table.element(a, 'Residual Standard Deviation',1,TRUE)
a<-table.element(a, mysum$sigma)
a<-table.row.end(a)
a<-table.row.start(a)
a<-table.element(a, 'Sum Squared Residuals',1,TRUE)
a<-table.element(a, sum(myerror*myerror))
a<-table.row.end(a)
a<-table.end(a)
table.save(a,file='mytable3.tab')
a<-table.start()
a<-table.row.start(a)
a<-table.element(a, 'Multiple Linear Regression - Actuals, Interpolation, and Residuals', 4, TRUE)
a<-table.row.end(a)
a<-table.row.start(a)
a<-table.element(a, 'Time or Index', 1, TRUE)
a<-table.element(a, 'Actuals', 1, TRUE)
a<-table.element(a, 'Interpolation
Forecast', 1, TRUE)
a<-table.element(a, 'Residuals
Prediction Error', 1, TRUE)
a<-table.row.end(a)
for (i in 1:n) {
a<-table.row.start(a)
a<-table.element(a,i, 1, TRUE)
a<-table.element(a,x[i])
a<-table.element(a,x[i]-mysum$resid[i])
a<-table.element(a,mysum$resid[i])
a<-table.row.end(a)
}
a<-table.end(a)
table.save(a,file='mytable4.tab')
if (n > n25) {
a<-table.start()
a<-table.row.start(a)
a<-table.element(a,'Goldfeld-Quandt test for Heteroskedasticity',4,TRUE)
a<-table.row.end(a)
a<-table.row.start(a)
a<-table.element(a,'p-values',header=TRUE)
a<-table.element(a,'Alternative Hypothesis',3,header=TRUE)
a<-table.row.end(a)
a<-table.row.start(a)
a<-table.element(a,'breakpoint index',header=TRUE)
a<-table.element(a,'greater',header=TRUE)
a<-table.element(a,'2-sided',header=TRUE)
a<-table.element(a,'less',header=TRUE)
a<-table.row.end(a)
for (mypoint in kp3:nmkm3) {
a<-table.row.start(a)
a<-table.element(a,mypoint,header=TRUE)
a<-table.element(a,gqarr[mypoint-kp3+1,1])
a<-table.element(a,gqarr[mypoint-kp3+1,2])
a<-table.element(a,gqarr[mypoint-kp3+1,3])
a<-table.row.end(a)
}
a<-table.end(a)
table.save(a,file='mytable5.tab')
a<-table.start()
a<-table.row.start(a)
a<-table.element(a,'Meta Analysis of Goldfeld-Quandt test for Heteroskedasticity',4,TRUE)
a<-table.row.end(a)
a<-table.row.start(a)
a<-table.element(a,'Description',header=TRUE)
a<-table.element(a,'# significant tests',header=TRUE)
a<-table.element(a,'% significant tests',header=TRUE)
a<-table.element(a,'OK/NOK',header=TRUE)
a<-table.row.end(a)
a<-table.row.start(a)
a<-table.element(a,'1% type I error level',header=TRUE)
a<-table.element(a,numsignificant1)
a<-table.element(a,numsignificant1/numgqtests)
if (numsignificant1/numgqtests < 0.01) dum <- 'OK' else dum <- 'NOK'
a<-table.element(a,dum)
a<-table.row.end(a)
a<-table.row.start(a)
a<-table.element(a,'5% type I error level',header=TRUE)
a<-table.element(a,numsignificant5)
a<-table.element(a,numsignificant5/numgqtests)
if (numsignificant5/numgqtests < 0.05) dum <- 'OK' else dum <- 'NOK'
a<-table.element(a,dum)
a<-table.row.end(a)
a<-table.row.start(a)
a<-table.element(a,'10% type I error level',header=TRUE)
a<-table.element(a,numsignificant10)
a<-table.element(a,numsignificant10/numgqtests)
if (numsignificant10/numgqtests < 0.1) dum <- 'OK' else dum <- 'NOK'
a<-table.element(a,dum)
a<-table.row.end(a)
a<-table.end(a)
table.save(a,file='mytable6.tab')
}