Free Statistics

of Irreproducible Research!

Author's title

Author*The author of this computation has been verified*
R Software Modulerwasp_multipleregression.wasp
Title produced by softwareMultiple Regression
Date of computationSun, 23 Nov 2008 12:40:55 -0700
Cite this page as followsStatistical Computations at FreeStatistics.org, Office for Research Development and Education, URL https://freestatistics.org/blog/index.php?v=date/2008/Nov/23/t12274693016lt2ekcmd5jmmq2.htm/, Retrieved Sun, 19 May 2024 10:41:11 +0000
Statistical Computations at FreeStatistics.org, Office for Research Development and Education, URL https://freestatistics.org/blog/index.php?pk=25323, Retrieved Sun, 19 May 2024 10:41:11 +0000
QR Codes:

Original text written by user:
IsPrivate?No (this computation is public)
User-defined keywords
Estimated Impact123
Family? (F = Feedback message, R = changed R code, M = changed R Module, P = changed Parameters, D = changed Data)
-     [Multiple Regression] [q3b] [2008-11-23 15:51:08] [c5a66f1c8528a963efc2b82a8519f117]
-    D  [Multiple Regression] [Q3 - b] [2008-11-23 18:10:56] [c5a66f1c8528a963efc2b82a8519f117]
F           [Multiple Regression] [Q3 - 5 peaks - b] [2008-11-23 19:40:55] [5f3e73ccf1ddc75508eed47fa51813d3] [Current]
Feedback Forum
2008-11-29 17:13:27 [Stefanie Mertens] [reply
je hebt een goede oplossing gegeven.
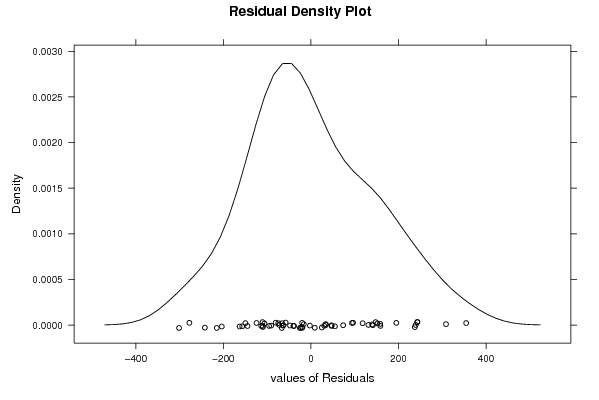
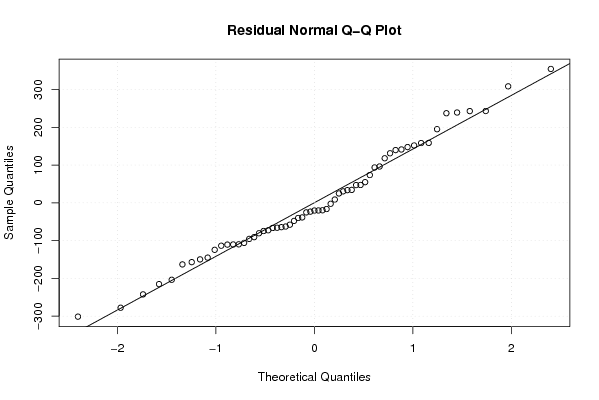
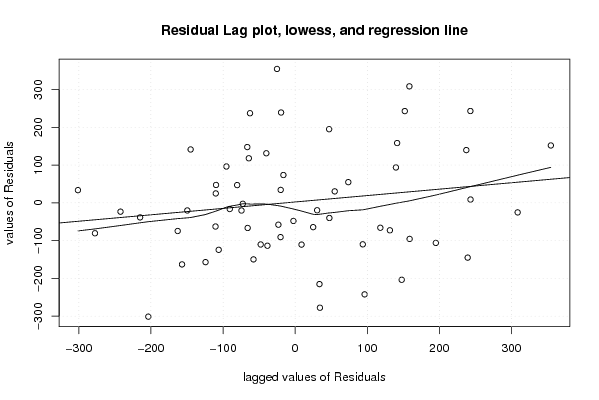
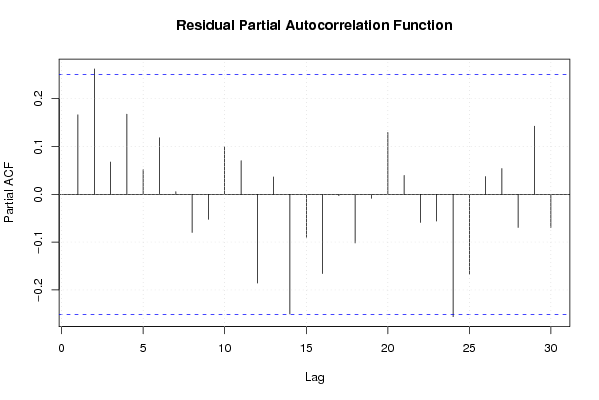
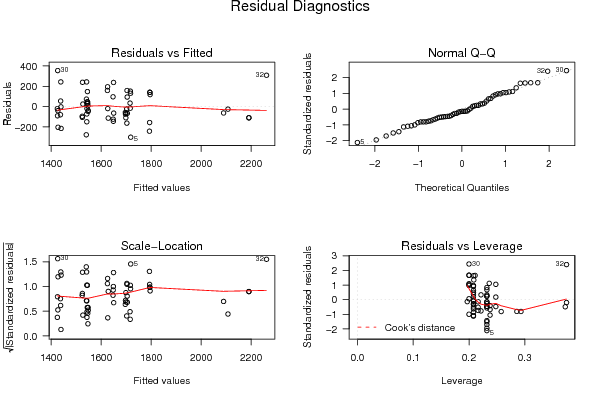
Jouw model is nog niet perfect aangezien je nog van autocorrelatie kan spreken en er nog geen perfecte normaalverdeling is. toch vind ik het histogram al wel heel goed op een normaalverdeling gaat lijken.

jouw dummy is positief. dus als de dummywaarde 1 is zou je een getal moeten bijtellen bij de constante factor.
2008-11-30 17:28:02 [Stijn Loomans] [reply
Je hebt een goede oplossing gezocht voor jouw getallen.
Door dummy's in te geven bij de uitspringers
Het model is nog niet perfect want er is nog sprake van autocorrelatie en de normaalverdeling is nog niet perfect. Maar algemeen gaat het toch de goede weg op.


Post a new message
Dataseries X:
1515	0
1510	0
1225	0
1577	0
1417	0
1224	0
1693	0
1633	0
1639	0
1914	0
1586	0
1552	0
2081	1
1500	0
1437	0
1470	0
1849	0
1387	0
1592	0
1589	0
1798	0
1935	0
1887	0
2027	1
2080	1
1556	0
1682	0
1785	0
1869	0
1781	0
2082	1
2570	1
1862	0
1936	0
1504	0
1765	0
1607	0
1577	0
1493	0
1615	0
1700	0
1335	0
1523	0
1623	0
1540	0
1637	0
1524	0
1419	0
1821	0
1593	0
1357	0
1263	0
1750	0
1405	0
1393	0
1639	0
1679	0
1551	0
1744	0
1429	0
1784	0


Summary of computational transaction
Raw Inputview raw input (R code)
Raw Outputview raw output of R engine
Computing time3 seconds
R Server'Gwilym Jenkins' @ 72.249.127.135

\begin{tabular}{lllllllll}
\hline
Summary of computational transaction \tabularnewline
Raw Input & view raw input (R code)  \tabularnewline
Raw Output & view raw output of R engine  \tabularnewline
Computing time & 3 seconds \tabularnewline
R Server & 'Gwilym Jenkins' @ 72.249.127.135 \tabularnewline
\hline
\end{tabular}
%Source: https://freestatistics.org/blog/index.php?pk=25323&T=0

[TABLE]
[ROW][C]Summary of computational transaction[/C][/ROW]
[ROW][C]Raw Input[/C][C]view raw input (R code) [/C][/ROW]
[ROW][C]Raw Output[/C][C]view raw output of R engine [/C][/ROW]
[ROW][C]Computing time[/C][C]3 seconds[/C][/ROW]
[ROW][C]R Server[/C][C]'Gwilym Jenkins' @ 72.249.127.135[/C][/ROW]
[/TABLE]
Source: https://freestatistics.org/blog/index.php?pk=25323&T=0

Globally Unique Identifier (entire table): ba.freestatistics.org/blog/index.php?pk=25323&T=0

As an alternative you can also use a QR Code:  

The GUIDs for individual cells are displayed in the table below:

Summary of computational transaction
Raw Inputview raw input (R code)
Raw Outputview raw output of R engine
Computing time3 seconds
R Server'Gwilym Jenkins' @ 72.249.127.135


Multiple Linear Regression - Estimated Regression Equation
Gebouwen[t] = + 1527.70085653105 + 563.279443254816Dummy[t] + 100.890970735190M1[t] + 20.912348322627M2[t] -87.4332976445398M3[t] + 15.8210563882938M4[t] + 190.875410421128M5[t] -99.6702355460388M6[t] + 17.9282298358316M7[t] + 172.182583868665M8[t] + 177.692826552462M9[t] + 268.747180585296M10[t] + 123.20153461813M11[t] -0.0543540328337076t + e[t]

\begin{tabular}{lllllllll}
\hline
Multiple Linear Regression - Estimated Regression Equation \tabularnewline
Gebouwen[t] =  +  1527.70085653105 +  563.279443254816Dummy[t] +  100.890970735190M1[t] +  20.912348322627M2[t] -87.4332976445398M3[t] +  15.8210563882938M4[t] +  190.875410421128M5[t] -99.6702355460388M6[t] +  17.9282298358316M7[t] +  172.182583868665M8[t] +  177.692826552462M9[t] +  268.747180585296M10[t] +  123.20153461813M11[t] -0.0543540328337076t  + e[t] \tabularnewline
\hline
\end{tabular}
%Source: https://freestatistics.org/blog/index.php?pk=25323&T=1

[TABLE]
[ROW][C]Multiple Linear Regression - Estimated Regression Equation[/C][/ROW]
[ROW][C]Gebouwen[t] =  +  1527.70085653105 +  563.279443254816Dummy[t] +  100.890970735190M1[t] +  20.912348322627M2[t] -87.4332976445398M3[t] +  15.8210563882938M4[t] +  190.875410421128M5[t] -99.6702355460388M6[t] +  17.9282298358316M7[t] +  172.182583868665M8[t] +  177.692826552462M9[t] +  268.747180585296M10[t] +  123.20153461813M11[t] -0.0543540328337076t  + e[t][/C][/ROW]
[/TABLE]
Source: https://freestatistics.org/blog/index.php?pk=25323&T=1

Globally Unique Identifier (entire table): ba.freestatistics.org/blog/index.php?pk=25323&T=1

As an alternative you can also use a QR Code:  

The GUIDs for individual cells are displayed in the table below:

Multiple Linear Regression - Estimated Regression Equation
Gebouwen[t] = + 1527.70085653105 + 563.279443254816Dummy[t] + 100.890970735190M1[t] + 20.912348322627M2[t] -87.4332976445398M3[t] + 15.8210563882938M4[t] + 190.875410421128M5[t] -99.6702355460388M6[t] + 17.9282298358316M7[t] + 172.182583868665M8[t] + 177.692826552462M9[t] + 268.747180585296M10[t] + 123.20153461813M11[t] -0.0543540328337076t + e[t]


Multiple Linear Regression - Ordinary Least Squares
VariableParameterS.D.T-STATH0: parameter = 02-tail p-value1-tail p-value
(Intercept)1527.7008565310587.53848317.451800
Dummy563.27944325481684.8524116.638300
M1100.89097073519099.0723561.01840.3137220.156861
M220.912348322627105.0689150.1990.8430940.421547
M3-87.4332976445398104.909547-0.83340.4088260.204413
M415.8210563882938104.7639130.1510.8806090.440305
M5190.875410421128104.6320691.82430.0744750.037237
M6-99.6702355460388104.514068-0.95370.3451380.172569
M717.9282298358316102.8844340.17430.8624130.431206
M8172.182583868665102.8203791.67460.1006560.050328
M9177.692826552462104.2435631.70460.0948730.047437
M10268.747180585296104.1813472.57960.0130790.006539
M11123.20153461813104.1331551.18310.2427140.121357
t-0.05435403283370761.209975-0.04490.964360.48218

\begin{tabular}{lllllllll}
\hline
Multiple Linear Regression - Ordinary Least Squares \tabularnewline
Variable & Parameter & S.D. & T-STATH0: parameter = 0 & 2-tail p-value & 1-tail p-value \tabularnewline
(Intercept) & 1527.70085653105 & 87.538483 & 17.4518 & 0 & 0 \tabularnewline
Dummy & 563.279443254816 & 84.852411 & 6.6383 & 0 & 0 \tabularnewline
M1 & 100.890970735190 & 99.072356 & 1.0184 & 0.313722 & 0.156861 \tabularnewline
M2 & 20.912348322627 & 105.068915 & 0.199 & 0.843094 & 0.421547 \tabularnewline
M3 & -87.4332976445398 & 104.909547 & -0.8334 & 0.408826 & 0.204413 \tabularnewline
M4 & 15.8210563882938 & 104.763913 & 0.151 & 0.880609 & 0.440305 \tabularnewline
M5 & 190.875410421128 & 104.632069 & 1.8243 & 0.074475 & 0.037237 \tabularnewline
M6 & -99.6702355460388 & 104.514068 & -0.9537 & 0.345138 & 0.172569 \tabularnewline
M7 & 17.9282298358316 & 102.884434 & 0.1743 & 0.862413 & 0.431206 \tabularnewline
M8 & 172.182583868665 & 102.820379 & 1.6746 & 0.100656 & 0.050328 \tabularnewline
M9 & 177.692826552462 & 104.243563 & 1.7046 & 0.094873 & 0.047437 \tabularnewline
M10 & 268.747180585296 & 104.181347 & 2.5796 & 0.013079 & 0.006539 \tabularnewline
M11 & 123.20153461813 & 104.133155 & 1.1831 & 0.242714 & 0.121357 \tabularnewline
t & -0.0543540328337076 & 1.209975 & -0.0449 & 0.96436 & 0.48218 \tabularnewline
\hline
\end{tabular}
%Source: https://freestatistics.org/blog/index.php?pk=25323&T=2

[TABLE]
[ROW][C]Multiple Linear Regression - Ordinary Least Squares[/C][/ROW]
[ROW][C]Variable[/C][C]Parameter[/C][C]S.D.[/C][C]T-STATH0: parameter = 0[/C][C]2-tail p-value[/C][C]1-tail p-value[/C][/ROW]
[ROW][C](Intercept)[/C][C]1527.70085653105[/C][C]87.538483[/C][C]17.4518[/C][C]0[/C][C]0[/C][/ROW]
[ROW][C]Dummy[/C][C]563.279443254816[/C][C]84.852411[/C][C]6.6383[/C][C]0[/C][C]0[/C][/ROW]
[ROW][C]M1[/C][C]100.890970735190[/C][C]99.072356[/C][C]1.0184[/C][C]0.313722[/C][C]0.156861[/C][/ROW]
[ROW][C]M2[/C][C]20.912348322627[/C][C]105.068915[/C][C]0.199[/C][C]0.843094[/C][C]0.421547[/C][/ROW]
[ROW][C]M3[/C][C]-87.4332976445398[/C][C]104.909547[/C][C]-0.8334[/C][C]0.408826[/C][C]0.204413[/C][/ROW]
[ROW][C]M4[/C][C]15.8210563882938[/C][C]104.763913[/C][C]0.151[/C][C]0.880609[/C][C]0.440305[/C][/ROW]
[ROW][C]M5[/C][C]190.875410421128[/C][C]104.632069[/C][C]1.8243[/C][C]0.074475[/C][C]0.037237[/C][/ROW]
[ROW][C]M6[/C][C]-99.6702355460388[/C][C]104.514068[/C][C]-0.9537[/C][C]0.345138[/C][C]0.172569[/C][/ROW]
[ROW][C]M7[/C][C]17.9282298358316[/C][C]102.884434[/C][C]0.1743[/C][C]0.862413[/C][C]0.431206[/C][/ROW]
[ROW][C]M8[/C][C]172.182583868665[/C][C]102.820379[/C][C]1.6746[/C][C]0.100656[/C][C]0.050328[/C][/ROW]
[ROW][C]M9[/C][C]177.692826552462[/C][C]104.243563[/C][C]1.7046[/C][C]0.094873[/C][C]0.047437[/C][/ROW]
[ROW][C]M10[/C][C]268.747180585296[/C][C]104.181347[/C][C]2.5796[/C][C]0.013079[/C][C]0.006539[/C][/ROW]
[ROW][C]M11[/C][C]123.20153461813[/C][C]104.133155[/C][C]1.1831[/C][C]0.242714[/C][C]0.121357[/C][/ROW]
[ROW][C]t[/C][C]-0.0543540328337076[/C][C]1.209975[/C][C]-0.0449[/C][C]0.96436[/C][C]0.48218[/C][/ROW]
[/TABLE]
Source: https://freestatistics.org/blog/index.php?pk=25323&T=2

Globally Unique Identifier (entire table): ba.freestatistics.org/blog/index.php?pk=25323&T=2

As an alternative you can also use a QR Code:  

The GUIDs for individual cells are displayed in the table below:

Multiple Linear Regression - Ordinary Least Squares
VariableParameterS.D.T-STATH0: parameter = 02-tail p-value1-tail p-value
(Intercept)1527.7008565310587.53848317.451800
Dummy563.27944325481684.8524116.638300
M1100.89097073519099.0723561.01840.3137220.156861
M220.912348322627105.0689150.1990.8430940.421547
M3-87.4332976445398104.909547-0.83340.4088260.204413
M415.8210563882938104.7639130.1510.8806090.440305
M5190.875410421128104.6320691.82430.0744750.037237
M6-99.6702355460388104.514068-0.95370.3451380.172569
M717.9282298358316102.8844340.17430.8624130.431206
M8172.182583868665102.8203791.67460.1006560.050328
M9177.692826552462104.2435631.70460.0948730.047437
M10268.747180585296104.1813472.57960.0130790.006539
M11123.20153461813104.1331551.18310.2427140.121357
t-0.05435403283370761.209975-0.04490.964360.48218


Multiple Linear Regression - Regression Statistics
Multiple R0.800089685202874
R-squared0.640143504368034
Adjusted R-squared0.540608728980469
F-TEST (value)6.43135529140912
F-TEST (DF numerator)13
F-TEST (DF denominator)47
p-value8.85797678540357e-07
Multiple Linear Regression - Residual Statistics
Residual Standard Deviation162.393085798019
Sum Squared Residuals1239461.17280514

\begin{tabular}{lllllllll}
\hline
Multiple Linear Regression - Regression Statistics \tabularnewline
Multiple R & 0.800089685202874 \tabularnewline
R-squared & 0.640143504368034 \tabularnewline
Adjusted R-squared & 0.540608728980469 \tabularnewline
F-TEST (value) & 6.43135529140912 \tabularnewline
F-TEST (DF numerator) & 13 \tabularnewline
F-TEST (DF denominator) & 47 \tabularnewline
p-value & 8.85797678540357e-07 \tabularnewline
Multiple Linear Regression - Residual Statistics \tabularnewline
Residual Standard Deviation & 162.393085798019 \tabularnewline
Sum Squared Residuals & 1239461.17280514 \tabularnewline
\hline
\end{tabular}
%Source: https://freestatistics.org/blog/index.php?pk=25323&T=3

[TABLE]
[ROW][C]Multiple Linear Regression - Regression Statistics[/C][/ROW]
[ROW][C]Multiple R[/C][C]0.800089685202874[/C][/ROW]
[ROW][C]R-squared[/C][C]0.640143504368034[/C][/ROW]
[ROW][C]Adjusted R-squared[/C][C]0.540608728980469[/C][/ROW]
[ROW][C]F-TEST (value)[/C][C]6.43135529140912[/C][/ROW]
[ROW][C]F-TEST (DF numerator)[/C][C]13[/C][/ROW]
[ROW][C]F-TEST (DF denominator)[/C][C]47[/C][/ROW]
[ROW][C]p-value[/C][C]8.85797678540357e-07[/C][/ROW]
[ROW][C]Multiple Linear Regression - Residual Statistics[/C][/ROW]
[ROW][C]Residual Standard Deviation[/C][C]162.393085798019[/C][/ROW]
[ROW][C]Sum Squared Residuals[/C][C]1239461.17280514[/C][/ROW]
[/TABLE]
Source: https://freestatistics.org/blog/index.php?pk=25323&T=3

Globally Unique Identifier (entire table): ba.freestatistics.org/blog/index.php?pk=25323&T=3

As an alternative you can also use a QR Code:  

The GUIDs for individual cells are displayed in the table below:

Multiple Linear Regression - Regression Statistics
Multiple R0.800089685202874
R-squared0.640143504368034
Adjusted R-squared0.540608728980469
F-TEST (value)6.43135529140912
F-TEST (DF numerator)13
F-TEST (DF denominator)47
p-value8.85797678540357e-07
Multiple Linear Regression - Residual Statistics
Residual Standard Deviation162.393085798019
Sum Squared Residuals1239461.17280514


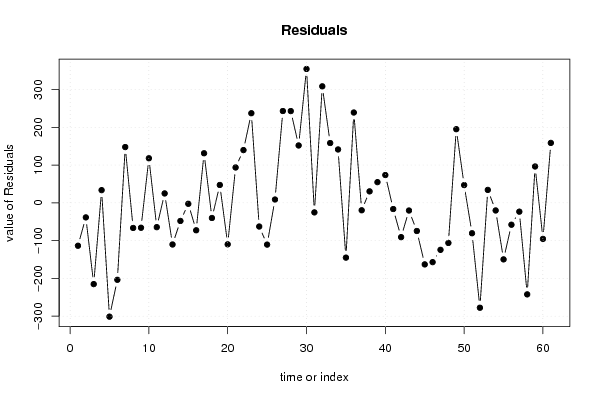
Multiple Linear Regression - Actuals, Interpolation, and Residuals
Time or IndexActualsInterpolationForecastResidualsPrediction Error
115151628.5374732334-113.5374732334
215101548.50449678801-38.5044967880068
312251440.10449678801-215.104496788009
415771543.3044967880133.6955032119909
514171718.30449678801-301.304496788009
612241427.70449678801-203.704496788009
716931545.24860813705147.751391862954
816331699.44860813705-66.4486081370455
916391704.90449678801-65.904496788009
1019141795.90449678801118.095503211991
1115861650.30449678801-64.3044967880089
1215521527.0486081370524.9513918629545
1320812191.16466809422-110.164668094219
1415001547.85224839401-47.8522483940051
1514371439.45224839400-2.45224839400456
1614701542.65224839400-72.6522483940045
1718491717.65224839400131.347751605995
1813871427.05224839400-40.0522483940045
1915921544.5963597430447.4036402569588
2015891698.79635974304-109.796359743041
2117981704.2522483940093.7477516059955
2219351795.25224839400139.747751605995
2318871649.65224839400237.347751605995
2420272089.67580299786-62.6758029978582
2520802190.51241970022-110.512419700215
2615561547.28.79999999999944
2716821438.8243.2
2817851542243
2918691717152
3017811426.4354.6
3120822107.22355460385-25.2235546038539
3225702261.42355460385308.576445396146
3318621703.6158.4
3419361794.6141.4
3515041649-145
3617651525.74411134904239.255888650963
3716071626.58072805139-19.5807280513932
3815771546.5477516060030.4522483940039
3914931438.1477516060054.8522483940044
4016151541.3477516060073.6522483940045
4117001716.34775160600-16.3477516059955
4213351425.74775160600-90.7477516059955
4315231543.29186295503-20.2918629550322
4416231697.49186295503-74.491862955032
4515401702.94775160600-162.947751605995
4616371793.94775160600-156.947751605996
4715241648.34775160600-124.347751605995
4814191525.09186295503-106.091862955032
4918211625.92847965739195.071520342611
5015931545.8955032119947.1044967880084
5113571437.49550321199-80.4955032119911
5212631540.69550321199-277.695503211991
5317501715.6955032119934.3044967880089
5414051425.09550321199-20.095503211991
5513931542.63961456103-149.639614561028
5616391696.83961456103-57.8396145610276
5716791702.29550321199-23.2955032119910
5815511793.29550321199-242.295503211991
5917441647.6955032119996.304496788009
6014291524.43961456103-95.4396145610275
6117841625.27623126338158.723768736616

\begin{tabular}{lllllllll}
\hline
Multiple Linear Regression - Actuals, Interpolation, and Residuals \tabularnewline
Time or Index & Actuals & InterpolationForecast & ResidualsPrediction Error \tabularnewline
1 & 1515 & 1628.5374732334 & -113.5374732334 \tabularnewline
2 & 1510 & 1548.50449678801 & -38.5044967880068 \tabularnewline
3 & 1225 & 1440.10449678801 & -215.104496788009 \tabularnewline
4 & 1577 & 1543.30449678801 & 33.6955032119909 \tabularnewline
5 & 1417 & 1718.30449678801 & -301.304496788009 \tabularnewline
6 & 1224 & 1427.70449678801 & -203.704496788009 \tabularnewline
7 & 1693 & 1545.24860813705 & 147.751391862954 \tabularnewline
8 & 1633 & 1699.44860813705 & -66.4486081370455 \tabularnewline
9 & 1639 & 1704.90449678801 & -65.904496788009 \tabularnewline
10 & 1914 & 1795.90449678801 & 118.095503211991 \tabularnewline
11 & 1586 & 1650.30449678801 & -64.3044967880089 \tabularnewline
12 & 1552 & 1527.04860813705 & 24.9513918629545 \tabularnewline
13 & 2081 & 2191.16466809422 & -110.164668094219 \tabularnewline
14 & 1500 & 1547.85224839401 & -47.8522483940051 \tabularnewline
15 & 1437 & 1439.45224839400 & -2.45224839400456 \tabularnewline
16 & 1470 & 1542.65224839400 & -72.6522483940045 \tabularnewline
17 & 1849 & 1717.65224839400 & 131.347751605995 \tabularnewline
18 & 1387 & 1427.05224839400 & -40.0522483940045 \tabularnewline
19 & 1592 & 1544.59635974304 & 47.4036402569588 \tabularnewline
20 & 1589 & 1698.79635974304 & -109.796359743041 \tabularnewline
21 & 1798 & 1704.25224839400 & 93.7477516059955 \tabularnewline
22 & 1935 & 1795.25224839400 & 139.747751605995 \tabularnewline
23 & 1887 & 1649.65224839400 & 237.347751605995 \tabularnewline
24 & 2027 & 2089.67580299786 & -62.6758029978582 \tabularnewline
25 & 2080 & 2190.51241970022 & -110.512419700215 \tabularnewline
26 & 1556 & 1547.2 & 8.79999999999944 \tabularnewline
27 & 1682 & 1438.8 & 243.2 \tabularnewline
28 & 1785 & 1542 & 243 \tabularnewline
29 & 1869 & 1717 & 152 \tabularnewline
30 & 1781 & 1426.4 & 354.6 \tabularnewline
31 & 2082 & 2107.22355460385 & -25.2235546038539 \tabularnewline
32 & 2570 & 2261.42355460385 & 308.576445396146 \tabularnewline
33 & 1862 & 1703.6 & 158.4 \tabularnewline
34 & 1936 & 1794.6 & 141.4 \tabularnewline
35 & 1504 & 1649 & -145 \tabularnewline
36 & 1765 & 1525.74411134904 & 239.255888650963 \tabularnewline
37 & 1607 & 1626.58072805139 & -19.5807280513932 \tabularnewline
38 & 1577 & 1546.54775160600 & 30.4522483940039 \tabularnewline
39 & 1493 & 1438.14775160600 & 54.8522483940044 \tabularnewline
40 & 1615 & 1541.34775160600 & 73.6522483940045 \tabularnewline
41 & 1700 & 1716.34775160600 & -16.3477516059955 \tabularnewline
42 & 1335 & 1425.74775160600 & -90.7477516059955 \tabularnewline
43 & 1523 & 1543.29186295503 & -20.2918629550322 \tabularnewline
44 & 1623 & 1697.49186295503 & -74.491862955032 \tabularnewline
45 & 1540 & 1702.94775160600 & -162.947751605995 \tabularnewline
46 & 1637 & 1793.94775160600 & -156.947751605996 \tabularnewline
47 & 1524 & 1648.34775160600 & -124.347751605995 \tabularnewline
48 & 1419 & 1525.09186295503 & -106.091862955032 \tabularnewline
49 & 1821 & 1625.92847965739 & 195.071520342611 \tabularnewline
50 & 1593 & 1545.89550321199 & 47.1044967880084 \tabularnewline
51 & 1357 & 1437.49550321199 & -80.4955032119911 \tabularnewline
52 & 1263 & 1540.69550321199 & -277.695503211991 \tabularnewline
53 & 1750 & 1715.69550321199 & 34.3044967880089 \tabularnewline
54 & 1405 & 1425.09550321199 & -20.095503211991 \tabularnewline
55 & 1393 & 1542.63961456103 & -149.639614561028 \tabularnewline
56 & 1639 & 1696.83961456103 & -57.8396145610276 \tabularnewline
57 & 1679 & 1702.29550321199 & -23.2955032119910 \tabularnewline
58 & 1551 & 1793.29550321199 & -242.295503211991 \tabularnewline
59 & 1744 & 1647.69550321199 & 96.304496788009 \tabularnewline
60 & 1429 & 1524.43961456103 & -95.4396145610275 \tabularnewline
61 & 1784 & 1625.27623126338 & 158.723768736616 \tabularnewline
\hline
\end{tabular}
%Source: https://freestatistics.org/blog/index.php?pk=25323&T=4

[TABLE]
[ROW][C]Multiple Linear Regression - Actuals, Interpolation, and Residuals[/C][/ROW]
[ROW][C]Time or Index[/C][C]Actuals[/C][C]InterpolationForecast[/C][C]ResidualsPrediction Error[/C][/ROW]
[ROW][C]1[/C][C]1515[/C][C]1628.5374732334[/C][C]-113.5374732334[/C][/ROW]
[ROW][C]2[/C][C]1510[/C][C]1548.50449678801[/C][C]-38.5044967880068[/C][/ROW]
[ROW][C]3[/C][C]1225[/C][C]1440.10449678801[/C][C]-215.104496788009[/C][/ROW]
[ROW][C]4[/C][C]1577[/C][C]1543.30449678801[/C][C]33.6955032119909[/C][/ROW]
[ROW][C]5[/C][C]1417[/C][C]1718.30449678801[/C][C]-301.304496788009[/C][/ROW]
[ROW][C]6[/C][C]1224[/C][C]1427.70449678801[/C][C]-203.704496788009[/C][/ROW]
[ROW][C]7[/C][C]1693[/C][C]1545.24860813705[/C][C]147.751391862954[/C][/ROW]
[ROW][C]8[/C][C]1633[/C][C]1699.44860813705[/C][C]-66.4486081370455[/C][/ROW]
[ROW][C]9[/C][C]1639[/C][C]1704.90449678801[/C][C]-65.904496788009[/C][/ROW]
[ROW][C]10[/C][C]1914[/C][C]1795.90449678801[/C][C]118.095503211991[/C][/ROW]
[ROW][C]11[/C][C]1586[/C][C]1650.30449678801[/C][C]-64.3044967880089[/C][/ROW]
[ROW][C]12[/C][C]1552[/C][C]1527.04860813705[/C][C]24.9513918629545[/C][/ROW]
[ROW][C]13[/C][C]2081[/C][C]2191.16466809422[/C][C]-110.164668094219[/C][/ROW]
[ROW][C]14[/C][C]1500[/C][C]1547.85224839401[/C][C]-47.8522483940051[/C][/ROW]
[ROW][C]15[/C][C]1437[/C][C]1439.45224839400[/C][C]-2.45224839400456[/C][/ROW]
[ROW][C]16[/C][C]1470[/C][C]1542.65224839400[/C][C]-72.6522483940045[/C][/ROW]
[ROW][C]17[/C][C]1849[/C][C]1717.65224839400[/C][C]131.347751605995[/C][/ROW]
[ROW][C]18[/C][C]1387[/C][C]1427.05224839400[/C][C]-40.0522483940045[/C][/ROW]
[ROW][C]19[/C][C]1592[/C][C]1544.59635974304[/C][C]47.4036402569588[/C][/ROW]
[ROW][C]20[/C][C]1589[/C][C]1698.79635974304[/C][C]-109.796359743041[/C][/ROW]
[ROW][C]21[/C][C]1798[/C][C]1704.25224839400[/C][C]93.7477516059955[/C][/ROW]
[ROW][C]22[/C][C]1935[/C][C]1795.25224839400[/C][C]139.747751605995[/C][/ROW]
[ROW][C]23[/C][C]1887[/C][C]1649.65224839400[/C][C]237.347751605995[/C][/ROW]
[ROW][C]24[/C][C]2027[/C][C]2089.67580299786[/C][C]-62.6758029978582[/C][/ROW]
[ROW][C]25[/C][C]2080[/C][C]2190.51241970022[/C][C]-110.512419700215[/C][/ROW]
[ROW][C]26[/C][C]1556[/C][C]1547.2[/C][C]8.79999999999944[/C][/ROW]
[ROW][C]27[/C][C]1682[/C][C]1438.8[/C][C]243.2[/C][/ROW]
[ROW][C]28[/C][C]1785[/C][C]1542[/C][C]243[/C][/ROW]
[ROW][C]29[/C][C]1869[/C][C]1717[/C][C]152[/C][/ROW]
[ROW][C]30[/C][C]1781[/C][C]1426.4[/C][C]354.6[/C][/ROW]
[ROW][C]31[/C][C]2082[/C][C]2107.22355460385[/C][C]-25.2235546038539[/C][/ROW]
[ROW][C]32[/C][C]2570[/C][C]2261.42355460385[/C][C]308.576445396146[/C][/ROW]
[ROW][C]33[/C][C]1862[/C][C]1703.6[/C][C]158.4[/C][/ROW]
[ROW][C]34[/C][C]1936[/C][C]1794.6[/C][C]141.4[/C][/ROW]
[ROW][C]35[/C][C]1504[/C][C]1649[/C][C]-145[/C][/ROW]
[ROW][C]36[/C][C]1765[/C][C]1525.74411134904[/C][C]239.255888650963[/C][/ROW]
[ROW][C]37[/C][C]1607[/C][C]1626.58072805139[/C][C]-19.5807280513932[/C][/ROW]
[ROW][C]38[/C][C]1577[/C][C]1546.54775160600[/C][C]30.4522483940039[/C][/ROW]
[ROW][C]39[/C][C]1493[/C][C]1438.14775160600[/C][C]54.8522483940044[/C][/ROW]
[ROW][C]40[/C][C]1615[/C][C]1541.34775160600[/C][C]73.6522483940045[/C][/ROW]
[ROW][C]41[/C][C]1700[/C][C]1716.34775160600[/C][C]-16.3477516059955[/C][/ROW]
[ROW][C]42[/C][C]1335[/C][C]1425.74775160600[/C][C]-90.7477516059955[/C][/ROW]
[ROW][C]43[/C][C]1523[/C][C]1543.29186295503[/C][C]-20.2918629550322[/C][/ROW]
[ROW][C]44[/C][C]1623[/C][C]1697.49186295503[/C][C]-74.491862955032[/C][/ROW]
[ROW][C]45[/C][C]1540[/C][C]1702.94775160600[/C][C]-162.947751605995[/C][/ROW]
[ROW][C]46[/C][C]1637[/C][C]1793.94775160600[/C][C]-156.947751605996[/C][/ROW]
[ROW][C]47[/C][C]1524[/C][C]1648.34775160600[/C][C]-124.347751605995[/C][/ROW]
[ROW][C]48[/C][C]1419[/C][C]1525.09186295503[/C][C]-106.091862955032[/C][/ROW]
[ROW][C]49[/C][C]1821[/C][C]1625.92847965739[/C][C]195.071520342611[/C][/ROW]
[ROW][C]50[/C][C]1593[/C][C]1545.89550321199[/C][C]47.1044967880084[/C][/ROW]
[ROW][C]51[/C][C]1357[/C][C]1437.49550321199[/C][C]-80.4955032119911[/C][/ROW]
[ROW][C]52[/C][C]1263[/C][C]1540.69550321199[/C][C]-277.695503211991[/C][/ROW]
[ROW][C]53[/C][C]1750[/C][C]1715.69550321199[/C][C]34.3044967880089[/C][/ROW]
[ROW][C]54[/C][C]1405[/C][C]1425.09550321199[/C][C]-20.095503211991[/C][/ROW]
[ROW][C]55[/C][C]1393[/C][C]1542.63961456103[/C][C]-149.639614561028[/C][/ROW]
[ROW][C]56[/C][C]1639[/C][C]1696.83961456103[/C][C]-57.8396145610276[/C][/ROW]
[ROW][C]57[/C][C]1679[/C][C]1702.29550321199[/C][C]-23.2955032119910[/C][/ROW]
[ROW][C]58[/C][C]1551[/C][C]1793.29550321199[/C][C]-242.295503211991[/C][/ROW]
[ROW][C]59[/C][C]1744[/C][C]1647.69550321199[/C][C]96.304496788009[/C][/ROW]
[ROW][C]60[/C][C]1429[/C][C]1524.43961456103[/C][C]-95.4396145610275[/C][/ROW]
[ROW][C]61[/C][C]1784[/C][C]1625.27623126338[/C][C]158.723768736616[/C][/ROW]
[/TABLE]
Source: https://freestatistics.org/blog/index.php?pk=25323&T=4

Globally Unique Identifier (entire table): ba.freestatistics.org/blog/index.php?pk=25323&T=4

As an alternative you can also use a QR Code:  

The GUIDs for individual cells are displayed in the table below:

Multiple Linear Regression - Actuals, Interpolation, and Residuals
Time or IndexActualsInterpolationForecastResidualsPrediction Error
115151628.5374732334-113.5374732334
215101548.50449678801-38.5044967880068
312251440.10449678801-215.104496788009
415771543.3044967880133.6955032119909
514171718.30449678801-301.304496788009
612241427.70449678801-203.704496788009
716931545.24860813705147.751391862954
816331699.44860813705-66.4486081370455
916391704.90449678801-65.904496788009
1019141795.90449678801118.095503211991
1115861650.30449678801-64.3044967880089
1215521527.0486081370524.9513918629545
1320812191.16466809422-110.164668094219
1415001547.85224839401-47.8522483940051
1514371439.45224839400-2.45224839400456
1614701542.65224839400-72.6522483940045
1718491717.65224839400131.347751605995
1813871427.05224839400-40.0522483940045
1915921544.5963597430447.4036402569588
2015891698.79635974304-109.796359743041
2117981704.2522483940093.7477516059955
2219351795.25224839400139.747751605995
2318871649.65224839400237.347751605995
2420272089.67580299786-62.6758029978582
2520802190.51241970022-110.512419700215
2615561547.28.79999999999944
2716821438.8243.2
2817851542243
2918691717152
3017811426.4354.6
3120822107.22355460385-25.2235546038539
3225702261.42355460385308.576445396146
3318621703.6158.4
3419361794.6141.4
3515041649-145
3617651525.74411134904239.255888650963
3716071626.58072805139-19.5807280513932
3815771546.5477516060030.4522483940039
3914931438.1477516060054.8522483940044
4016151541.3477516060073.6522483940045
4117001716.34775160600-16.3477516059955
4213351425.74775160600-90.7477516059955
4315231543.29186295503-20.2918629550322
4416231697.49186295503-74.491862955032
4515401702.94775160600-162.947751605995
4616371793.94775160600-156.947751605996
4715241648.34775160600-124.347751605995
4814191525.09186295503-106.091862955032
4918211625.92847965739195.071520342611
5015931545.8955032119947.1044967880084
5113571437.49550321199-80.4955032119911
5212631540.69550321199-277.695503211991
5317501715.6955032119934.3044967880089
5414051425.09550321199-20.095503211991
5513931542.63961456103-149.639614561028
5616391696.83961456103-57.8396145610276
5716791702.29550321199-23.2955032119910
5815511793.29550321199-242.295503211991
5917441647.6955032119996.304496788009
6014291524.43961456103-95.4396145610275
6117841625.27623126338158.723768736616


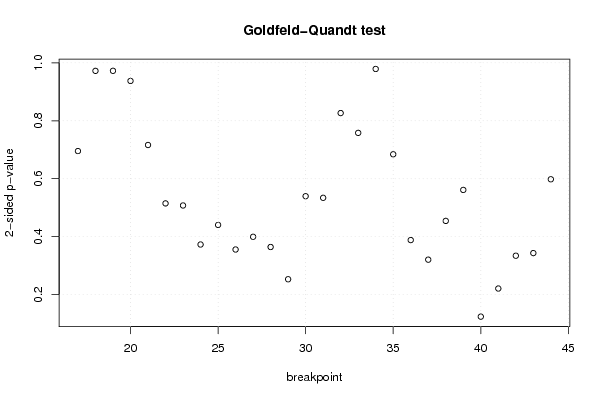
Goldfeld-Quandt test for Heteroskedasticity
p-valuesAlternative Hypothesis
breakpoint indexgreater2-sidedless
170.6522107649444330.6955784701111340.347789235055567
180.5137785201440930.9724429597118140.486221479855907
190.4862591039181970.9725182078363930.513740896081803
200.4688512182854890.9377024365709770.531148781714511
210.358235175500980.716470351001960.64176482449902
220.2574318206861730.5148636413723450.742568179313827
230.253837669044770.507675338089540.74616233095523
240.1864431862243090.3728863724486170.813556813775691
250.2202096313863220.4404192627726440.779790368613678
260.1778130589850610.3556261179701230.822186941014938
270.1997760491950230.3995520983900460.800223950804977
280.1821400191880660.3642800383761310.817859980811934
290.1264725590376340.2529451180752670.873527440962366
300.2698184477298810.5396368954597620.730181552270119
310.2670699928779380.5341399857558770.732930007122062
320.4133597339520950.826719467904190.586640266047905
330.3791468011016410.7582936022032830.620853198898359
340.5104859427412560.9790281145174880.489514057258744
350.6578058094776710.6843883810446570.342194190522329
360.805902360208720.3881952795825590.194097639791280
370.8397219590219060.3205560819561890.160278040978094
380.7728006363486090.4543987273027830.227199363651391
390.719308495216180.5613830095676390.280691504783820
400.9380916826409380.1238166347181240.0619083173590618
410.8895341041314760.2209317917370480.110465895868524
420.8329281315979180.3341437368041640.167071868402082
430.8283527449417280.3432945101165440.171647255058272
440.7009151057004640.5981697885990730.299084894299536

\begin{tabular}{lllllllll}
\hline
Goldfeld-Quandt test for Heteroskedasticity \tabularnewline
p-values & Alternative Hypothesis \tabularnewline
breakpoint index & greater & 2-sided & less \tabularnewline
17 & 0.652210764944433 & 0.695578470111134 & 0.347789235055567 \tabularnewline
18 & 0.513778520144093 & 0.972442959711814 & 0.486221479855907 \tabularnewline
19 & 0.486259103918197 & 0.972518207836393 & 0.513740896081803 \tabularnewline
20 & 0.468851218285489 & 0.937702436570977 & 0.531148781714511 \tabularnewline
21 & 0.35823517550098 & 0.71647035100196 & 0.64176482449902 \tabularnewline
22 & 0.257431820686173 & 0.514863641372345 & 0.742568179313827 \tabularnewline
23 & 0.25383766904477 & 0.50767533808954 & 0.74616233095523 \tabularnewline
24 & 0.186443186224309 & 0.372886372448617 & 0.813556813775691 \tabularnewline
25 & 0.220209631386322 & 0.440419262772644 & 0.779790368613678 \tabularnewline
26 & 0.177813058985061 & 0.355626117970123 & 0.822186941014938 \tabularnewline
27 & 0.199776049195023 & 0.399552098390046 & 0.800223950804977 \tabularnewline
28 & 0.182140019188066 & 0.364280038376131 & 0.817859980811934 \tabularnewline
29 & 0.126472559037634 & 0.252945118075267 & 0.873527440962366 \tabularnewline
30 & 0.269818447729881 & 0.539636895459762 & 0.730181552270119 \tabularnewline
31 & 0.267069992877938 & 0.534139985755877 & 0.732930007122062 \tabularnewline
32 & 0.413359733952095 & 0.82671946790419 & 0.586640266047905 \tabularnewline
33 & 0.379146801101641 & 0.758293602203283 & 0.620853198898359 \tabularnewline
34 & 0.510485942741256 & 0.979028114517488 & 0.489514057258744 \tabularnewline
35 & 0.657805809477671 & 0.684388381044657 & 0.342194190522329 \tabularnewline
36 & 0.80590236020872 & 0.388195279582559 & 0.194097639791280 \tabularnewline
37 & 0.839721959021906 & 0.320556081956189 & 0.160278040978094 \tabularnewline
38 & 0.772800636348609 & 0.454398727302783 & 0.227199363651391 \tabularnewline
39 & 0.71930849521618 & 0.561383009567639 & 0.280691504783820 \tabularnewline
40 & 0.938091682640938 & 0.123816634718124 & 0.0619083173590618 \tabularnewline
41 & 0.889534104131476 & 0.220931791737048 & 0.110465895868524 \tabularnewline
42 & 0.832928131597918 & 0.334143736804164 & 0.167071868402082 \tabularnewline
43 & 0.828352744941728 & 0.343294510116544 & 0.171647255058272 \tabularnewline
44 & 0.700915105700464 & 0.598169788599073 & 0.299084894299536 \tabularnewline
\hline
\end{tabular}
%Source: https://freestatistics.org/blog/index.php?pk=25323&T=5

[TABLE]
[ROW][C]Goldfeld-Quandt test for Heteroskedasticity[/C][/ROW]
[ROW][C]p-values[/C][C]Alternative Hypothesis[/C][/ROW]
[ROW][C]breakpoint index[/C][C]greater[/C][C]2-sided[/C][C]less[/C][/ROW]
[ROW][C]17[/C][C]0.652210764944433[/C][C]0.695578470111134[/C][C]0.347789235055567[/C][/ROW]
[ROW][C]18[/C][C]0.513778520144093[/C][C]0.972442959711814[/C][C]0.486221479855907[/C][/ROW]
[ROW][C]19[/C][C]0.486259103918197[/C][C]0.972518207836393[/C][C]0.513740896081803[/C][/ROW]
[ROW][C]20[/C][C]0.468851218285489[/C][C]0.937702436570977[/C][C]0.531148781714511[/C][/ROW]
[ROW][C]21[/C][C]0.35823517550098[/C][C]0.71647035100196[/C][C]0.64176482449902[/C][/ROW]
[ROW][C]22[/C][C]0.257431820686173[/C][C]0.514863641372345[/C][C]0.742568179313827[/C][/ROW]
[ROW][C]23[/C][C]0.25383766904477[/C][C]0.50767533808954[/C][C]0.74616233095523[/C][/ROW]
[ROW][C]24[/C][C]0.186443186224309[/C][C]0.372886372448617[/C][C]0.813556813775691[/C][/ROW]
[ROW][C]25[/C][C]0.220209631386322[/C][C]0.440419262772644[/C][C]0.779790368613678[/C][/ROW]
[ROW][C]26[/C][C]0.177813058985061[/C][C]0.355626117970123[/C][C]0.822186941014938[/C][/ROW]
[ROW][C]27[/C][C]0.199776049195023[/C][C]0.399552098390046[/C][C]0.800223950804977[/C][/ROW]
[ROW][C]28[/C][C]0.182140019188066[/C][C]0.364280038376131[/C][C]0.817859980811934[/C][/ROW]
[ROW][C]29[/C][C]0.126472559037634[/C][C]0.252945118075267[/C][C]0.873527440962366[/C][/ROW]
[ROW][C]30[/C][C]0.269818447729881[/C][C]0.539636895459762[/C][C]0.730181552270119[/C][/ROW]
[ROW][C]31[/C][C]0.267069992877938[/C][C]0.534139985755877[/C][C]0.732930007122062[/C][/ROW]
[ROW][C]32[/C][C]0.413359733952095[/C][C]0.82671946790419[/C][C]0.586640266047905[/C][/ROW]
[ROW][C]33[/C][C]0.379146801101641[/C][C]0.758293602203283[/C][C]0.620853198898359[/C][/ROW]
[ROW][C]34[/C][C]0.510485942741256[/C][C]0.979028114517488[/C][C]0.489514057258744[/C][/ROW]
[ROW][C]35[/C][C]0.657805809477671[/C][C]0.684388381044657[/C][C]0.342194190522329[/C][/ROW]
[ROW][C]36[/C][C]0.80590236020872[/C][C]0.388195279582559[/C][C]0.194097639791280[/C][/ROW]
[ROW][C]37[/C][C]0.839721959021906[/C][C]0.320556081956189[/C][C]0.160278040978094[/C][/ROW]
[ROW][C]38[/C][C]0.772800636348609[/C][C]0.454398727302783[/C][C]0.227199363651391[/C][/ROW]
[ROW][C]39[/C][C]0.71930849521618[/C][C]0.561383009567639[/C][C]0.280691504783820[/C][/ROW]
[ROW][C]40[/C][C]0.938091682640938[/C][C]0.123816634718124[/C][C]0.0619083173590618[/C][/ROW]
[ROW][C]41[/C][C]0.889534104131476[/C][C]0.220931791737048[/C][C]0.110465895868524[/C][/ROW]
[ROW][C]42[/C][C]0.832928131597918[/C][C]0.334143736804164[/C][C]0.167071868402082[/C][/ROW]
[ROW][C]43[/C][C]0.828352744941728[/C][C]0.343294510116544[/C][C]0.171647255058272[/C][/ROW]
[ROW][C]44[/C][C]0.700915105700464[/C][C]0.598169788599073[/C][C]0.299084894299536[/C][/ROW]
[/TABLE]
Source: https://freestatistics.org/blog/index.php?pk=25323&T=5

Globally Unique Identifier (entire table): ba.freestatistics.org/blog/index.php?pk=25323&T=5

As an alternative you can also use a QR Code:  

The GUIDs for individual cells are displayed in the table below:

Goldfeld-Quandt test for Heteroskedasticity
p-valuesAlternative Hypothesis
breakpoint indexgreater2-sidedless
170.6522107649444330.6955784701111340.347789235055567
180.5137785201440930.9724429597118140.486221479855907
190.4862591039181970.9725182078363930.513740896081803
200.4688512182854890.9377024365709770.531148781714511
210.358235175500980.716470351001960.64176482449902
220.2574318206861730.5148636413723450.742568179313827
230.253837669044770.507675338089540.74616233095523
240.1864431862243090.3728863724486170.813556813775691
250.2202096313863220.4404192627726440.779790368613678
260.1778130589850610.3556261179701230.822186941014938
270.1997760491950230.3995520983900460.800223950804977
280.1821400191880660.3642800383761310.817859980811934
290.1264725590376340.2529451180752670.873527440962366
300.2698184477298810.5396368954597620.730181552270119
310.2670699928779380.5341399857558770.732930007122062
320.4133597339520950.826719467904190.586640266047905
330.3791468011016410.7582936022032830.620853198898359
340.5104859427412560.9790281145174880.489514057258744
350.6578058094776710.6843883810446570.342194190522329
360.805902360208720.3881952795825590.194097639791280
370.8397219590219060.3205560819561890.160278040978094
380.7728006363486090.4543987273027830.227199363651391
390.719308495216180.5613830095676390.280691504783820
400.9380916826409380.1238166347181240.0619083173590618
410.8895341041314760.2209317917370480.110465895868524
420.8329281315979180.3341437368041640.167071868402082
430.8283527449417280.3432945101165440.171647255058272
440.7009151057004640.5981697885990730.299084894299536


Meta Analysis of Goldfeld-Quandt test for Heteroskedasticity
Description# significant tests% significant testsOK/NOK
1% type I error level00OK
5% type I error level00OK
10% type I error level00OK

\begin{tabular}{lllllllll}
\hline
Meta Analysis of Goldfeld-Quandt test for Heteroskedasticity \tabularnewline
Description & # significant tests & % significant tests & OK/NOK \tabularnewline
1% type I error level & 0 & 0 & OK \tabularnewline
5% type I error level & 0 & 0 & OK \tabularnewline
10% type I error level & 0 & 0 & OK \tabularnewline
\hline
\end{tabular}
%Source: https://freestatistics.org/blog/index.php?pk=25323&T=6

[TABLE]
[ROW][C]Meta Analysis of Goldfeld-Quandt test for Heteroskedasticity[/C][/ROW]
[ROW][C]Description[/C][C]# significant tests[/C][C]% significant tests[/C][C]OK/NOK[/C][/ROW]
[ROW][C]1% type I error level[/C][C]0[/C][C]0[/C][C]OK[/C][/ROW]
[ROW][C]5% type I error level[/C][C]0[/C][C]0[/C][C]OK[/C][/ROW]
[ROW][C]10% type I error level[/C][C]0[/C][C]0[/C][C]OK[/C][/ROW]
[/TABLE]
Source: https://freestatistics.org/blog/index.php?pk=25323&T=6

Globally Unique Identifier (entire table): ba.freestatistics.org/blog/index.php?pk=25323&T=6

As an alternative you can also use a QR Code:  

The GUIDs for individual cells are displayed in the table below:

Meta Analysis of Goldfeld-Quandt test for Heteroskedasticity
Description# significant tests% significant testsOK/NOK
1% type I error level00OK
5% type I error level00OK
10% type I error level00OK


Parameters (Session):
par1 = 1 ; par2 = Include Monthly Dummies ; par3 = Linear Trend ;
Parameters (R input):
par1 = 1 ; par2 = Include Monthly Dummies ; par3 = Linear Trend ;
R code (references can be found in the software module):
library(lattice)
library(lmtest)
n25 <- 25 #minimum number of obs. for Goldfeld-Quandt test
par1 <- as.numeric(par1)
x <- t(y)
k <- length(x[1,])
n <- length(x[,1])
x1 <- cbind(x[,par1], x[,1:k!=par1])
mycolnames <- c(colnames(x)[par1], colnames(x)[1:k!=par1])
colnames(x1) <- mycolnames #colnames(x)[par1]
x <- x1
if (par3 == 'First Differences'){
x2 <- array(0, dim=c(n-1,k), dimnames=list(1:(n-1), paste('(1-B)',colnames(x),sep='')))
for (i in 1:n-1) {
for (j in 1:k) {
x2[i,j] <- x[i+1,j] - x[i,j]
}
}
x <- x2
}
if (par2 == 'Include Monthly Dummies'){
x2 <- array(0, dim=c(n,11), dimnames=list(1:n, paste('M', seq(1:11), sep ='')))
for (i in 1:11){
x2[seq(i,n,12),i] <- 1
}
x <- cbind(x, x2)
}
if (par2 == 'Include Quarterly Dummies'){
x2 <- array(0, dim=c(n,3), dimnames=list(1:n, paste('Q', seq(1:3), sep ='')))
for (i in 1:3){
x2[seq(i,n,4),i] <- 1
}
x <- cbind(x, x2)
}
k <- length(x[1,])
if (par3 == 'Linear Trend'){
x <- cbind(x, c(1:n))
colnames(x)[k+1] <- 't'
}
x
k <- length(x[1,])
df <- as.data.frame(x)
(mylm <- lm(df))
(mysum <- summary(mylm))
if (n > n25) {
kp3 <- k + 3
nmkm3 <- n - k - 3
gqarr <- array(NA, dim=c(nmkm3-kp3+1,3))
numgqtests <- 0
numsignificant1 <- 0
numsignificant5 <- 0
numsignificant10 <- 0
for (mypoint in kp3:nmkm3) {
j <- 0
numgqtests <- numgqtests + 1
for (myalt in c('greater', 'two.sided', 'less')) {
j <- j + 1
gqarr[mypoint-kp3+1,j] <- gqtest(mylm, point=mypoint, alternative=myalt)$p.value
}
if (gqarr[mypoint-kp3+1,2] < 0.01) numsignificant1 <- numsignificant1 + 1
if (gqarr[mypoint-kp3+1,2] < 0.05) numsignificant5 <- numsignificant5 + 1
if (gqarr[mypoint-kp3+1,2] < 0.10) numsignificant10 <- numsignificant10 + 1
}
gqarr
}
bitmap(file='test0.png')
plot(x[,1], type='l', main='Actuals and Interpolation', ylab='value of Actuals and Interpolation (dots)', xlab='time or index')
points(x[,1]-mysum$resid)
grid()
dev.off()
bitmap(file='test1.png')
plot(mysum$resid, type='b', pch=19, main='Residuals', ylab='value of Residuals', xlab='time or index')
grid()
dev.off()
bitmap(file='test2.png')
hist(mysum$resid, main='Residual Histogram', xlab='values of Residuals')
grid()
dev.off()
bitmap(file='test3.png')
densityplot(~mysum$resid,col='black',main='Residual Density Plot', xlab='values of Residuals')
dev.off()
bitmap(file='test4.png')
qqnorm(mysum$resid, main='Residual Normal Q-Q Plot')
qqline(mysum$resid)
grid()
dev.off()
(myerror <- as.ts(mysum$resid))
bitmap(file='test5.png')
dum <- cbind(lag(myerror,k=1),myerror)
dum
dum1 <- dum[2:length(myerror),]
dum1
z <- as.data.frame(dum1)
z
plot(z,main=paste('Residual Lag plot, lowess, and regression line'), ylab='values of Residuals', xlab='lagged values of Residuals')
lines(lowess(z))
abline(lm(z))
grid()
dev.off()
bitmap(file='test6.png')
acf(mysum$resid, lag.max=length(mysum$resid)/2, main='Residual Autocorrelation Function')
grid()
dev.off()
bitmap(file='test7.png')
pacf(mysum$resid, lag.max=length(mysum$resid)/2, main='Residual Partial Autocorrelation Function')
grid()
dev.off()
bitmap(file='test8.png')
opar <- par(mfrow = c(2,2), oma = c(0, 0, 1.1, 0))
plot(mylm, las = 1, sub='Residual Diagnostics')
par(opar)
dev.off()
if (n > n25) {
bitmap(file='test9.png')
plot(kp3:nmkm3,gqarr[,2], main='Goldfeld-Quandt test',ylab='2-sided p-value',xlab='breakpoint')
grid()
dev.off()
}
load(file='createtable')
a<-table.start()
a<-table.row.start(a)
a<-table.element(a, 'Multiple Linear Regression - Estimated Regression Equation', 1, TRUE)
a<-table.row.end(a)
myeq <- colnames(x)[1]
myeq <- paste(myeq, '[t] = ', sep='')
for (i in 1:k){
if (mysum$coefficients[i,1] > 0) myeq <- paste(myeq, '+', '')
myeq <- paste(myeq, mysum$coefficients[i,1], sep=' ')
if (rownames(mysum$coefficients)[i] != '(Intercept)') {
myeq <- paste(myeq, rownames(mysum$coefficients)[i], sep='')
if (rownames(mysum$coefficients)[i] != 't') myeq <- paste(myeq, '[t]', sep='')
}
}
myeq <- paste(myeq, ' + e[t]')
a<-table.row.start(a)
a<-table.element(a, myeq)
a<-table.row.end(a)
a<-table.end(a)
table.save(a,file='mytable1.tab')
a<-table.start()
a<-table.row.start(a)
a<-table.element(a,hyperlink('ols1.htm','Multiple Linear Regression - Ordinary Least Squares',''), 6, TRUE)
a<-table.row.end(a)
a<-table.row.start(a)
a<-table.element(a,'Variable',header=TRUE)
a<-table.element(a,'Parameter',header=TRUE)
a<-table.element(a,'S.D.',header=TRUE)
a<-table.element(a,'T-STAT
H0: parameter = 0',header=TRUE)
a<-table.element(a,'2-tail p-value',header=TRUE)
a<-table.element(a,'1-tail p-value',header=TRUE)
a<-table.row.end(a)
for (i in 1:k){
a<-table.row.start(a)
a<-table.element(a,rownames(mysum$coefficients)[i],header=TRUE)
a<-table.element(a,mysum$coefficients[i,1])
a<-table.element(a, round(mysum$coefficients[i,2],6))
a<-table.element(a, round(mysum$coefficients[i,3],4))
a<-table.element(a, round(mysum$coefficients[i,4],6))
a<-table.element(a, round(mysum$coefficients[i,4]/2,6))
a<-table.row.end(a)
}
a<-table.end(a)
table.save(a,file='mytable2.tab')
a<-table.start()
a<-table.row.start(a)
a<-table.element(a, 'Multiple Linear Regression - Regression Statistics', 2, TRUE)
a<-table.row.end(a)
a<-table.row.start(a)
a<-table.element(a, 'Multiple R',1,TRUE)
a<-table.element(a, sqrt(mysum$r.squared))
a<-table.row.end(a)
a<-table.row.start(a)
a<-table.element(a, 'R-squared',1,TRUE)
a<-table.element(a, mysum$r.squared)
a<-table.row.end(a)
a<-table.row.start(a)
a<-table.element(a, 'Adjusted R-squared',1,TRUE)
a<-table.element(a, mysum$adj.r.squared)
a<-table.row.end(a)
a<-table.row.start(a)
a<-table.element(a, 'F-TEST (value)',1,TRUE)
a<-table.element(a, mysum$fstatistic[1])
a<-table.row.end(a)
a<-table.row.start(a)
a<-table.element(a, 'F-TEST (DF numerator)',1,TRUE)
a<-table.element(a, mysum$fstatistic[2])
a<-table.row.end(a)
a<-table.row.start(a)
a<-table.element(a, 'F-TEST (DF denominator)',1,TRUE)
a<-table.element(a, mysum$fstatistic[3])
a<-table.row.end(a)
a<-table.row.start(a)
a<-table.element(a, 'p-value',1,TRUE)
a<-table.element(a, 1-pf(mysum$fstatistic[1],mysum$fstatistic[2],mysum$fstatistic[3]))
a<-table.row.end(a)
a<-table.row.start(a)
a<-table.element(a, 'Multiple Linear Regression - Residual Statistics', 2, TRUE)
a<-table.row.end(a)
a<-table.row.start(a)
a<-table.element(a, 'Residual Standard Deviation',1,TRUE)
a<-table.element(a, mysum$sigma)
a<-table.row.end(a)
a<-table.row.start(a)
a<-table.element(a, 'Sum Squared Residuals',1,TRUE)
a<-table.element(a, sum(myerror*myerror))
a<-table.row.end(a)
a<-table.end(a)
table.save(a,file='mytable3.tab')
a<-table.start()
a<-table.row.start(a)
a<-table.element(a, 'Multiple Linear Regression - Actuals, Interpolation, and Residuals', 4, TRUE)
a<-table.row.end(a)
a<-table.row.start(a)
a<-table.element(a, 'Time or Index', 1, TRUE)
a<-table.element(a, 'Actuals', 1, TRUE)
a<-table.element(a, 'Interpolation
Forecast', 1, TRUE)
a<-table.element(a, 'Residuals
Prediction Error', 1, TRUE)
a<-table.row.end(a)
for (i in 1:n) {
a<-table.row.start(a)
a<-table.element(a,i, 1, TRUE)
a<-table.element(a,x[i])
a<-table.element(a,x[i]-mysum$resid[i])
a<-table.element(a,mysum$resid[i])
a<-table.row.end(a)
}
a<-table.end(a)
table.save(a,file='mytable4.tab')
if (n > n25) {
a<-table.start()
a<-table.row.start(a)
a<-table.element(a,'Goldfeld-Quandt test for Heteroskedasticity',4,TRUE)
a<-table.row.end(a)
a<-table.row.start(a)
a<-table.element(a,'p-values',header=TRUE)
a<-table.element(a,'Alternative Hypothesis',3,header=TRUE)
a<-table.row.end(a)
a<-table.row.start(a)
a<-table.element(a,'breakpoint index',header=TRUE)
a<-table.element(a,'greater',header=TRUE)
a<-table.element(a,'2-sided',header=TRUE)
a<-table.element(a,'less',header=TRUE)
a<-table.row.end(a)
for (mypoint in kp3:nmkm3) {
a<-table.row.start(a)
a<-table.element(a,mypoint,header=TRUE)
a<-table.element(a,gqarr[mypoint-kp3+1,1])
a<-table.element(a,gqarr[mypoint-kp3+1,2])
a<-table.element(a,gqarr[mypoint-kp3+1,3])
a<-table.row.end(a)
}
a<-table.end(a)
table.save(a,file='mytable5.tab')
a<-table.start()
a<-table.row.start(a)
a<-table.element(a,'Meta Analysis of Goldfeld-Quandt test for Heteroskedasticity',4,TRUE)
a<-table.row.end(a)
a<-table.row.start(a)
a<-table.element(a,'Description',header=TRUE)
a<-table.element(a,'# significant tests',header=TRUE)
a<-table.element(a,'% significant tests',header=TRUE)
a<-table.element(a,'OK/NOK',header=TRUE)
a<-table.row.end(a)
a<-table.row.start(a)
a<-table.element(a,'1% type I error level',header=TRUE)
a<-table.element(a,numsignificant1)
a<-table.element(a,numsignificant1/numgqtests)
if (numsignificant1/numgqtests < 0.01) dum <- 'OK' else dum <- 'NOK'
a<-table.element(a,dum)
a<-table.row.end(a)
a<-table.row.start(a)
a<-table.element(a,'5% type I error level',header=TRUE)
a<-table.element(a,numsignificant5)
a<-table.element(a,numsignificant5/numgqtests)
if (numsignificant5/numgqtests < 0.05) dum <- 'OK' else dum <- 'NOK'
a<-table.element(a,dum)
a<-table.row.end(a)
a<-table.row.start(a)
a<-table.element(a,'10% type I error level',header=TRUE)
a<-table.element(a,numsignificant10)
a<-table.element(a,numsignificant10/numgqtests)
if (numsignificant10/numgqtests < 0.1) dum <- 'OK' else dum <- 'NOK'
a<-table.element(a,dum)
a<-table.row.end(a)
a<-table.end(a)
table.save(a,file='mytable6.tab')
}