Free Statistics

of Irreproducible Research!

Author's title

Author*The author of this computation has been verified*
R Software Modulerwasp_multipleregression.wasp
Title produced by softwareMultiple Regression
Date of computationSun, 23 Nov 2008 09:25:09 -0700
Cite this page as followsStatistical Computations at FreeStatistics.org, Office for Research Development and Education, URL https://freestatistics.org/blog/index.php?v=date/2008/Nov/23/t12274575861dx30tw0w0agee0.htm/, Retrieved Sun, 19 May 2024 11:38:10 +0000
Statistical Computations at FreeStatistics.org, Office for Research Development and Education, URL https://freestatistics.org/blog/index.php?pk=25298, Retrieved Sun, 19 May 2024 11:38:10 +0000
QR Codes:

Original text written by user:
IsPrivate?No (this computation is public)
User-defined keywords
Estimated Impact219
Family? (F = Feedback message, R = changed R code, M = changed R Module, P = changed Parameters, D = changed Data)
F       [Multiple Regression] [Seatbelt law & tu...] [2008-11-23 16:25:09] [821c4b3d195be8e737cf8c9dc649d3cf] [Current]
-    D    [Multiple Regression] [] [2008-12-04 10:30:10] [3a9fc6d5b5e0e816787b7dbace57e7cd]
- RM D      [Univariate Data Series] [paper] [2008-12-04 12:54:11] [3a9fc6d5b5e0e816787b7dbace57e7cd]
-   PD        [Univariate Data Series] [marlies.polfliet_...] [2008-12-07 15:08:42] [fdc296cbeb5d8064cb0dbd634c3fdc55]
- RMPD        [(Partial) Autocorrelation Function] [marlies.polfliet_...] [2008-12-07 15:13:54] [fdc296cbeb5d8064cb0dbd634c3fdc55]
- RMPD        [Variance Reduction Matrix] [marlies.polfliet_...] [2008-12-07 15:20:09] [fdc296cbeb5d8064cb0dbd634c3fdc55]
- RMPD        [Standard Deviation-Mean Plot] [marlies.polfliet_...] [2008-12-07 15:23:12] [fdc296cbeb5d8064cb0dbd634c3fdc55]
- RMPD        [Spectral Analysis] [marlies.polfliet_...] [2008-12-07 15:26:59] [fdc296cbeb5d8064cb0dbd634c3fdc55]
-   P           [Spectral Analysis] [marlies.polfliet_...] [2008-12-07 15:29:59] [fdc296cbeb5d8064cb0dbd634c3fdc55]
-   P             [Spectral Analysis] [marlies.polfliet_...] [2008-12-07 15:33:36] [fdc296cbeb5d8064cb0dbd634c3fdc55]
Feedback Forum
2008-11-30 17:21:00 [5faab2fc6fb120339944528a32d48a04] [reply
Goed uitgewerkt, soms wat informatie vergeten.
Als we de P-waarde bekijken en vergelijken met de alpha-fout van 5% is de p-waarde niet altijd kleiner dan de alpha fout wat dus niet altijd een significant verschil betekent.M2,M5,M6,M7,M8 en M9 zijn niet significant verschillend vanwege te hoge p-waarde (2zijdig bekeken). Hierbij werd niet vermeld welke toets wordt gebruikt, eenzijdig of tweezijdig. De resultaten maken het mogelijk om een uitspraak te doen op LT, maar dit werd niet gedaan. Verder heeft de student niet geconcludeerd of er sprake is van seizonaliteit.
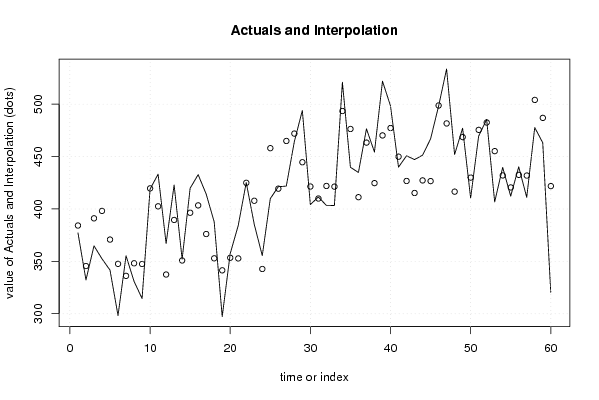
Adjusted R-squared: hetgeen je van de variabiliteit of spreiding kan verklaren, hoog is zeer goed. Maar om te zien of dit aan toeval te wijten is moeten we de F-test (de verdeling) ook controleren. De p-value moet zo klein mogelijk zijn, dat is hier niet het geval (3), dus de berekeningen kunnen aan toeval te wijten zijn. De actuals and interpolations geeft ons een beeld van de relatief constante trend en het duidelijke effect van het de gestegen wisselkoers van 1euro boven de 125 Yen.
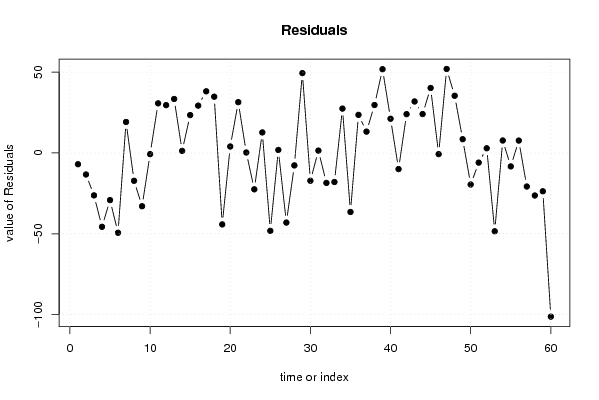
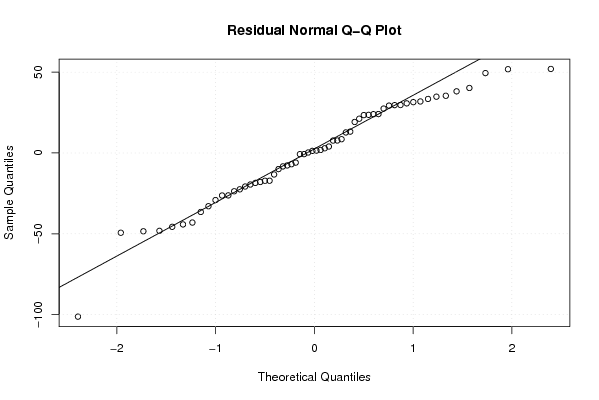
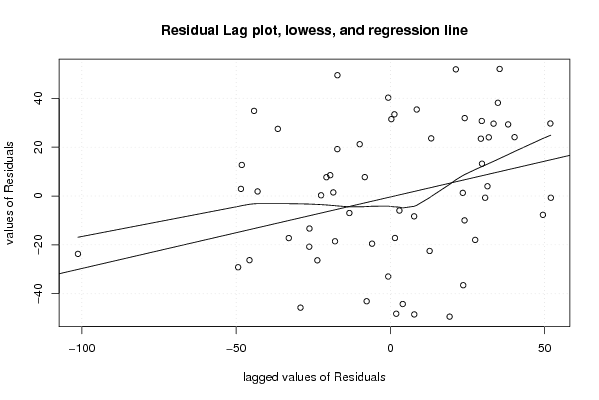
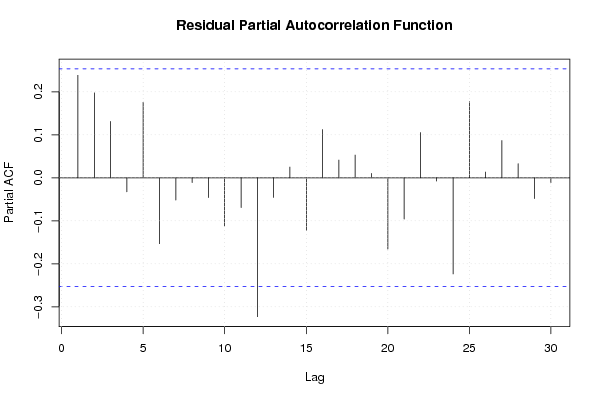
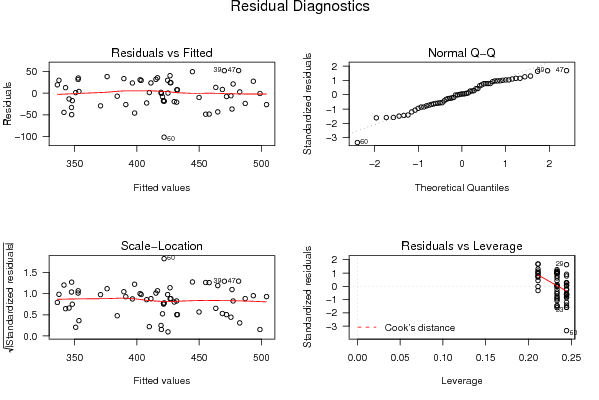
De residuals geeft een beeld van de voorspellingsfout, dit zou een mooi golvend patroon rond 0 moeten weergeven maar is hier niet het geval. Het histogram en het densityplot geven eveneens weer dat de residu's niet normaal verdeeld zijn. De qq-plot toont dat de quantielen van de residu’s niet goed aansluiten aan quantielen van een normaalverdeling. Hierbij toont de residual lag plot dat er sprake is van voorspelbaarheid vanwege de positieve correlatie tussen de voorspellingsfout op tijdstip t en t-1. De residual autocorrelatiefunctie geeft binnen de blauwe stippellijn het 95% betrouwbaarheidsinterval, alle verticale lijntjes buiten deze horizontale stippellijn zijn significant verschillend (M12 en M15)en dus ook niet te wijten aan toeval. De andere zijn niet significant verschillend. Er is sprake van autocorrelatie.
Ook het algemeen besluit is correct, nl: Het model is nog niet helemaal in orde. Om aan de assumpties te voldoen:
•mag er geen patroon of geen autocorrelatie zijn; niet in orde
•moet het gemiddelde constant en nul zijn; niet in orde
2008-12-01 15:06:46 [Sam De Cuyper] [reply
Juiste berekeningen, enkel de interpratatie kon iets beter.
Je zou toch moeten vermelden welke soort test je gebruikt, eenzijdig of tweezijdig. Dit is vrij belangrijk voor de interpretatie. In je uitleg is ook niets terug te vinden over de seizoenaliteit van je onderzoek.

Adjusted R-squared: hetgeen je zegt over de waarde van de R² is correct maar je moet ook de p-waarde bekijken en die is vrij hoog! Dit betekend dat het percentage niet significant verschillend is van nul. Het zou dus kunnen toe te wijten zijn aan het toeval.
De uitleg bij de grafieken is allemaal correct en de conclusie die je op het einde geeft is ook juist.
2008-12-01 18:07:51 [Käthe Vanderheggen] [reply
Ik sluit mij aan bij mijn medestudenten. Ik wil hier nog aan toevoegen dat de student nog iets meer uitleg bij de gebruikte grafieken kon geven, maar aangezien dit redelijk goed werd gedaan bij Q2 is dat niet zo erg. Het gaat immers over dezelfde grafieken maar met een andere invulling.
2008-12-01 19:16:20 [Gert-Jan Geudens] [reply
Het antwoord van de student is goed. Het model is inderdaad nog niet goed aangezien er voor de maanden februari, mei, juni, juli, augustus en september duidelijk sprake is van toeval. We kunnen ook aan de grafieken afleiden dat dit model nog niet goed is. Tevens is de student vergeten te vermelden dat de p-waarde in de tabel multiple linear regression - regression statistics , ongeveer gelijk is aan 3 en dus veel groter dan 0.05. Het is dus duidelijk dat minstens 30% van de gegevens door het toeval verklaard kunnen worden.

Post a new message
Dataseries X:
377,2	0
332,2	0
364,8	0
352,4	0
341,6	0
298,2	0
355,3	0
330,9	0
314,5	0
418,9	0
433,2	0
367	0
422,9	0
352,1	0
419,8	0
432,7	0
414,2	0
387,7	0
297,2	0
357,4	0
384,2	0
425,2	0
385,3	0
355,4	0
409,8	1
421,2	1
421,8	1
464,2	1
494	1
404,2	1
411,4	1
403,4	1
403,3	1
520,9	1
439,8	1
434,8	1
476,5	1
454,3	1
522	1
498,4	1
439,9	1
450,7	1
447,1	1
451,3	1
466,8	1
498	1
533,6	1
451,9	1
477,1	1
410,4	1
469,5	1
485,4	1
406,7	1
439,7	1
412,2	1
440,2	1
411,1	1
477,7	1
463,2	1
320,5	1


Summary of computational transaction
Raw Inputview raw input (R code)
Raw Outputview raw output of R engine
Computing time4 seconds
R Server'Gwilym Jenkins' @ 72.249.127.135

\begin{tabular}{lllllllll}
\hline
Summary of computational transaction \tabularnewline
Raw Input & view raw input (R code)  \tabularnewline
Raw Output & view raw output of R engine  \tabularnewline
Computing time & 4 seconds \tabularnewline
R Server & 'Gwilym Jenkins' @ 72.249.127.135 \tabularnewline
\hline
\end{tabular}
%Source: https://freestatistics.org/blog/index.php?pk=25298&T=0

[TABLE]
[ROW][C]Summary of computational transaction[/C][/ROW]
[ROW][C]Raw Input[/C][C]view raw input (R code) [/C][/ROW]
[ROW][C]Raw Output[/C][C]view raw output of R engine [/C][/ROW]
[ROW][C]Computing time[/C][C]4 seconds[/C][/ROW]
[ROW][C]R Server[/C][C]'Gwilym Jenkins' @ 72.249.127.135[/C][/ROW]
[/TABLE]
Source: https://freestatistics.org/blog/index.php?pk=25298&T=0

Globally Unique Identifier (entire table): ba.freestatistics.org/blog/index.php?pk=25298&T=0

As an alternative you can also use a QR Code:  

The GUIDs for individual cells are displayed in the table below:

Summary of computational transaction
Raw Inputview raw input (R code)
Raw Outputview raw output of R engine
Computing time4 seconds
R Server'Gwilym Jenkins' @ 72.249.127.135


Multiple Linear Regression - Estimated Regression Equation
invoer[t] = + 332.101666666667 + 63.2222222222222`1euro>125yen`[t] + 51.6337499999998M1[t] + 12.5325000000001M2[t] + 57.63125M3[t] + 64.2299999999999M4[t] + 36.4487499999999M5[t] + 12.8275M6[t] + 0.926249999999977M7[t] + 12.485M8[t] + 11.3837500000000M9[t] + 83.1025M10[t] + 65.54125M11[t] + 0.44125t + e[t]

\begin{tabular}{lllllllll}
\hline
Multiple Linear Regression - Estimated Regression Equation \tabularnewline
invoer[t] =  +  332.101666666667 +  63.2222222222222`1euro>125yen`[t] +  51.6337499999998M1[t] +  12.5325000000001M2[t] +  57.63125M3[t] +  64.2299999999999M4[t] +  36.4487499999999M5[t] +  12.8275M6[t] +  0.926249999999977M7[t] +  12.485M8[t] +  11.3837500000000M9[t] +  83.1025M10[t] +  65.54125M11[t] +  0.44125t  + e[t] \tabularnewline
\hline
\end{tabular}
%Source: https://freestatistics.org/blog/index.php?pk=25298&T=1

[TABLE]
[ROW][C]Multiple Linear Regression - Estimated Regression Equation[/C][/ROW]
[ROW][C]invoer[t] =  +  332.101666666667 +  63.2222222222222`1euro>125yen`[t] +  51.6337499999998M1[t] +  12.5325000000001M2[t] +  57.63125M3[t] +  64.2299999999999M4[t] +  36.4487499999999M5[t] +  12.8275M6[t] +  0.926249999999977M7[t] +  12.485M8[t] +  11.3837500000000M9[t] +  83.1025M10[t] +  65.54125M11[t] +  0.44125t  + e[t][/C][/ROW]
[/TABLE]
Source: https://freestatistics.org/blog/index.php?pk=25298&T=1

Globally Unique Identifier (entire table): ba.freestatistics.org/blog/index.php?pk=25298&T=1

As an alternative you can also use a QR Code:  

The GUIDs for individual cells are displayed in the table below:

Multiple Linear Regression - Estimated Regression Equation
invoer[t] = + 332.101666666667 + 63.2222222222222`1euro>125yen`[t] + 51.6337499999998M1[t] + 12.5325000000001M2[t] + 57.63125M3[t] + 64.2299999999999M4[t] + 36.4487499999999M5[t] + 12.8275M6[t] + 0.926249999999977M7[t] + 12.485M8[t] + 11.3837500000000M9[t] + 83.1025M10[t] + 65.54125M11[t] + 0.44125t + e[t]


Multiple Linear Regression - Ordinary Least Squares
VariableParameterS.D.T-STATH0: parameter = 02-tail p-value1-tail p-value
(Intercept)332.10166666666719.11001417.378400
`1euro>125yen`63.222222222222218.3886193.43810.0012540.000627
M151.633749999999822.825852.26210.0284620.014231
M212.532500000000122.6958570.55220.5834890.291745
M357.6312522.57762.55260.0140770.007038
M464.229999999999922.4712642.85830.0063780.003189
M536.448749999999922.3770181.62880.1101760.055088
M612.827522.2950160.57540.5678570.283928
M70.92624999999997722.2253930.04170.9669380.483469
M812.48522.1682670.56320.5760390.288019
M911.383750000000022.1237330.51450.6093320.304666
M1083.102522.0918683.76170.0004760.000238
M1165.5412522.0727272.96930.0047280.002364
t0.441250.5308340.83120.4101320.205066

\begin{tabular}{lllllllll}
\hline
Multiple Linear Regression - Ordinary Least Squares \tabularnewline
Variable & Parameter & S.D. & T-STATH0: parameter = 0 & 2-tail p-value & 1-tail p-value \tabularnewline
(Intercept) & 332.101666666667 & 19.110014 & 17.3784 & 0 & 0 \tabularnewline
`1euro>125yen` & 63.2222222222222 & 18.388619 & 3.4381 & 0.001254 & 0.000627 \tabularnewline
M1 & 51.6337499999998 & 22.82585 & 2.2621 & 0.028462 & 0.014231 \tabularnewline
M2 & 12.5325000000001 & 22.695857 & 0.5522 & 0.583489 & 0.291745 \tabularnewline
M3 & 57.63125 & 22.5776 & 2.5526 & 0.014077 & 0.007038 \tabularnewline
M4 & 64.2299999999999 & 22.471264 & 2.8583 & 0.006378 & 0.003189 \tabularnewline
M5 & 36.4487499999999 & 22.377018 & 1.6288 & 0.110176 & 0.055088 \tabularnewline
M6 & 12.8275 & 22.295016 & 0.5754 & 0.567857 & 0.283928 \tabularnewline
M7 & 0.926249999999977 & 22.225393 & 0.0417 & 0.966938 & 0.483469 \tabularnewline
M8 & 12.485 & 22.168267 & 0.5632 & 0.576039 & 0.288019 \tabularnewline
M9 & 11.3837500000000 & 22.123733 & 0.5145 & 0.609332 & 0.304666 \tabularnewline
M10 & 83.1025 & 22.091868 & 3.7617 & 0.000476 & 0.000238 \tabularnewline
M11 & 65.54125 & 22.072727 & 2.9693 & 0.004728 & 0.002364 \tabularnewline
t & 0.44125 & 0.530834 & 0.8312 & 0.410132 & 0.205066 \tabularnewline
\hline
\end{tabular}
%Source: https://freestatistics.org/blog/index.php?pk=25298&T=2

[TABLE]
[ROW][C]Multiple Linear Regression - Ordinary Least Squares[/C][/ROW]
[ROW][C]Variable[/C][C]Parameter[/C][C]S.D.[/C][C]T-STATH0: parameter = 0[/C][C]2-tail p-value[/C][C]1-tail p-value[/C][/ROW]
[ROW][C](Intercept)[/C][C]332.101666666667[/C][C]19.110014[/C][C]17.3784[/C][C]0[/C][C]0[/C][/ROW]
[ROW][C]`1euro>125yen`[/C][C]63.2222222222222[/C][C]18.388619[/C][C]3.4381[/C][C]0.001254[/C][C]0.000627[/C][/ROW]
[ROW][C]M1[/C][C]51.6337499999998[/C][C]22.82585[/C][C]2.2621[/C][C]0.028462[/C][C]0.014231[/C][/ROW]
[ROW][C]M2[/C][C]12.5325000000001[/C][C]22.695857[/C][C]0.5522[/C][C]0.583489[/C][C]0.291745[/C][/ROW]
[ROW][C]M3[/C][C]57.63125[/C][C]22.5776[/C][C]2.5526[/C][C]0.014077[/C][C]0.007038[/C][/ROW]
[ROW][C]M4[/C][C]64.2299999999999[/C][C]22.471264[/C][C]2.8583[/C][C]0.006378[/C][C]0.003189[/C][/ROW]
[ROW][C]M5[/C][C]36.4487499999999[/C][C]22.377018[/C][C]1.6288[/C][C]0.110176[/C][C]0.055088[/C][/ROW]
[ROW][C]M6[/C][C]12.8275[/C][C]22.295016[/C][C]0.5754[/C][C]0.567857[/C][C]0.283928[/C][/ROW]
[ROW][C]M7[/C][C]0.926249999999977[/C][C]22.225393[/C][C]0.0417[/C][C]0.966938[/C][C]0.483469[/C][/ROW]
[ROW][C]M8[/C][C]12.485[/C][C]22.168267[/C][C]0.5632[/C][C]0.576039[/C][C]0.288019[/C][/ROW]
[ROW][C]M9[/C][C]11.3837500000000[/C][C]22.123733[/C][C]0.5145[/C][C]0.609332[/C][C]0.304666[/C][/ROW]
[ROW][C]M10[/C][C]83.1025[/C][C]22.091868[/C][C]3.7617[/C][C]0.000476[/C][C]0.000238[/C][/ROW]
[ROW][C]M11[/C][C]65.54125[/C][C]22.072727[/C][C]2.9693[/C][C]0.004728[/C][C]0.002364[/C][/ROW]
[ROW][C]t[/C][C]0.44125[/C][C]0.530834[/C][C]0.8312[/C][C]0.410132[/C][C]0.205066[/C][/ROW]
[/TABLE]
Source: https://freestatistics.org/blog/index.php?pk=25298&T=2

Globally Unique Identifier (entire table): ba.freestatistics.org/blog/index.php?pk=25298&T=2

As an alternative you can also use a QR Code:  

The GUIDs for individual cells are displayed in the table below:

Multiple Linear Regression - Ordinary Least Squares
VariableParameterS.D.T-STATH0: parameter = 02-tail p-value1-tail p-value
(Intercept)332.10166666666719.11001417.378400
`1euro>125yen`63.222222222222218.3886193.43810.0012540.000627
M151.633749999999822.825852.26210.0284620.014231
M212.532500000000122.6958570.55220.5834890.291745
M357.6312522.57762.55260.0140770.007038
M464.229999999999922.4712642.85830.0063780.003189
M536.448749999999922.3770181.62880.1101760.055088
M612.827522.2950160.57540.5678570.283928
M70.92624999999997722.2253930.04170.9669380.483469
M812.48522.1682670.56320.5760390.288019
M911.383750000000022.1237330.51450.6093320.304666
M1083.102522.0918683.76170.0004760.000238
M1165.5412522.0727272.96930.0047280.002364
t0.441250.5308340.83120.4101320.205066


Multiple Linear Regression - Regression Statistics
Multiple R0.837209151077354
R-squared0.700919162647664
Adjusted R-squared0.61639631730896
F-TEST (value)8.29265933770815
F-TEST (DF numerator)13
F-TEST (DF denominator)46
p-value3.018004712807e-08
Multiple Linear Regression - Residual Statistics
Residual Standard Deviation34.8899518015571
Sum Squared Residuals55996.2018888889

\begin{tabular}{lllllllll}
\hline
Multiple Linear Regression - Regression Statistics \tabularnewline
Multiple R & 0.837209151077354 \tabularnewline
R-squared & 0.700919162647664 \tabularnewline
Adjusted R-squared & 0.61639631730896 \tabularnewline
F-TEST (value) & 8.29265933770815 \tabularnewline
F-TEST (DF numerator) & 13 \tabularnewline
F-TEST (DF denominator) & 46 \tabularnewline
p-value & 3.018004712807e-08 \tabularnewline
Multiple Linear Regression - Residual Statistics \tabularnewline
Residual Standard Deviation & 34.8899518015571 \tabularnewline
Sum Squared Residuals & 55996.2018888889 \tabularnewline
\hline
\end{tabular}
%Source: https://freestatistics.org/blog/index.php?pk=25298&T=3

[TABLE]
[ROW][C]Multiple Linear Regression - Regression Statistics[/C][/ROW]
[ROW][C]Multiple R[/C][C]0.837209151077354[/C][/ROW]
[ROW][C]R-squared[/C][C]0.700919162647664[/C][/ROW]
[ROW][C]Adjusted R-squared[/C][C]0.61639631730896[/C][/ROW]
[ROW][C]F-TEST (value)[/C][C]8.29265933770815[/C][/ROW]
[ROW][C]F-TEST (DF numerator)[/C][C]13[/C][/ROW]
[ROW][C]F-TEST (DF denominator)[/C][C]46[/C][/ROW]
[ROW][C]p-value[/C][C]3.018004712807e-08[/C][/ROW]
[ROW][C]Multiple Linear Regression - Residual Statistics[/C][/ROW]
[ROW][C]Residual Standard Deviation[/C][C]34.8899518015571[/C][/ROW]
[ROW][C]Sum Squared Residuals[/C][C]55996.2018888889[/C][/ROW]
[/TABLE]
Source: https://freestatistics.org/blog/index.php?pk=25298&T=3

Globally Unique Identifier (entire table): ba.freestatistics.org/blog/index.php?pk=25298&T=3

As an alternative you can also use a QR Code:  

The GUIDs for individual cells are displayed in the table below:

Multiple Linear Regression - Regression Statistics
Multiple R0.837209151077354
R-squared0.700919162647664
Adjusted R-squared0.61639631730896
F-TEST (value)8.29265933770815
F-TEST (DF numerator)13
F-TEST (DF denominator)46
p-value3.018004712807e-08
Multiple Linear Regression - Residual Statistics
Residual Standard Deviation34.8899518015571
Sum Squared Residuals55996.2018888889


Multiple Linear Regression - Actuals, Interpolation, and Residuals
Time or IndexActualsInterpolationForecastResidualsPrediction Error
1377.2384.176666666667-6.97666666666701
2332.2345.516666666666-13.3166666666664
3364.8391.056666666667-26.2566666666665
4352.4398.096666666667-45.6966666666668
5341.6370.756666666667-29.1566666666667
6298.2347.576666666667-49.3766666666666
7355.3336.11666666666719.1833333333334
8330.9348.116666666667-17.2166666666667
9314.5347.456666666667-32.9566666666667
10418.9419.616666666667-0.716666666666741
11433.2402.49666666666730.7033333333333
12367337.39666666666729.6033333333334
13422.9389.47166666666733.4283333333334
14352.1350.8116666666671.28833333333335
15419.8396.35166666666723.4483333333333
16432.7403.39166666666729.3083333333334
17414.2376.05166666666738.1483333333334
18387.7352.87166666666734.8283333333333
19297.2341.411666666667-44.2116666666667
20357.4353.4116666666673.98833333333334
21384.2352.75166666666731.4483333333333
22425.2424.9116666666670.288333333333357
23385.3407.791666666667-22.4916666666666
24355.4342.69166666666712.7083333333333
25409.8457.988888888889-48.1888888888888
26421.2419.3288888888891.87111111111107
27421.8464.868888888889-43.0688888888889
28464.2471.908888888889-7.70888888888884
29494444.56888888888949.4311111111111
30404.2421.388888888889-17.1888888888889
31411.4409.9288888888891.47111111111108
32403.4421.928888888889-18.5288888888889
33403.3421.268888888889-17.9688888888889
34520.9493.42888888888927.4711111111111
35439.8476.308888888889-36.5088888888889
36434.8411.20888888888923.5911111111111
37476.5463.28388888888913.2161111111112
38454.3424.62388888888929.6761111111111
39522470.16388888888951.8361111111111
40498.4477.20388888888921.1961111111111
41439.9449.863888888889-9.9638888888889
42450.7426.68388888888924.0161111111111
43447.1415.22388888888931.8761111111111
44451.3427.22388888888924.0761111111111
45466.8426.56388888888940.2361111111111
46498498.723888888889-0.72388888888886
47533.6481.60388888888951.9961111111111
48451.9416.50388888888935.396111111111
49477.1468.5788888888898.52111111111119
50410.4429.918888888889-19.5188888888889
51469.5475.458888888889-5.95888888888893
52485.4482.4988888888892.90111111111114
53406.7455.158888888889-48.4588888888889
54439.7431.9788888888897.72111111111109
55412.2420.518888888889-8.3188888888889
56440.2432.5188888888897.68111111111113
57411.1431.858888888889-20.7588888888889
58477.7504.018888888889-26.3188888888889
59463.2486.898888888889-23.6988888888889
60320.5421.798888888889-101.298888888889

\begin{tabular}{lllllllll}
\hline
Multiple Linear Regression - Actuals, Interpolation, and Residuals \tabularnewline
Time or Index & Actuals & InterpolationForecast & ResidualsPrediction Error \tabularnewline
1 & 377.2 & 384.176666666667 & -6.97666666666701 \tabularnewline
2 & 332.2 & 345.516666666666 & -13.3166666666664 \tabularnewline
3 & 364.8 & 391.056666666667 & -26.2566666666665 \tabularnewline
4 & 352.4 & 398.096666666667 & -45.6966666666668 \tabularnewline
5 & 341.6 & 370.756666666667 & -29.1566666666667 \tabularnewline
6 & 298.2 & 347.576666666667 & -49.3766666666666 \tabularnewline
7 & 355.3 & 336.116666666667 & 19.1833333333334 \tabularnewline
8 & 330.9 & 348.116666666667 & -17.2166666666667 \tabularnewline
9 & 314.5 & 347.456666666667 & -32.9566666666667 \tabularnewline
10 & 418.9 & 419.616666666667 & -0.716666666666741 \tabularnewline
11 & 433.2 & 402.496666666667 & 30.7033333333333 \tabularnewline
12 & 367 & 337.396666666667 & 29.6033333333334 \tabularnewline
13 & 422.9 & 389.471666666667 & 33.4283333333334 \tabularnewline
14 & 352.1 & 350.811666666667 & 1.28833333333335 \tabularnewline
15 & 419.8 & 396.351666666667 & 23.4483333333333 \tabularnewline
16 & 432.7 & 403.391666666667 & 29.3083333333334 \tabularnewline
17 & 414.2 & 376.051666666667 & 38.1483333333334 \tabularnewline
18 & 387.7 & 352.871666666667 & 34.8283333333333 \tabularnewline
19 & 297.2 & 341.411666666667 & -44.2116666666667 \tabularnewline
20 & 357.4 & 353.411666666667 & 3.98833333333334 \tabularnewline
21 & 384.2 & 352.751666666667 & 31.4483333333333 \tabularnewline
22 & 425.2 & 424.911666666667 & 0.288333333333357 \tabularnewline
23 & 385.3 & 407.791666666667 & -22.4916666666666 \tabularnewline
24 & 355.4 & 342.691666666667 & 12.7083333333333 \tabularnewline
25 & 409.8 & 457.988888888889 & -48.1888888888888 \tabularnewline
26 & 421.2 & 419.328888888889 & 1.87111111111107 \tabularnewline
27 & 421.8 & 464.868888888889 & -43.0688888888889 \tabularnewline
28 & 464.2 & 471.908888888889 & -7.70888888888884 \tabularnewline
29 & 494 & 444.568888888889 & 49.4311111111111 \tabularnewline
30 & 404.2 & 421.388888888889 & -17.1888888888889 \tabularnewline
31 & 411.4 & 409.928888888889 & 1.47111111111108 \tabularnewline
32 & 403.4 & 421.928888888889 & -18.5288888888889 \tabularnewline
33 & 403.3 & 421.268888888889 & -17.9688888888889 \tabularnewline
34 & 520.9 & 493.428888888889 & 27.4711111111111 \tabularnewline
35 & 439.8 & 476.308888888889 & -36.5088888888889 \tabularnewline
36 & 434.8 & 411.208888888889 & 23.5911111111111 \tabularnewline
37 & 476.5 & 463.283888888889 & 13.2161111111112 \tabularnewline
38 & 454.3 & 424.623888888889 & 29.6761111111111 \tabularnewline
39 & 522 & 470.163888888889 & 51.8361111111111 \tabularnewline
40 & 498.4 & 477.203888888889 & 21.1961111111111 \tabularnewline
41 & 439.9 & 449.863888888889 & -9.9638888888889 \tabularnewline
42 & 450.7 & 426.683888888889 & 24.0161111111111 \tabularnewline
43 & 447.1 & 415.223888888889 & 31.8761111111111 \tabularnewline
44 & 451.3 & 427.223888888889 & 24.0761111111111 \tabularnewline
45 & 466.8 & 426.563888888889 & 40.2361111111111 \tabularnewline
46 & 498 & 498.723888888889 & -0.72388888888886 \tabularnewline
47 & 533.6 & 481.603888888889 & 51.9961111111111 \tabularnewline
48 & 451.9 & 416.503888888889 & 35.396111111111 \tabularnewline
49 & 477.1 & 468.578888888889 & 8.52111111111119 \tabularnewline
50 & 410.4 & 429.918888888889 & -19.5188888888889 \tabularnewline
51 & 469.5 & 475.458888888889 & -5.95888888888893 \tabularnewline
52 & 485.4 & 482.498888888889 & 2.90111111111114 \tabularnewline
53 & 406.7 & 455.158888888889 & -48.4588888888889 \tabularnewline
54 & 439.7 & 431.978888888889 & 7.72111111111109 \tabularnewline
55 & 412.2 & 420.518888888889 & -8.3188888888889 \tabularnewline
56 & 440.2 & 432.518888888889 & 7.68111111111113 \tabularnewline
57 & 411.1 & 431.858888888889 & -20.7588888888889 \tabularnewline
58 & 477.7 & 504.018888888889 & -26.3188888888889 \tabularnewline
59 & 463.2 & 486.898888888889 & -23.6988888888889 \tabularnewline
60 & 320.5 & 421.798888888889 & -101.298888888889 \tabularnewline
\hline
\end{tabular}
%Source: https://freestatistics.org/blog/index.php?pk=25298&T=4

[TABLE]
[ROW][C]Multiple Linear Regression - Actuals, Interpolation, and Residuals[/C][/ROW]
[ROW][C]Time or Index[/C][C]Actuals[/C][C]InterpolationForecast[/C][C]ResidualsPrediction Error[/C][/ROW]
[ROW][C]1[/C][C]377.2[/C][C]384.176666666667[/C][C]-6.97666666666701[/C][/ROW]
[ROW][C]2[/C][C]332.2[/C][C]345.516666666666[/C][C]-13.3166666666664[/C][/ROW]
[ROW][C]3[/C][C]364.8[/C][C]391.056666666667[/C][C]-26.2566666666665[/C][/ROW]
[ROW][C]4[/C][C]352.4[/C][C]398.096666666667[/C][C]-45.6966666666668[/C][/ROW]
[ROW][C]5[/C][C]341.6[/C][C]370.756666666667[/C][C]-29.1566666666667[/C][/ROW]
[ROW][C]6[/C][C]298.2[/C][C]347.576666666667[/C][C]-49.3766666666666[/C][/ROW]
[ROW][C]7[/C][C]355.3[/C][C]336.116666666667[/C][C]19.1833333333334[/C][/ROW]
[ROW][C]8[/C][C]330.9[/C][C]348.116666666667[/C][C]-17.2166666666667[/C][/ROW]
[ROW][C]9[/C][C]314.5[/C][C]347.456666666667[/C][C]-32.9566666666667[/C][/ROW]
[ROW][C]10[/C][C]418.9[/C][C]419.616666666667[/C][C]-0.716666666666741[/C][/ROW]
[ROW][C]11[/C][C]433.2[/C][C]402.496666666667[/C][C]30.7033333333333[/C][/ROW]
[ROW][C]12[/C][C]367[/C][C]337.396666666667[/C][C]29.6033333333334[/C][/ROW]
[ROW][C]13[/C][C]422.9[/C][C]389.471666666667[/C][C]33.4283333333334[/C][/ROW]
[ROW][C]14[/C][C]352.1[/C][C]350.811666666667[/C][C]1.28833333333335[/C][/ROW]
[ROW][C]15[/C][C]419.8[/C][C]396.351666666667[/C][C]23.4483333333333[/C][/ROW]
[ROW][C]16[/C][C]432.7[/C][C]403.391666666667[/C][C]29.3083333333334[/C][/ROW]
[ROW][C]17[/C][C]414.2[/C][C]376.051666666667[/C][C]38.1483333333334[/C][/ROW]
[ROW][C]18[/C][C]387.7[/C][C]352.871666666667[/C][C]34.8283333333333[/C][/ROW]
[ROW][C]19[/C][C]297.2[/C][C]341.411666666667[/C][C]-44.2116666666667[/C][/ROW]
[ROW][C]20[/C][C]357.4[/C][C]353.411666666667[/C][C]3.98833333333334[/C][/ROW]
[ROW][C]21[/C][C]384.2[/C][C]352.751666666667[/C][C]31.4483333333333[/C][/ROW]
[ROW][C]22[/C][C]425.2[/C][C]424.911666666667[/C][C]0.288333333333357[/C][/ROW]
[ROW][C]23[/C][C]385.3[/C][C]407.791666666667[/C][C]-22.4916666666666[/C][/ROW]
[ROW][C]24[/C][C]355.4[/C][C]342.691666666667[/C][C]12.7083333333333[/C][/ROW]
[ROW][C]25[/C][C]409.8[/C][C]457.988888888889[/C][C]-48.1888888888888[/C][/ROW]
[ROW][C]26[/C][C]421.2[/C][C]419.328888888889[/C][C]1.87111111111107[/C][/ROW]
[ROW][C]27[/C][C]421.8[/C][C]464.868888888889[/C][C]-43.0688888888889[/C][/ROW]
[ROW][C]28[/C][C]464.2[/C][C]471.908888888889[/C][C]-7.70888888888884[/C][/ROW]
[ROW][C]29[/C][C]494[/C][C]444.568888888889[/C][C]49.4311111111111[/C][/ROW]
[ROW][C]30[/C][C]404.2[/C][C]421.388888888889[/C][C]-17.1888888888889[/C][/ROW]
[ROW][C]31[/C][C]411.4[/C][C]409.928888888889[/C][C]1.47111111111108[/C][/ROW]
[ROW][C]32[/C][C]403.4[/C][C]421.928888888889[/C][C]-18.5288888888889[/C][/ROW]
[ROW][C]33[/C][C]403.3[/C][C]421.268888888889[/C][C]-17.9688888888889[/C][/ROW]
[ROW][C]34[/C][C]520.9[/C][C]493.428888888889[/C][C]27.4711111111111[/C][/ROW]
[ROW][C]35[/C][C]439.8[/C][C]476.308888888889[/C][C]-36.5088888888889[/C][/ROW]
[ROW][C]36[/C][C]434.8[/C][C]411.208888888889[/C][C]23.5911111111111[/C][/ROW]
[ROW][C]37[/C][C]476.5[/C][C]463.283888888889[/C][C]13.2161111111112[/C][/ROW]
[ROW][C]38[/C][C]454.3[/C][C]424.623888888889[/C][C]29.6761111111111[/C][/ROW]
[ROW][C]39[/C][C]522[/C][C]470.163888888889[/C][C]51.8361111111111[/C][/ROW]
[ROW][C]40[/C][C]498.4[/C][C]477.203888888889[/C][C]21.1961111111111[/C][/ROW]
[ROW][C]41[/C][C]439.9[/C][C]449.863888888889[/C][C]-9.9638888888889[/C][/ROW]
[ROW][C]42[/C][C]450.7[/C][C]426.683888888889[/C][C]24.0161111111111[/C][/ROW]
[ROW][C]43[/C][C]447.1[/C][C]415.223888888889[/C][C]31.8761111111111[/C][/ROW]
[ROW][C]44[/C][C]451.3[/C][C]427.223888888889[/C][C]24.0761111111111[/C][/ROW]
[ROW][C]45[/C][C]466.8[/C][C]426.563888888889[/C][C]40.2361111111111[/C][/ROW]
[ROW][C]46[/C][C]498[/C][C]498.723888888889[/C][C]-0.72388888888886[/C][/ROW]
[ROW][C]47[/C][C]533.6[/C][C]481.603888888889[/C][C]51.9961111111111[/C][/ROW]
[ROW][C]48[/C][C]451.9[/C][C]416.503888888889[/C][C]35.396111111111[/C][/ROW]
[ROW][C]49[/C][C]477.1[/C][C]468.578888888889[/C][C]8.52111111111119[/C][/ROW]
[ROW][C]50[/C][C]410.4[/C][C]429.918888888889[/C][C]-19.5188888888889[/C][/ROW]
[ROW][C]51[/C][C]469.5[/C][C]475.458888888889[/C][C]-5.95888888888893[/C][/ROW]
[ROW][C]52[/C][C]485.4[/C][C]482.498888888889[/C][C]2.90111111111114[/C][/ROW]
[ROW][C]53[/C][C]406.7[/C][C]455.158888888889[/C][C]-48.4588888888889[/C][/ROW]
[ROW][C]54[/C][C]439.7[/C][C]431.978888888889[/C][C]7.72111111111109[/C][/ROW]
[ROW][C]55[/C][C]412.2[/C][C]420.518888888889[/C][C]-8.3188888888889[/C][/ROW]
[ROW][C]56[/C][C]440.2[/C][C]432.518888888889[/C][C]7.68111111111113[/C][/ROW]
[ROW][C]57[/C][C]411.1[/C][C]431.858888888889[/C][C]-20.7588888888889[/C][/ROW]
[ROW][C]58[/C][C]477.7[/C][C]504.018888888889[/C][C]-26.3188888888889[/C][/ROW]
[ROW][C]59[/C][C]463.2[/C][C]486.898888888889[/C][C]-23.6988888888889[/C][/ROW]
[ROW][C]60[/C][C]320.5[/C][C]421.798888888889[/C][C]-101.298888888889[/C][/ROW]
[/TABLE]
Source: https://freestatistics.org/blog/index.php?pk=25298&T=4

Globally Unique Identifier (entire table): ba.freestatistics.org/blog/index.php?pk=25298&T=4

As an alternative you can also use a QR Code:  

The GUIDs for individual cells are displayed in the table below:

Multiple Linear Regression - Actuals, Interpolation, and Residuals
Time or IndexActualsInterpolationForecastResidualsPrediction Error
1377.2384.176666666667-6.97666666666701
2332.2345.516666666666-13.3166666666664
3364.8391.056666666667-26.2566666666665
4352.4398.096666666667-45.6966666666668
5341.6370.756666666667-29.1566666666667
6298.2347.576666666667-49.3766666666666
7355.3336.11666666666719.1833333333334
8330.9348.116666666667-17.2166666666667
9314.5347.456666666667-32.9566666666667
10418.9419.616666666667-0.716666666666741
11433.2402.49666666666730.7033333333333
12367337.39666666666729.6033333333334
13422.9389.47166666666733.4283333333334
14352.1350.8116666666671.28833333333335
15419.8396.35166666666723.4483333333333
16432.7403.39166666666729.3083333333334
17414.2376.05166666666738.1483333333334
18387.7352.87166666666734.8283333333333
19297.2341.411666666667-44.2116666666667
20357.4353.4116666666673.98833333333334
21384.2352.75166666666731.4483333333333
22425.2424.9116666666670.288333333333357
23385.3407.791666666667-22.4916666666666
24355.4342.69166666666712.7083333333333
25409.8457.988888888889-48.1888888888888
26421.2419.3288888888891.87111111111107
27421.8464.868888888889-43.0688888888889
28464.2471.908888888889-7.70888888888884
29494444.56888888888949.4311111111111
30404.2421.388888888889-17.1888888888889
31411.4409.9288888888891.47111111111108
32403.4421.928888888889-18.5288888888889
33403.3421.268888888889-17.9688888888889
34520.9493.42888888888927.4711111111111
35439.8476.308888888889-36.5088888888889
36434.8411.20888888888923.5911111111111
37476.5463.28388888888913.2161111111112
38454.3424.62388888888929.6761111111111
39522470.16388888888951.8361111111111
40498.4477.20388888888921.1961111111111
41439.9449.863888888889-9.9638888888889
42450.7426.68388888888924.0161111111111
43447.1415.22388888888931.8761111111111
44451.3427.22388888888924.0761111111111
45466.8426.56388888888940.2361111111111
46498498.723888888889-0.72388888888886
47533.6481.60388888888951.9961111111111
48451.9416.50388888888935.396111111111
49477.1468.5788888888898.52111111111119
50410.4429.918888888889-19.5188888888889
51469.5475.458888888889-5.95888888888893
52485.4482.4988888888892.90111111111114
53406.7455.158888888889-48.4588888888889
54439.7431.9788888888897.72111111111109
55412.2420.518888888889-8.3188888888889
56440.2432.5188888888897.68111111111113
57411.1431.858888888889-20.7588888888889
58477.7504.018888888889-26.3188888888889
59463.2486.898888888889-23.6988888888889
60320.5421.798888888889-101.298888888889


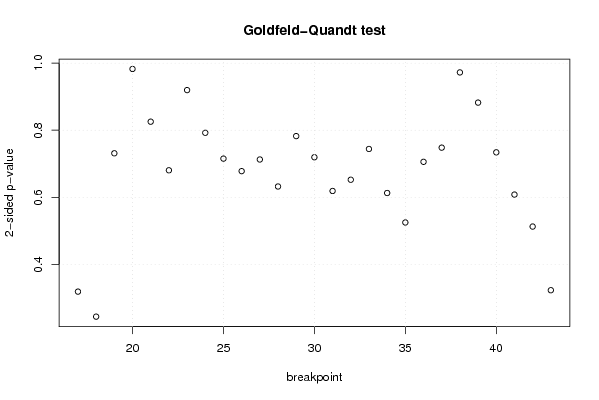
Goldfeld-Quandt test for Heteroskedasticity
p-valuesAlternative Hypothesis
breakpoint indexgreater2-sidedless
170.1594467430021590.3188934860043180.840553256997841
180.1221601677296120.2443203354592230.877839832270388
190.6343850021310980.7312299957378030.365614997868902
200.5086730256404430.9826539487191130.491326974359557
210.4127274478235040.8254548956470090.587272552176496
220.3402850752743160.6805701505486330.659714924725684
230.4598293301734880.9196586603469750.540170669826512
240.3961663463257220.7923326926514440.603833653674278
250.3576796667933940.7153593335867870.642320333206607
260.3390219568626540.6780439137253080.660978043137346
270.3564075074159390.7128150148318770.643592492584061
280.3161399438251190.6322798876502390.683860056174881
290.391247014476530.782494028953060.60875298552347
300.3597051996244210.7194103992488430.640294800375579
310.3094699207415970.6189398414831940.690530079258403
320.3262085592533570.6524171185067140.673791440746643
330.3720462214480440.7440924428960880.627953778551956
340.306452648558140.612905297116280.69354735144186
350.737484820955130.5250303580897410.262515179044870
360.647081596501830.7058368069963390.352918403498169
370.625968276803690.7480634463926210.374031723196310
380.5138283037002580.9723433925994840.486171696299742
390.4411438090467440.8822876180934870.558856190953256
400.3670520726940380.7341041453880750.632947927305962
410.3040821735706640.6081643471413290.695917826429336
420.2564272830207170.5128545660414340.743572716979283
430.1615470459058180.3230940918116370.838452954094182

\begin{tabular}{lllllllll}
\hline
Goldfeld-Quandt test for Heteroskedasticity \tabularnewline
p-values & Alternative Hypothesis \tabularnewline
breakpoint index & greater & 2-sided & less \tabularnewline
17 & 0.159446743002159 & 0.318893486004318 & 0.840553256997841 \tabularnewline
18 & 0.122160167729612 & 0.244320335459223 & 0.877839832270388 \tabularnewline
19 & 0.634385002131098 & 0.731229995737803 & 0.365614997868902 \tabularnewline
20 & 0.508673025640443 & 0.982653948719113 & 0.491326974359557 \tabularnewline
21 & 0.412727447823504 & 0.825454895647009 & 0.587272552176496 \tabularnewline
22 & 0.340285075274316 & 0.680570150548633 & 0.659714924725684 \tabularnewline
23 & 0.459829330173488 & 0.919658660346975 & 0.540170669826512 \tabularnewline
24 & 0.396166346325722 & 0.792332692651444 & 0.603833653674278 \tabularnewline
25 & 0.357679666793394 & 0.715359333586787 & 0.642320333206607 \tabularnewline
26 & 0.339021956862654 & 0.678043913725308 & 0.660978043137346 \tabularnewline
27 & 0.356407507415939 & 0.712815014831877 & 0.643592492584061 \tabularnewline
28 & 0.316139943825119 & 0.632279887650239 & 0.683860056174881 \tabularnewline
29 & 0.39124701447653 & 0.78249402895306 & 0.60875298552347 \tabularnewline
30 & 0.359705199624421 & 0.719410399248843 & 0.640294800375579 \tabularnewline
31 & 0.309469920741597 & 0.618939841483194 & 0.690530079258403 \tabularnewline
32 & 0.326208559253357 & 0.652417118506714 & 0.673791440746643 \tabularnewline
33 & 0.372046221448044 & 0.744092442896088 & 0.627953778551956 \tabularnewline
34 & 0.30645264855814 & 0.61290529711628 & 0.69354735144186 \tabularnewline
35 & 0.73748482095513 & 0.525030358089741 & 0.262515179044870 \tabularnewline
36 & 0.64708159650183 & 0.705836806996339 & 0.352918403498169 \tabularnewline
37 & 0.62596827680369 & 0.748063446392621 & 0.374031723196310 \tabularnewline
38 & 0.513828303700258 & 0.972343392599484 & 0.486171696299742 \tabularnewline
39 & 0.441143809046744 & 0.882287618093487 & 0.558856190953256 \tabularnewline
40 & 0.367052072694038 & 0.734104145388075 & 0.632947927305962 \tabularnewline
41 & 0.304082173570664 & 0.608164347141329 & 0.695917826429336 \tabularnewline
42 & 0.256427283020717 & 0.512854566041434 & 0.743572716979283 \tabularnewline
43 & 0.161547045905818 & 0.323094091811637 & 0.838452954094182 \tabularnewline
\hline
\end{tabular}
%Source: https://freestatistics.org/blog/index.php?pk=25298&T=5

[TABLE]
[ROW][C]Goldfeld-Quandt test for Heteroskedasticity[/C][/ROW]
[ROW][C]p-values[/C][C]Alternative Hypothesis[/C][/ROW]
[ROW][C]breakpoint index[/C][C]greater[/C][C]2-sided[/C][C]less[/C][/ROW]
[ROW][C]17[/C][C]0.159446743002159[/C][C]0.318893486004318[/C][C]0.840553256997841[/C][/ROW]
[ROW][C]18[/C][C]0.122160167729612[/C][C]0.244320335459223[/C][C]0.877839832270388[/C][/ROW]
[ROW][C]19[/C][C]0.634385002131098[/C][C]0.731229995737803[/C][C]0.365614997868902[/C][/ROW]
[ROW][C]20[/C][C]0.508673025640443[/C][C]0.982653948719113[/C][C]0.491326974359557[/C][/ROW]
[ROW][C]21[/C][C]0.412727447823504[/C][C]0.825454895647009[/C][C]0.587272552176496[/C][/ROW]
[ROW][C]22[/C][C]0.340285075274316[/C][C]0.680570150548633[/C][C]0.659714924725684[/C][/ROW]
[ROW][C]23[/C][C]0.459829330173488[/C][C]0.919658660346975[/C][C]0.540170669826512[/C][/ROW]
[ROW][C]24[/C][C]0.396166346325722[/C][C]0.792332692651444[/C][C]0.603833653674278[/C][/ROW]
[ROW][C]25[/C][C]0.357679666793394[/C][C]0.715359333586787[/C][C]0.642320333206607[/C][/ROW]
[ROW][C]26[/C][C]0.339021956862654[/C][C]0.678043913725308[/C][C]0.660978043137346[/C][/ROW]
[ROW][C]27[/C][C]0.356407507415939[/C][C]0.712815014831877[/C][C]0.643592492584061[/C][/ROW]
[ROW][C]28[/C][C]0.316139943825119[/C][C]0.632279887650239[/C][C]0.683860056174881[/C][/ROW]
[ROW][C]29[/C][C]0.39124701447653[/C][C]0.78249402895306[/C][C]0.60875298552347[/C][/ROW]
[ROW][C]30[/C][C]0.359705199624421[/C][C]0.719410399248843[/C][C]0.640294800375579[/C][/ROW]
[ROW][C]31[/C][C]0.309469920741597[/C][C]0.618939841483194[/C][C]0.690530079258403[/C][/ROW]
[ROW][C]32[/C][C]0.326208559253357[/C][C]0.652417118506714[/C][C]0.673791440746643[/C][/ROW]
[ROW][C]33[/C][C]0.372046221448044[/C][C]0.744092442896088[/C][C]0.627953778551956[/C][/ROW]
[ROW][C]34[/C][C]0.30645264855814[/C][C]0.61290529711628[/C][C]0.69354735144186[/C][/ROW]
[ROW][C]35[/C][C]0.73748482095513[/C][C]0.525030358089741[/C][C]0.262515179044870[/C][/ROW]
[ROW][C]36[/C][C]0.64708159650183[/C][C]0.705836806996339[/C][C]0.352918403498169[/C][/ROW]
[ROW][C]37[/C][C]0.62596827680369[/C][C]0.748063446392621[/C][C]0.374031723196310[/C][/ROW]
[ROW][C]38[/C][C]0.513828303700258[/C][C]0.972343392599484[/C][C]0.486171696299742[/C][/ROW]
[ROW][C]39[/C][C]0.441143809046744[/C][C]0.882287618093487[/C][C]0.558856190953256[/C][/ROW]
[ROW][C]40[/C][C]0.367052072694038[/C][C]0.734104145388075[/C][C]0.632947927305962[/C][/ROW]
[ROW][C]41[/C][C]0.304082173570664[/C][C]0.608164347141329[/C][C]0.695917826429336[/C][/ROW]
[ROW][C]42[/C][C]0.256427283020717[/C][C]0.512854566041434[/C][C]0.743572716979283[/C][/ROW]
[ROW][C]43[/C][C]0.161547045905818[/C][C]0.323094091811637[/C][C]0.838452954094182[/C][/ROW]
[/TABLE]
Source: https://freestatistics.org/blog/index.php?pk=25298&T=5

Globally Unique Identifier (entire table): ba.freestatistics.org/blog/index.php?pk=25298&T=5

As an alternative you can also use a QR Code:  

The GUIDs for individual cells are displayed in the table below:

Goldfeld-Quandt test for Heteroskedasticity
p-valuesAlternative Hypothesis
breakpoint indexgreater2-sidedless
170.1594467430021590.3188934860043180.840553256997841
180.1221601677296120.2443203354592230.877839832270388
190.6343850021310980.7312299957378030.365614997868902
200.5086730256404430.9826539487191130.491326974359557
210.4127274478235040.8254548956470090.587272552176496
220.3402850752743160.6805701505486330.659714924725684
230.4598293301734880.9196586603469750.540170669826512
240.3961663463257220.7923326926514440.603833653674278
250.3576796667933940.7153593335867870.642320333206607
260.3390219568626540.6780439137253080.660978043137346
270.3564075074159390.7128150148318770.643592492584061
280.3161399438251190.6322798876502390.683860056174881
290.391247014476530.782494028953060.60875298552347
300.3597051996244210.7194103992488430.640294800375579
310.3094699207415970.6189398414831940.690530079258403
320.3262085592533570.6524171185067140.673791440746643
330.3720462214480440.7440924428960880.627953778551956
340.306452648558140.612905297116280.69354735144186
350.737484820955130.5250303580897410.262515179044870
360.647081596501830.7058368069963390.352918403498169
370.625968276803690.7480634463926210.374031723196310
380.5138283037002580.9723433925994840.486171696299742
390.4411438090467440.8822876180934870.558856190953256
400.3670520726940380.7341041453880750.632947927305962
410.3040821735706640.6081643471413290.695917826429336
420.2564272830207170.5128545660414340.743572716979283
430.1615470459058180.3230940918116370.838452954094182


Meta Analysis of Goldfeld-Quandt test for Heteroskedasticity
Description# significant tests% significant testsOK/NOK
1% type I error level00OK
5% type I error level00OK
10% type I error level00OK

\begin{tabular}{lllllllll}
\hline
Meta Analysis of Goldfeld-Quandt test for Heteroskedasticity \tabularnewline
Description & # significant tests & % significant tests & OK/NOK \tabularnewline
1% type I error level & 0 & 0 & OK \tabularnewline
5% type I error level & 0 & 0 & OK \tabularnewline
10% type I error level & 0 & 0 & OK \tabularnewline
\hline
\end{tabular}
%Source: https://freestatistics.org/blog/index.php?pk=25298&T=6

[TABLE]
[ROW][C]Meta Analysis of Goldfeld-Quandt test for Heteroskedasticity[/C][/ROW]
[ROW][C]Description[/C][C]# significant tests[/C][C]% significant tests[/C][C]OK/NOK[/C][/ROW]
[ROW][C]1% type I error level[/C][C]0[/C][C]0[/C][C]OK[/C][/ROW]
[ROW][C]5% type I error level[/C][C]0[/C][C]0[/C][C]OK[/C][/ROW]
[ROW][C]10% type I error level[/C][C]0[/C][C]0[/C][C]OK[/C][/ROW]
[/TABLE]
Source: https://freestatistics.org/blog/index.php?pk=25298&T=6

Globally Unique Identifier (entire table): ba.freestatistics.org/blog/index.php?pk=25298&T=6

As an alternative you can also use a QR Code:  

The GUIDs for individual cells are displayed in the table below:

Meta Analysis of Goldfeld-Quandt test for Heteroskedasticity
Description# significant tests% significant testsOK/NOK
1% type I error level00OK
5% type I error level00OK
10% type I error level00OK


Parameters (Session):
par1 = 1 ; par2 = Include Monthly Dummies ; par3 = Linear Trend ;
Parameters (R input):
par1 = 1 ; par2 = Include Monthly Dummies ; par3 = Linear Trend ;
R code (references can be found in the software module):
library(lattice)
library(lmtest)
n25 <- 25 #minimum number of obs. for Goldfeld-Quandt test
par1 <- as.numeric(par1)
x <- t(y)
k <- length(x[1,])
n <- length(x[,1])
x1 <- cbind(x[,par1], x[,1:k!=par1])
mycolnames <- c(colnames(x)[par1], colnames(x)[1:k!=par1])
colnames(x1) <- mycolnames #colnames(x)[par1]
x <- x1
if (par3 == 'First Differences'){
x2 <- array(0, dim=c(n-1,k), dimnames=list(1:(n-1), paste('(1-B)',colnames(x),sep='')))
for (i in 1:n-1) {
for (j in 1:k) {
x2[i,j] <- x[i+1,j] - x[i,j]
}
}
x <- x2
}
if (par2 == 'Include Monthly Dummies'){
x2 <- array(0, dim=c(n,11), dimnames=list(1:n, paste('M', seq(1:11), sep ='')))
for (i in 1:11){
x2[seq(i,n,12),i] <- 1
}
x <- cbind(x, x2)
}
if (par2 == 'Include Quarterly Dummies'){
x2 <- array(0, dim=c(n,3), dimnames=list(1:n, paste('Q', seq(1:3), sep ='')))
for (i in 1:3){
x2[seq(i,n,4),i] <- 1
}
x <- cbind(x, x2)
}
k <- length(x[1,])
if (par3 == 'Linear Trend'){
x <- cbind(x, c(1:n))
colnames(x)[k+1] <- 't'
}
x
k <- length(x[1,])
df <- as.data.frame(x)
(mylm <- lm(df))
(mysum <- summary(mylm))
if (n > n25) {
kp3 <- k + 3
nmkm3 <- n - k - 3
gqarr <- array(NA, dim=c(nmkm3-kp3+1,3))
numgqtests <- 0
numsignificant1 <- 0
numsignificant5 <- 0
numsignificant10 <- 0
for (mypoint in kp3:nmkm3) {
j <- 0
numgqtests <- numgqtests + 1
for (myalt in c('greater', 'two.sided', 'less')) {
j <- j + 1
gqarr[mypoint-kp3+1,j] <- gqtest(mylm, point=mypoint, alternative=myalt)$p.value
}
if (gqarr[mypoint-kp3+1,2] < 0.01) numsignificant1 <- numsignificant1 + 1
if (gqarr[mypoint-kp3+1,2] < 0.05) numsignificant5 <- numsignificant5 + 1
if (gqarr[mypoint-kp3+1,2] < 0.10) numsignificant10 <- numsignificant10 + 1
}
gqarr
}
bitmap(file='test0.png')
plot(x[,1], type='l', main='Actuals and Interpolation', ylab='value of Actuals and Interpolation (dots)', xlab='time or index')
points(x[,1]-mysum$resid)
grid()
dev.off()
bitmap(file='test1.png')
plot(mysum$resid, type='b', pch=19, main='Residuals', ylab='value of Residuals', xlab='time or index')
grid()
dev.off()
bitmap(file='test2.png')
hist(mysum$resid, main='Residual Histogram', xlab='values of Residuals')
grid()
dev.off()
bitmap(file='test3.png')
densityplot(~mysum$resid,col='black',main='Residual Density Plot', xlab='values of Residuals')
dev.off()
bitmap(file='test4.png')
qqnorm(mysum$resid, main='Residual Normal Q-Q Plot')
qqline(mysum$resid)
grid()
dev.off()
(myerror <- as.ts(mysum$resid))
bitmap(file='test5.png')
dum <- cbind(lag(myerror,k=1),myerror)
dum
dum1 <- dum[2:length(myerror),]
dum1
z <- as.data.frame(dum1)
z
plot(z,main=paste('Residual Lag plot, lowess, and regression line'), ylab='values of Residuals', xlab='lagged values of Residuals')
lines(lowess(z))
abline(lm(z))
grid()
dev.off()
bitmap(file='test6.png')
acf(mysum$resid, lag.max=length(mysum$resid)/2, main='Residual Autocorrelation Function')
grid()
dev.off()
bitmap(file='test7.png')
pacf(mysum$resid, lag.max=length(mysum$resid)/2, main='Residual Partial Autocorrelation Function')
grid()
dev.off()
bitmap(file='test8.png')
opar <- par(mfrow = c(2,2), oma = c(0, 0, 1.1, 0))
plot(mylm, las = 1, sub='Residual Diagnostics')
par(opar)
dev.off()
if (n > n25) {
bitmap(file='test9.png')
plot(kp3:nmkm3,gqarr[,2], main='Goldfeld-Quandt test',ylab='2-sided p-value',xlab='breakpoint')
grid()
dev.off()
}
load(file='createtable')
a<-table.start()
a<-table.row.start(a)
a<-table.element(a, 'Multiple Linear Regression - Estimated Regression Equation', 1, TRUE)
a<-table.row.end(a)
myeq <- colnames(x)[1]
myeq <- paste(myeq, '[t] = ', sep='')
for (i in 1:k){
if (mysum$coefficients[i,1] > 0) myeq <- paste(myeq, '+', '')
myeq <- paste(myeq, mysum$coefficients[i,1], sep=' ')
if (rownames(mysum$coefficients)[i] != '(Intercept)') {
myeq <- paste(myeq, rownames(mysum$coefficients)[i], sep='')
if (rownames(mysum$coefficients)[i] != 't') myeq <- paste(myeq, '[t]', sep='')
}
}
myeq <- paste(myeq, ' + e[t]')
a<-table.row.start(a)
a<-table.element(a, myeq)
a<-table.row.end(a)
a<-table.end(a)
table.save(a,file='mytable1.tab')
a<-table.start()
a<-table.row.start(a)
a<-table.element(a,hyperlink('ols1.htm','Multiple Linear Regression - Ordinary Least Squares',''), 6, TRUE)
a<-table.row.end(a)
a<-table.row.start(a)
a<-table.element(a,'Variable',header=TRUE)
a<-table.element(a,'Parameter',header=TRUE)
a<-table.element(a,'S.D.',header=TRUE)
a<-table.element(a,'T-STAT
H0: parameter = 0',header=TRUE)
a<-table.element(a,'2-tail p-value',header=TRUE)
a<-table.element(a,'1-tail p-value',header=TRUE)
a<-table.row.end(a)
for (i in 1:k){
a<-table.row.start(a)
a<-table.element(a,rownames(mysum$coefficients)[i],header=TRUE)
a<-table.element(a,mysum$coefficients[i,1])
a<-table.element(a, round(mysum$coefficients[i,2],6))
a<-table.element(a, round(mysum$coefficients[i,3],4))
a<-table.element(a, round(mysum$coefficients[i,4],6))
a<-table.element(a, round(mysum$coefficients[i,4]/2,6))
a<-table.row.end(a)
}
a<-table.end(a)
table.save(a,file='mytable2.tab')
a<-table.start()
a<-table.row.start(a)
a<-table.element(a, 'Multiple Linear Regression - Regression Statistics', 2, TRUE)
a<-table.row.end(a)
a<-table.row.start(a)
a<-table.element(a, 'Multiple R',1,TRUE)
a<-table.element(a, sqrt(mysum$r.squared))
a<-table.row.end(a)
a<-table.row.start(a)
a<-table.element(a, 'R-squared',1,TRUE)
a<-table.element(a, mysum$r.squared)
a<-table.row.end(a)
a<-table.row.start(a)
a<-table.element(a, 'Adjusted R-squared',1,TRUE)
a<-table.element(a, mysum$adj.r.squared)
a<-table.row.end(a)
a<-table.row.start(a)
a<-table.element(a, 'F-TEST (value)',1,TRUE)
a<-table.element(a, mysum$fstatistic[1])
a<-table.row.end(a)
a<-table.row.start(a)
a<-table.element(a, 'F-TEST (DF numerator)',1,TRUE)
a<-table.element(a, mysum$fstatistic[2])
a<-table.row.end(a)
a<-table.row.start(a)
a<-table.element(a, 'F-TEST (DF denominator)',1,TRUE)
a<-table.element(a, mysum$fstatistic[3])
a<-table.row.end(a)
a<-table.row.start(a)
a<-table.element(a, 'p-value',1,TRUE)
a<-table.element(a, 1-pf(mysum$fstatistic[1],mysum$fstatistic[2],mysum$fstatistic[3]))
a<-table.row.end(a)
a<-table.row.start(a)
a<-table.element(a, 'Multiple Linear Regression - Residual Statistics', 2, TRUE)
a<-table.row.end(a)
a<-table.row.start(a)
a<-table.element(a, 'Residual Standard Deviation',1,TRUE)
a<-table.element(a, mysum$sigma)
a<-table.row.end(a)
a<-table.row.start(a)
a<-table.element(a, 'Sum Squared Residuals',1,TRUE)
a<-table.element(a, sum(myerror*myerror))
a<-table.row.end(a)
a<-table.end(a)
table.save(a,file='mytable3.tab')
a<-table.start()
a<-table.row.start(a)
a<-table.element(a, 'Multiple Linear Regression - Actuals, Interpolation, and Residuals', 4, TRUE)
a<-table.row.end(a)
a<-table.row.start(a)
a<-table.element(a, 'Time or Index', 1, TRUE)
a<-table.element(a, 'Actuals', 1, TRUE)
a<-table.element(a, 'Interpolation
Forecast', 1, TRUE)
a<-table.element(a, 'Residuals
Prediction Error', 1, TRUE)
a<-table.row.end(a)
for (i in 1:n) {
a<-table.row.start(a)
a<-table.element(a,i, 1, TRUE)
a<-table.element(a,x[i])
a<-table.element(a,x[i]-mysum$resid[i])
a<-table.element(a,mysum$resid[i])
a<-table.row.end(a)
}
a<-table.end(a)
table.save(a,file='mytable4.tab')
if (n > n25) {
a<-table.start()
a<-table.row.start(a)
a<-table.element(a,'Goldfeld-Quandt test for Heteroskedasticity',4,TRUE)
a<-table.row.end(a)
a<-table.row.start(a)
a<-table.element(a,'p-values',header=TRUE)
a<-table.element(a,'Alternative Hypothesis',3,header=TRUE)
a<-table.row.end(a)
a<-table.row.start(a)
a<-table.element(a,'breakpoint index',header=TRUE)
a<-table.element(a,'greater',header=TRUE)
a<-table.element(a,'2-sided',header=TRUE)
a<-table.element(a,'less',header=TRUE)
a<-table.row.end(a)
for (mypoint in kp3:nmkm3) {
a<-table.row.start(a)
a<-table.element(a,mypoint,header=TRUE)
a<-table.element(a,gqarr[mypoint-kp3+1,1])
a<-table.element(a,gqarr[mypoint-kp3+1,2])
a<-table.element(a,gqarr[mypoint-kp3+1,3])
a<-table.row.end(a)
}
a<-table.end(a)
table.save(a,file='mytable5.tab')
a<-table.start()
a<-table.row.start(a)
a<-table.element(a,'Meta Analysis of Goldfeld-Quandt test for Heteroskedasticity',4,TRUE)
a<-table.row.end(a)
a<-table.row.start(a)
a<-table.element(a,'Description',header=TRUE)
a<-table.element(a,'# significant tests',header=TRUE)
a<-table.element(a,'% significant tests',header=TRUE)
a<-table.element(a,'OK/NOK',header=TRUE)
a<-table.row.end(a)
a<-table.row.start(a)
a<-table.element(a,'1% type I error level',header=TRUE)
a<-table.element(a,numsignificant1)
a<-table.element(a,numsignificant1/numgqtests)
if (numsignificant1/numgqtests < 0.01) dum <- 'OK' else dum <- 'NOK'
a<-table.element(a,dum)
a<-table.row.end(a)
a<-table.row.start(a)
a<-table.element(a,'5% type I error level',header=TRUE)
a<-table.element(a,numsignificant5)
a<-table.element(a,numsignificant5/numgqtests)
if (numsignificant5/numgqtests < 0.05) dum <- 'OK' else dum <- 'NOK'
a<-table.element(a,dum)
a<-table.row.end(a)
a<-table.row.start(a)
a<-table.element(a,'10% type I error level',header=TRUE)
a<-table.element(a,numsignificant10)
a<-table.element(a,numsignificant10/numgqtests)
if (numsignificant10/numgqtests < 0.1) dum <- 'OK' else dum <- 'NOK'
a<-table.element(a,dum)
a<-table.row.end(a)
a<-table.end(a)
table.save(a,file='mytable6.tab')
}