Free Statistics

of Irreproducible Research!

Author's title

Author*The author of this computation has been verified*
R Software Modulerwasp_multipleregression.wasp
Title produced by softwareMultiple Regression
Date of computationSun, 23 Nov 2008 05:17:19 -0700
Cite this page as followsStatistical Computations at FreeStatistics.org, Office for Research Development and Education, URL https://freestatistics.org/blog/index.php?v=date/2008/Nov/23/t1227442961tp69vocosxibcot.htm/, Retrieved Sun, 19 May 2024 11:13:13 +0000
Statistical Computations at FreeStatistics.org, Office for Research Development and Education, URL https://freestatistics.org/blog/index.php?pk=25230, Retrieved Sun, 19 May 2024 11:13:13 +0000
QR Codes:

Original text written by user:
IsPrivate?No (this computation is public)
User-defined keywords
Estimated Impact188
Family? (F = Feedback message, R = changed R code, M = changed R Module, P = changed Parameters, D = changed Data)
F     [Multiple Regression] [Q1: the Seatbelt ...] [2008-11-23 11:06:35] [44ec60eb6065a3f81a5f756bd5af1faf]
F    D    [Multiple Regression] [Werkloosheid <25 ...] [2008-11-23 12:17:19] [924502d03698cd41cacbcd1327858815] [Current]
Feedback Forum
2008-11-30 17:16:09 [Inge Meelberghs] [reply
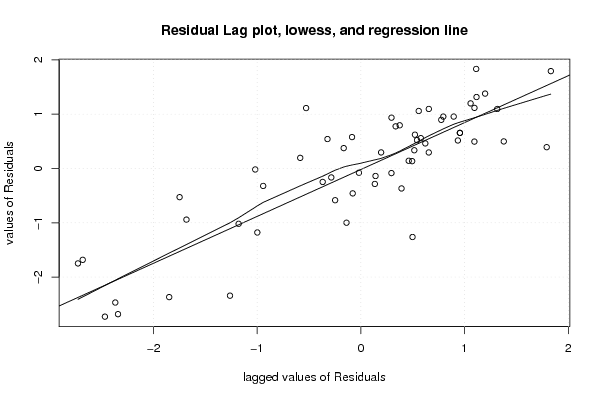
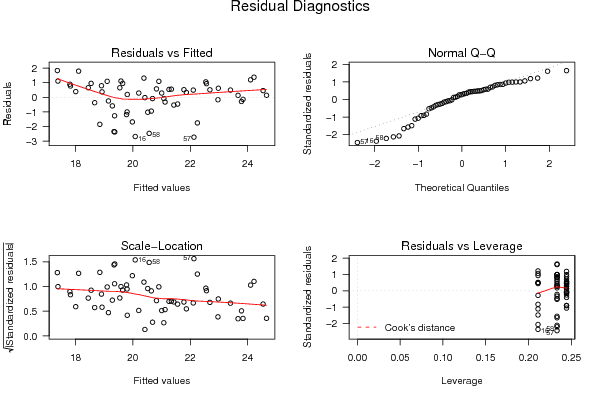
Om na te gaan of je model in orde is moeten we nagaan of al de voorwaarden voldaan zijn:

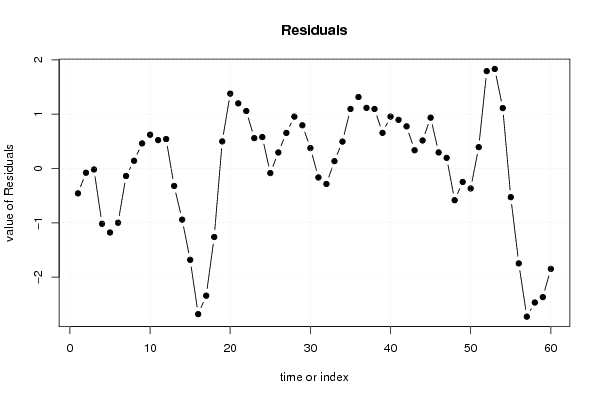
- de residuals zijn zeker niet constant of gelijk aan nul. Dit is zeer duidelijk op de grafiek te zien door de vele schommelingen en hoge pieken.

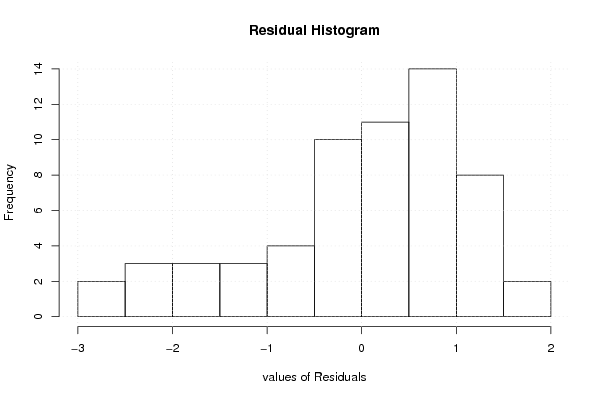
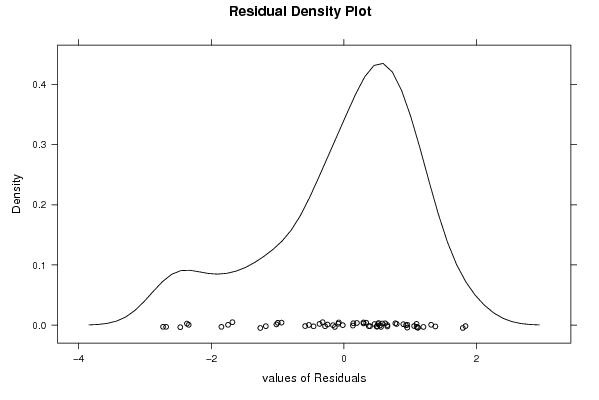
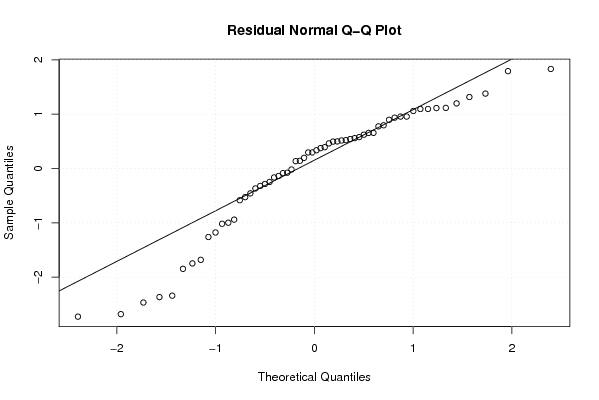
- Men zou op het eerste zicht denken dat er sprake is van een normaalverdeling. Maar als we dan dichter naar de histogram en de density plot kijken kunnen we toch zien dat er zich een liche scheve verdeling aan de linkerkant bevind.

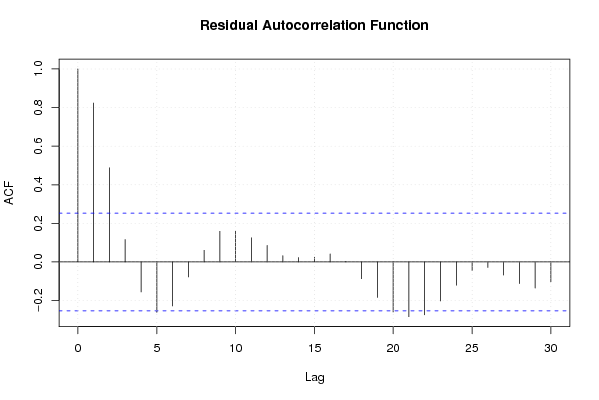
- Er is wel niet onmiddelijk sprake van autocorrelatie omdat er geen sprake is van een terugkerend patroon en de pieken zich niet buiten de 95% interval bevinden. Deze voorwaarde is dus wel voldaan.

Uit bovenstaande vastellingen kunnen we dus zeggen dat je model nog niet helemaal in orde is.

Ook hier had je misschien twee berekeningen kunnen maken van je tijdreeksen. Een zonder en een mét rekening te houden met dummies en seizoenale trend.

Met dummies en seizoenale trend:
==> na invoering van het generatiepact zou de werkloosheid van jongeren<25 jaar dalen met 0,66. De t waarde bedraagt -0,036. Dit wil zeggen dat de werkloosheid bij jongeren <25 jaar nog eens daalt met dit cijfer.
Voor januari zou het aantal verkeerslachtoffers neerkomen op: 21.69-0.100- 0,036
Voor februari: 21.69 - 0.54 - 0,036

2008-12-01 23:07:15 [Bernard Femont] [reply
correcte oplossing, al kon men met en zonder seizoeniale trends gaan berekenen om een beter verloop te zien

model is goed maar zou meer afgewerkter kunnen

Post a new message
Dataseries X:
21.1	0
21	0
20.4	0
19.5	0
18.6	0
18.8	0
23.7	0
24.8	0
25	0
23.6	0
22.3	0
21.8	0
20.8	0
19.7	0
18.3	0
17.4	0
17	0
18.1	0
23.9	0
25.6	0
25.3	0
23.6	0
21.9	0
21.4	0
20.6	0
20.5	0
20.2	0
20.6	0
19.7	0
19.3	0
22.8	0
23.5	0
23.8	0
22.6	0
22	0
21.7	0
20.7	1
20.2	1
19.1	1
19.5	1
18.7	1
18.6	1
22.2	1
23.2	1
23.5	1
21.3	1
20	1
18.7	1
18.9	1
18.3	1
18.4	1
19.9	1
19.2	1
18.5	1
20.9	1
20.5	1
19.4	1
18.1	1
17	1
17	1


Summary of computational transaction
Raw Inputview raw input (R code)
Raw Outputview raw output of R engine
Computing time3 seconds
R Server'Gwilym Jenkins' @ 72.249.127.135

\begin{tabular}{lllllllll}
\hline
Summary of computational transaction \tabularnewline
Raw Input & view raw input (R code)  \tabularnewline
Raw Output & view raw output of R engine  \tabularnewline
Computing time & 3 seconds \tabularnewline
R Server & 'Gwilym Jenkins' @ 72.249.127.135 \tabularnewline
\hline
\end{tabular}
%Source: https://freestatistics.org/blog/index.php?pk=25230&T=0

[TABLE]
[ROW][C]Summary of computational transaction[/C][/ROW]
[ROW][C]Raw Input[/C][C]view raw input (R code) [/C][/ROW]
[ROW][C]Raw Output[/C][C]view raw output of R engine [/C][/ROW]
[ROW][C]Computing time[/C][C]3 seconds[/C][/ROW]
[ROW][C]R Server[/C][C]'Gwilym Jenkins' @ 72.249.127.135[/C][/ROW]
[/TABLE]
Source: https://freestatistics.org/blog/index.php?pk=25230&T=0

Globally Unique Identifier (entire table): ba.freestatistics.org/blog/index.php?pk=25230&T=0

As an alternative you can also use a QR Code:  

The GUIDs for individual cells are displayed in the table below:

Summary of computational transaction
Raw Inputview raw input (R code)
Raw Outputview raw output of R engine
Computing time3 seconds
R Server'Gwilym Jenkins' @ 72.249.127.135


Multiple Linear Regression - Estimated Regression Equation
Werkloosheid<25jr[t] = + 21.6955555555555 -0.663888888888897Generatiepact[t] -0.100277777777804M1[t] -0.543888888888886M2[t] -1.16750000000000M3[t] -1.03111111111111M4[t] -1.73472222222222M5[t] -1.67833333333333M6[t] + 2.39805555555556M7[t] + 3.25444444444445M8[t] + 3.17083333333334M9[t] + 1.64722222222222M10[t] + 0.483611111111110M11[t] -0.0363888888888885t + e[t]

\begin{tabular}{lllllllll}
\hline
Multiple Linear Regression - Estimated Regression Equation \tabularnewline
Werkloosheid<25jr[t] =  +  21.6955555555555 -0.663888888888897Generatiepact[t] -0.100277777777804M1[t] -0.543888888888886M2[t] -1.16750000000000M3[t] -1.03111111111111M4[t] -1.73472222222222M5[t] -1.67833333333333M6[t] +  2.39805555555556M7[t] +  3.25444444444445M8[t] +  3.17083333333334M9[t] +  1.64722222222222M10[t] +  0.483611111111110M11[t] -0.0363888888888885t  + e[t] \tabularnewline
\hline
\end{tabular}
%Source: https://freestatistics.org/blog/index.php?pk=25230&T=1

[TABLE]
[ROW][C]Multiple Linear Regression - Estimated Regression Equation[/C][/ROW]
[ROW][C]Werkloosheid<25jr[t] =  +  21.6955555555555 -0.663888888888897Generatiepact[t] -0.100277777777804M1[t] -0.543888888888886M2[t] -1.16750000000000M3[t] -1.03111111111111M4[t] -1.73472222222222M5[t] -1.67833333333333M6[t] +  2.39805555555556M7[t] +  3.25444444444445M8[t] +  3.17083333333334M9[t] +  1.64722222222222M10[t] +  0.483611111111110M11[t] -0.0363888888888885t  + e[t][/C][/ROW]
[/TABLE]
Source: https://freestatistics.org/blog/index.php?pk=25230&T=1

Globally Unique Identifier (entire table): ba.freestatistics.org/blog/index.php?pk=25230&T=1

As an alternative you can also use a QR Code:  

The GUIDs for individual cells are displayed in the table below:

Multiple Linear Regression - Estimated Regression Equation
Werkloosheid<25jr[t] = + 21.6955555555555 -0.663888888888897Generatiepact[t] -0.100277777777804M1[t] -0.543888888888886M2[t] -1.16750000000000M3[t] -1.03111111111111M4[t] -1.73472222222222M5[t] -1.67833333333333M6[t] + 2.39805555555556M7[t] + 3.25444444444445M8[t] + 3.17083333333334M9[t] + 1.64722222222222M10[t] + 0.483611111111110M11[t] -0.0363888888888885t + e[t]


Multiple Linear Regression - Ordinary Least Squares
VariableParameterS.D.T-STATH0: parameter = 02-tail p-value1-tail p-value
(Intercept)21.69555555555550.74809229.001200
Generatiepact-0.6638888888888970.671806-0.98820.3282170.164109
M1-0.1002777777778040.833915-0.12020.9048090.452405
M2-0.5438888888888860.829166-0.65590.5151260.257563
M3-1.167500000000000.824846-1.41540.1636820.081841
M4-1.031111111111110.820961-1.2560.2154650.107732
M5-1.734722222222220.817518-2.12190.039260.01963
M6-1.678333333333330.814522-2.06050.0450310.022515
M72.398055555555560.8119782.95330.0049380.002469
M83.254444444444450.8098914.01840.0002150.000108
M93.170833333333340.8082643.9230.000290.000145
M101.647222222222220.80712.04090.0470220.023511
M110.4836111111111100.8064010.59970.5516390.275819
t-0.03638888888888850.019393-1.87640.0669590.03348

\begin{tabular}{lllllllll}
\hline
Multiple Linear Regression - Ordinary Least Squares \tabularnewline
Variable & Parameter & S.D. & T-STATH0: parameter = 0 & 2-tail p-value & 1-tail p-value \tabularnewline
(Intercept) & 21.6955555555555 & 0.748092 & 29.0012 & 0 & 0 \tabularnewline
Generatiepact & -0.663888888888897 & 0.671806 & -0.9882 & 0.328217 & 0.164109 \tabularnewline
M1 & -0.100277777777804 & 0.833915 & -0.1202 & 0.904809 & 0.452405 \tabularnewline
M2 & -0.543888888888886 & 0.829166 & -0.6559 & 0.515126 & 0.257563 \tabularnewline
M3 & -1.16750000000000 & 0.824846 & -1.4154 & 0.163682 & 0.081841 \tabularnewline
M4 & -1.03111111111111 & 0.820961 & -1.256 & 0.215465 & 0.107732 \tabularnewline
M5 & -1.73472222222222 & 0.817518 & -2.1219 & 0.03926 & 0.01963 \tabularnewline
M6 & -1.67833333333333 & 0.814522 & -2.0605 & 0.045031 & 0.022515 \tabularnewline
M7 & 2.39805555555556 & 0.811978 & 2.9533 & 0.004938 & 0.002469 \tabularnewline
M8 & 3.25444444444445 & 0.809891 & 4.0184 & 0.000215 & 0.000108 \tabularnewline
M9 & 3.17083333333334 & 0.808264 & 3.923 & 0.00029 & 0.000145 \tabularnewline
M10 & 1.64722222222222 & 0.8071 & 2.0409 & 0.047022 & 0.023511 \tabularnewline
M11 & 0.483611111111110 & 0.806401 & 0.5997 & 0.551639 & 0.275819 \tabularnewline
t & -0.0363888888888885 & 0.019393 & -1.8764 & 0.066959 & 0.03348 \tabularnewline
\hline
\end{tabular}
%Source: https://freestatistics.org/blog/index.php?pk=25230&T=2

[TABLE]
[ROW][C]Multiple Linear Regression - Ordinary Least Squares[/C][/ROW]
[ROW][C]Variable[/C][C]Parameter[/C][C]S.D.[/C][C]T-STATH0: parameter = 0[/C][C]2-tail p-value[/C][C]1-tail p-value[/C][/ROW]
[ROW][C](Intercept)[/C][C]21.6955555555555[/C][C]0.748092[/C][C]29.0012[/C][C]0[/C][C]0[/C][/ROW]
[ROW][C]Generatiepact[/C][C]-0.663888888888897[/C][C]0.671806[/C][C]-0.9882[/C][C]0.328217[/C][C]0.164109[/C][/ROW]
[ROW][C]M1[/C][C]-0.100277777777804[/C][C]0.833915[/C][C]-0.1202[/C][C]0.904809[/C][C]0.452405[/C][/ROW]
[ROW][C]M2[/C][C]-0.543888888888886[/C][C]0.829166[/C][C]-0.6559[/C][C]0.515126[/C][C]0.257563[/C][/ROW]
[ROW][C]M3[/C][C]-1.16750000000000[/C][C]0.824846[/C][C]-1.4154[/C][C]0.163682[/C][C]0.081841[/C][/ROW]
[ROW][C]M4[/C][C]-1.03111111111111[/C][C]0.820961[/C][C]-1.256[/C][C]0.215465[/C][C]0.107732[/C][/ROW]
[ROW][C]M5[/C][C]-1.73472222222222[/C][C]0.817518[/C][C]-2.1219[/C][C]0.03926[/C][C]0.01963[/C][/ROW]
[ROW][C]M6[/C][C]-1.67833333333333[/C][C]0.814522[/C][C]-2.0605[/C][C]0.045031[/C][C]0.022515[/C][/ROW]
[ROW][C]M7[/C][C]2.39805555555556[/C][C]0.811978[/C][C]2.9533[/C][C]0.004938[/C][C]0.002469[/C][/ROW]
[ROW][C]M8[/C][C]3.25444444444445[/C][C]0.809891[/C][C]4.0184[/C][C]0.000215[/C][C]0.000108[/C][/ROW]
[ROW][C]M9[/C][C]3.17083333333334[/C][C]0.808264[/C][C]3.923[/C][C]0.00029[/C][C]0.000145[/C][/ROW]
[ROW][C]M10[/C][C]1.64722222222222[/C][C]0.8071[/C][C]2.0409[/C][C]0.047022[/C][C]0.023511[/C][/ROW]
[ROW][C]M11[/C][C]0.483611111111110[/C][C]0.806401[/C][C]0.5997[/C][C]0.551639[/C][C]0.275819[/C][/ROW]
[ROW][C]t[/C][C]-0.0363888888888885[/C][C]0.019393[/C][C]-1.8764[/C][C]0.066959[/C][C]0.03348[/C][/ROW]
[/TABLE]
Source: https://freestatistics.org/blog/index.php?pk=25230&T=2

Globally Unique Identifier (entire table): ba.freestatistics.org/blog/index.php?pk=25230&T=2

As an alternative you can also use a QR Code:  

The GUIDs for individual cells are displayed in the table below:

Multiple Linear Regression - Ordinary Least Squares
VariableParameterS.D.T-STATH0: parameter = 02-tail p-value1-tail p-value
(Intercept)21.69555555555550.74809229.001200
Generatiepact-0.6638888888888970.671806-0.98820.3282170.164109
M1-0.1002777777778040.833915-0.12020.9048090.452405
M2-0.5438888888888860.829166-0.65590.5151260.257563
M3-1.167500000000000.824846-1.41540.1636820.081841
M4-1.031111111111110.820961-1.2560.2154650.107732
M5-1.734722222222220.817518-2.12190.039260.01963
M6-1.678333333333330.814522-2.06050.0450310.022515
M72.398055555555560.8119782.95330.0049380.002469
M83.254444444444450.8098914.01840.0002150.000108
M93.170833333333340.8082643.9230.000290.000145
M101.647222222222220.80712.04090.0470220.023511
M110.4836111111111100.8064010.59970.5516390.275819
t-0.03638888888888850.019393-1.87640.0669590.03348


Multiple Linear Regression - Regression Statistics
Multiple R0.863258118963442
R-squared0.7452145799563
Adjusted R-squared0.673210004726559
F-TEST (value)10.3495448390409
F-TEST (DF numerator)13
F-TEST (DF denominator)46
p-value1.03778219351369e-09
Multiple Linear Regression - Residual Statistics
Residual Standard Deviation1.27466297525389
Sum Squared Residuals74.7392222222224

\begin{tabular}{lllllllll}
\hline
Multiple Linear Regression - Regression Statistics \tabularnewline
Multiple R & 0.863258118963442 \tabularnewline
R-squared & 0.7452145799563 \tabularnewline
Adjusted R-squared & 0.673210004726559 \tabularnewline
F-TEST (value) & 10.3495448390409 \tabularnewline
F-TEST (DF numerator) & 13 \tabularnewline
F-TEST (DF denominator) & 46 \tabularnewline
p-value & 1.03778219351369e-09 \tabularnewline
Multiple Linear Regression - Residual Statistics \tabularnewline
Residual Standard Deviation & 1.27466297525389 \tabularnewline
Sum Squared Residuals & 74.7392222222224 \tabularnewline
\hline
\end{tabular}
%Source: https://freestatistics.org/blog/index.php?pk=25230&T=3

[TABLE]
[ROW][C]Multiple Linear Regression - Regression Statistics[/C][/ROW]
[ROW][C]Multiple R[/C][C]0.863258118963442[/C][/ROW]
[ROW][C]R-squared[/C][C]0.7452145799563[/C][/ROW]
[ROW][C]Adjusted R-squared[/C][C]0.673210004726559[/C][/ROW]
[ROW][C]F-TEST (value)[/C][C]10.3495448390409[/C][/ROW]
[ROW][C]F-TEST (DF numerator)[/C][C]13[/C][/ROW]
[ROW][C]F-TEST (DF denominator)[/C][C]46[/C][/ROW]
[ROW][C]p-value[/C][C]1.03778219351369e-09[/C][/ROW]
[ROW][C]Multiple Linear Regression - Residual Statistics[/C][/ROW]
[ROW][C]Residual Standard Deviation[/C][C]1.27466297525389[/C][/ROW]
[ROW][C]Sum Squared Residuals[/C][C]74.7392222222224[/C][/ROW]
[/TABLE]
Source: https://freestatistics.org/blog/index.php?pk=25230&T=3

Globally Unique Identifier (entire table): ba.freestatistics.org/blog/index.php?pk=25230&T=3

As an alternative you can also use a QR Code:  

The GUIDs for individual cells are displayed in the table below:

Multiple Linear Regression - Regression Statistics
Multiple R0.863258118963442
R-squared0.7452145799563
Adjusted R-squared0.673210004726559
F-TEST (value)10.3495448390409
F-TEST (DF numerator)13
F-TEST (DF denominator)46
p-value1.03778219351369e-09
Multiple Linear Regression - Residual Statistics
Residual Standard Deviation1.27466297525389
Sum Squared Residuals74.7392222222224


Multiple Linear Regression - Actuals, Interpolation, and Residuals
Time or IndexActualsInterpolationForecastResidualsPrediction Error
121.121.558888888889-0.458888888889002
22121.0788888888889-0.0788888888888846
320.420.4188888888889-0.0188888888888837
419.520.5188888888889-1.01888888888888
518.619.7788888888889-1.17888888888888
618.819.7988888888889-0.99888888888888
723.723.8388888888889-0.138888888888885
824.824.65888888888890.141111111111125
92524.53888888888890.461111111111118
1023.622.97888888888890.621111111111117
1122.321.77888888888890.521111111111116
1221.821.25888888888890.541111111111117
1320.821.1222222222222-0.32222222222219
1419.720.6422222222222-0.94222222222222
1518.319.9822222222222-1.68222222222222
1617.420.0822222222222-2.68222222222222
171719.3422222222222-2.34222222222222
1818.119.3622222222222-1.26222222222222
1923.923.40222222222220.49777777777778
2025.624.22222222222221.37777777777778
2125.324.10222222222221.19777777777778
2223.622.54222222222221.05777777777778
2321.921.34222222222220.557777777777779
2421.420.82222222222220.577777777777778
2520.620.6855555555555-0.0855555555555277
2620.520.20555555555560.294444444444442
2720.219.54555555555560.65444444444444
2820.619.64555555555560.954444444444443
2919.718.90555555555560.79444444444444
3019.318.92555555555560.374444444444441
3122.822.9655555555556-0.165555555555557
3223.523.7855555555556-0.285555555555561
3323.823.66555555555560.134444444444442
3422.622.10555555555560.494444444444442
352220.90555555555561.09444444444444
3621.720.38555555555561.31444444444444
3720.719.58500000000001.11500000000003
3820.219.1051.095
3919.118.4450.655000000000002
4019.518.5450.955000000000001
4118.717.8050.895
4218.617.8250.775
4322.221.8650.335000000000001
4423.222.6850.514999999999998
4523.522.5650.935
4621.321.0050.295
472019.8050.195000000000001
4818.719.285-0.585
4918.919.1483333333333-0.248333333333309
5018.318.6683333333333-0.368333333333336
5118.418.00833333333330.391666666666661
5219.918.10833333333331.79166666666666
5319.217.36833333333331.83166666666666
5418.517.38833333333331.11166666666666
5520.921.4283333333333-0.528333333333338
5620.522.2483333333333-1.74833333333334
5719.422.1283333333333-2.72833333333334
5818.120.5683333333333-2.46833333333334
591719.3683333333333-2.36833333333334
601718.8483333333333-1.84833333333334

\begin{tabular}{lllllllll}
\hline
Multiple Linear Regression - Actuals, Interpolation, and Residuals \tabularnewline
Time or Index & Actuals & InterpolationForecast & ResidualsPrediction Error \tabularnewline
1 & 21.1 & 21.558888888889 & -0.458888888889002 \tabularnewline
2 & 21 & 21.0788888888889 & -0.0788888888888846 \tabularnewline
3 & 20.4 & 20.4188888888889 & -0.0188888888888837 \tabularnewline
4 & 19.5 & 20.5188888888889 & -1.01888888888888 \tabularnewline
5 & 18.6 & 19.7788888888889 & -1.17888888888888 \tabularnewline
6 & 18.8 & 19.7988888888889 & -0.99888888888888 \tabularnewline
7 & 23.7 & 23.8388888888889 & -0.138888888888885 \tabularnewline
8 & 24.8 & 24.6588888888889 & 0.141111111111125 \tabularnewline
9 & 25 & 24.5388888888889 & 0.461111111111118 \tabularnewline
10 & 23.6 & 22.9788888888889 & 0.621111111111117 \tabularnewline
11 & 22.3 & 21.7788888888889 & 0.521111111111116 \tabularnewline
12 & 21.8 & 21.2588888888889 & 0.541111111111117 \tabularnewline
13 & 20.8 & 21.1222222222222 & -0.32222222222219 \tabularnewline
14 & 19.7 & 20.6422222222222 & -0.94222222222222 \tabularnewline
15 & 18.3 & 19.9822222222222 & -1.68222222222222 \tabularnewline
16 & 17.4 & 20.0822222222222 & -2.68222222222222 \tabularnewline
17 & 17 & 19.3422222222222 & -2.34222222222222 \tabularnewline
18 & 18.1 & 19.3622222222222 & -1.26222222222222 \tabularnewline
19 & 23.9 & 23.4022222222222 & 0.49777777777778 \tabularnewline
20 & 25.6 & 24.2222222222222 & 1.37777777777778 \tabularnewline
21 & 25.3 & 24.1022222222222 & 1.19777777777778 \tabularnewline
22 & 23.6 & 22.5422222222222 & 1.05777777777778 \tabularnewline
23 & 21.9 & 21.3422222222222 & 0.557777777777779 \tabularnewline
24 & 21.4 & 20.8222222222222 & 0.577777777777778 \tabularnewline
25 & 20.6 & 20.6855555555555 & -0.0855555555555277 \tabularnewline
26 & 20.5 & 20.2055555555556 & 0.294444444444442 \tabularnewline
27 & 20.2 & 19.5455555555556 & 0.65444444444444 \tabularnewline
28 & 20.6 & 19.6455555555556 & 0.954444444444443 \tabularnewline
29 & 19.7 & 18.9055555555556 & 0.79444444444444 \tabularnewline
30 & 19.3 & 18.9255555555556 & 0.374444444444441 \tabularnewline
31 & 22.8 & 22.9655555555556 & -0.165555555555557 \tabularnewline
32 & 23.5 & 23.7855555555556 & -0.285555555555561 \tabularnewline
33 & 23.8 & 23.6655555555556 & 0.134444444444442 \tabularnewline
34 & 22.6 & 22.1055555555556 & 0.494444444444442 \tabularnewline
35 & 22 & 20.9055555555556 & 1.09444444444444 \tabularnewline
36 & 21.7 & 20.3855555555556 & 1.31444444444444 \tabularnewline
37 & 20.7 & 19.5850000000000 & 1.11500000000003 \tabularnewline
38 & 20.2 & 19.105 & 1.095 \tabularnewline
39 & 19.1 & 18.445 & 0.655000000000002 \tabularnewline
40 & 19.5 & 18.545 & 0.955000000000001 \tabularnewline
41 & 18.7 & 17.805 & 0.895 \tabularnewline
42 & 18.6 & 17.825 & 0.775 \tabularnewline
43 & 22.2 & 21.865 & 0.335000000000001 \tabularnewline
44 & 23.2 & 22.685 & 0.514999999999998 \tabularnewline
45 & 23.5 & 22.565 & 0.935 \tabularnewline
46 & 21.3 & 21.005 & 0.295 \tabularnewline
47 & 20 & 19.805 & 0.195000000000001 \tabularnewline
48 & 18.7 & 19.285 & -0.585 \tabularnewline
49 & 18.9 & 19.1483333333333 & -0.248333333333309 \tabularnewline
50 & 18.3 & 18.6683333333333 & -0.368333333333336 \tabularnewline
51 & 18.4 & 18.0083333333333 & 0.391666666666661 \tabularnewline
52 & 19.9 & 18.1083333333333 & 1.79166666666666 \tabularnewline
53 & 19.2 & 17.3683333333333 & 1.83166666666666 \tabularnewline
54 & 18.5 & 17.3883333333333 & 1.11166666666666 \tabularnewline
55 & 20.9 & 21.4283333333333 & -0.528333333333338 \tabularnewline
56 & 20.5 & 22.2483333333333 & -1.74833333333334 \tabularnewline
57 & 19.4 & 22.1283333333333 & -2.72833333333334 \tabularnewline
58 & 18.1 & 20.5683333333333 & -2.46833333333334 \tabularnewline
59 & 17 & 19.3683333333333 & -2.36833333333334 \tabularnewline
60 & 17 & 18.8483333333333 & -1.84833333333334 \tabularnewline
\hline
\end{tabular}
%Source: https://freestatistics.org/blog/index.php?pk=25230&T=4

[TABLE]
[ROW][C]Multiple Linear Regression - Actuals, Interpolation, and Residuals[/C][/ROW]
[ROW][C]Time or Index[/C][C]Actuals[/C][C]InterpolationForecast[/C][C]ResidualsPrediction Error[/C][/ROW]
[ROW][C]1[/C][C]21.1[/C][C]21.558888888889[/C][C]-0.458888888889002[/C][/ROW]
[ROW][C]2[/C][C]21[/C][C]21.0788888888889[/C][C]-0.0788888888888846[/C][/ROW]
[ROW][C]3[/C][C]20.4[/C][C]20.4188888888889[/C][C]-0.0188888888888837[/C][/ROW]
[ROW][C]4[/C][C]19.5[/C][C]20.5188888888889[/C][C]-1.01888888888888[/C][/ROW]
[ROW][C]5[/C][C]18.6[/C][C]19.7788888888889[/C][C]-1.17888888888888[/C][/ROW]
[ROW][C]6[/C][C]18.8[/C][C]19.7988888888889[/C][C]-0.99888888888888[/C][/ROW]
[ROW][C]7[/C][C]23.7[/C][C]23.8388888888889[/C][C]-0.138888888888885[/C][/ROW]
[ROW][C]8[/C][C]24.8[/C][C]24.6588888888889[/C][C]0.141111111111125[/C][/ROW]
[ROW][C]9[/C][C]25[/C][C]24.5388888888889[/C][C]0.461111111111118[/C][/ROW]
[ROW][C]10[/C][C]23.6[/C][C]22.9788888888889[/C][C]0.621111111111117[/C][/ROW]
[ROW][C]11[/C][C]22.3[/C][C]21.7788888888889[/C][C]0.521111111111116[/C][/ROW]
[ROW][C]12[/C][C]21.8[/C][C]21.2588888888889[/C][C]0.541111111111117[/C][/ROW]
[ROW][C]13[/C][C]20.8[/C][C]21.1222222222222[/C][C]-0.32222222222219[/C][/ROW]
[ROW][C]14[/C][C]19.7[/C][C]20.6422222222222[/C][C]-0.94222222222222[/C][/ROW]
[ROW][C]15[/C][C]18.3[/C][C]19.9822222222222[/C][C]-1.68222222222222[/C][/ROW]
[ROW][C]16[/C][C]17.4[/C][C]20.0822222222222[/C][C]-2.68222222222222[/C][/ROW]
[ROW][C]17[/C][C]17[/C][C]19.3422222222222[/C][C]-2.34222222222222[/C][/ROW]
[ROW][C]18[/C][C]18.1[/C][C]19.3622222222222[/C][C]-1.26222222222222[/C][/ROW]
[ROW][C]19[/C][C]23.9[/C][C]23.4022222222222[/C][C]0.49777777777778[/C][/ROW]
[ROW][C]20[/C][C]25.6[/C][C]24.2222222222222[/C][C]1.37777777777778[/C][/ROW]
[ROW][C]21[/C][C]25.3[/C][C]24.1022222222222[/C][C]1.19777777777778[/C][/ROW]
[ROW][C]22[/C][C]23.6[/C][C]22.5422222222222[/C][C]1.05777777777778[/C][/ROW]
[ROW][C]23[/C][C]21.9[/C][C]21.3422222222222[/C][C]0.557777777777779[/C][/ROW]
[ROW][C]24[/C][C]21.4[/C][C]20.8222222222222[/C][C]0.577777777777778[/C][/ROW]
[ROW][C]25[/C][C]20.6[/C][C]20.6855555555555[/C][C]-0.0855555555555277[/C][/ROW]
[ROW][C]26[/C][C]20.5[/C][C]20.2055555555556[/C][C]0.294444444444442[/C][/ROW]
[ROW][C]27[/C][C]20.2[/C][C]19.5455555555556[/C][C]0.65444444444444[/C][/ROW]
[ROW][C]28[/C][C]20.6[/C][C]19.6455555555556[/C][C]0.954444444444443[/C][/ROW]
[ROW][C]29[/C][C]19.7[/C][C]18.9055555555556[/C][C]0.79444444444444[/C][/ROW]
[ROW][C]30[/C][C]19.3[/C][C]18.9255555555556[/C][C]0.374444444444441[/C][/ROW]
[ROW][C]31[/C][C]22.8[/C][C]22.9655555555556[/C][C]-0.165555555555557[/C][/ROW]
[ROW][C]32[/C][C]23.5[/C][C]23.7855555555556[/C][C]-0.285555555555561[/C][/ROW]
[ROW][C]33[/C][C]23.8[/C][C]23.6655555555556[/C][C]0.134444444444442[/C][/ROW]
[ROW][C]34[/C][C]22.6[/C][C]22.1055555555556[/C][C]0.494444444444442[/C][/ROW]
[ROW][C]35[/C][C]22[/C][C]20.9055555555556[/C][C]1.09444444444444[/C][/ROW]
[ROW][C]36[/C][C]21.7[/C][C]20.3855555555556[/C][C]1.31444444444444[/C][/ROW]
[ROW][C]37[/C][C]20.7[/C][C]19.5850000000000[/C][C]1.11500000000003[/C][/ROW]
[ROW][C]38[/C][C]20.2[/C][C]19.105[/C][C]1.095[/C][/ROW]
[ROW][C]39[/C][C]19.1[/C][C]18.445[/C][C]0.655000000000002[/C][/ROW]
[ROW][C]40[/C][C]19.5[/C][C]18.545[/C][C]0.955000000000001[/C][/ROW]
[ROW][C]41[/C][C]18.7[/C][C]17.805[/C][C]0.895[/C][/ROW]
[ROW][C]42[/C][C]18.6[/C][C]17.825[/C][C]0.775[/C][/ROW]
[ROW][C]43[/C][C]22.2[/C][C]21.865[/C][C]0.335000000000001[/C][/ROW]
[ROW][C]44[/C][C]23.2[/C][C]22.685[/C][C]0.514999999999998[/C][/ROW]
[ROW][C]45[/C][C]23.5[/C][C]22.565[/C][C]0.935[/C][/ROW]
[ROW][C]46[/C][C]21.3[/C][C]21.005[/C][C]0.295[/C][/ROW]
[ROW][C]47[/C][C]20[/C][C]19.805[/C][C]0.195000000000001[/C][/ROW]
[ROW][C]48[/C][C]18.7[/C][C]19.285[/C][C]-0.585[/C][/ROW]
[ROW][C]49[/C][C]18.9[/C][C]19.1483333333333[/C][C]-0.248333333333309[/C][/ROW]
[ROW][C]50[/C][C]18.3[/C][C]18.6683333333333[/C][C]-0.368333333333336[/C][/ROW]
[ROW][C]51[/C][C]18.4[/C][C]18.0083333333333[/C][C]0.391666666666661[/C][/ROW]
[ROW][C]52[/C][C]19.9[/C][C]18.1083333333333[/C][C]1.79166666666666[/C][/ROW]
[ROW][C]53[/C][C]19.2[/C][C]17.3683333333333[/C][C]1.83166666666666[/C][/ROW]
[ROW][C]54[/C][C]18.5[/C][C]17.3883333333333[/C][C]1.11166666666666[/C][/ROW]
[ROW][C]55[/C][C]20.9[/C][C]21.4283333333333[/C][C]-0.528333333333338[/C][/ROW]
[ROW][C]56[/C][C]20.5[/C][C]22.2483333333333[/C][C]-1.74833333333334[/C][/ROW]
[ROW][C]57[/C][C]19.4[/C][C]22.1283333333333[/C][C]-2.72833333333334[/C][/ROW]
[ROW][C]58[/C][C]18.1[/C][C]20.5683333333333[/C][C]-2.46833333333334[/C][/ROW]
[ROW][C]59[/C][C]17[/C][C]19.3683333333333[/C][C]-2.36833333333334[/C][/ROW]
[ROW][C]60[/C][C]17[/C][C]18.8483333333333[/C][C]-1.84833333333334[/C][/ROW]
[/TABLE]
Source: https://freestatistics.org/blog/index.php?pk=25230&T=4

Globally Unique Identifier (entire table): ba.freestatistics.org/blog/index.php?pk=25230&T=4

As an alternative you can also use a QR Code:  

The GUIDs for individual cells are displayed in the table below:

Multiple Linear Regression - Actuals, Interpolation, and Residuals
Time or IndexActualsInterpolationForecastResidualsPrediction Error
121.121.558888888889-0.458888888889002
22121.0788888888889-0.0788888888888846
320.420.4188888888889-0.0188888888888837
419.520.5188888888889-1.01888888888888
518.619.7788888888889-1.17888888888888
618.819.7988888888889-0.99888888888888
723.723.8388888888889-0.138888888888885
824.824.65888888888890.141111111111125
92524.53888888888890.461111111111118
1023.622.97888888888890.621111111111117
1122.321.77888888888890.521111111111116
1221.821.25888888888890.541111111111117
1320.821.1222222222222-0.32222222222219
1419.720.6422222222222-0.94222222222222
1518.319.9822222222222-1.68222222222222
1617.420.0822222222222-2.68222222222222
171719.3422222222222-2.34222222222222
1818.119.3622222222222-1.26222222222222
1923.923.40222222222220.49777777777778
2025.624.22222222222221.37777777777778
2125.324.10222222222221.19777777777778
2223.622.54222222222221.05777777777778
2321.921.34222222222220.557777777777779
2421.420.82222222222220.577777777777778
2520.620.6855555555555-0.0855555555555277
2620.520.20555555555560.294444444444442
2720.219.54555555555560.65444444444444
2820.619.64555555555560.954444444444443
2919.718.90555555555560.79444444444444
3019.318.92555555555560.374444444444441
3122.822.9655555555556-0.165555555555557
3223.523.7855555555556-0.285555555555561
3323.823.66555555555560.134444444444442
3422.622.10555555555560.494444444444442
352220.90555555555561.09444444444444
3621.720.38555555555561.31444444444444
3720.719.58500000000001.11500000000003
3820.219.1051.095
3919.118.4450.655000000000002
4019.518.5450.955000000000001
4118.717.8050.895
4218.617.8250.775
4322.221.8650.335000000000001
4423.222.6850.514999999999998
4523.522.5650.935
4621.321.0050.295
472019.8050.195000000000001
4818.719.285-0.585
4918.919.1483333333333-0.248333333333309
5018.318.6683333333333-0.368333333333336
5118.418.00833333333330.391666666666661
5219.918.10833333333331.79166666666666
5319.217.36833333333331.83166666666666
5418.517.38833333333331.11166666666666
5520.921.4283333333333-0.528333333333338
5620.522.2483333333333-1.74833333333334
5719.422.1283333333333-2.72833333333334
5818.120.5683333333333-2.46833333333334
591719.3683333333333-2.36833333333334
601718.8483333333333-1.84833333333334


Goldfeld-Quandt test for Heteroskedasticity
p-valuesAlternative Hypothesis
breakpoint indexgreater2-sidedless
170.2150618823144590.4301237646289180.784938117685541
180.2172860527521970.4345721055043930.782713947247803
190.3017520197254940.6035040394509880.698247980274506
200.4346233897939400.8692467795878790.56537661020606
210.3926629198059900.7853258396119810.60733708019401
220.308363327372320.616726654744640.69163667262768
230.2176450637559170.4352901275118340.782354936244083
240.1468237452216280.2936474904432550.853176254778372
250.1119612806469390.2239225612938770.888038719353061
260.0964846747426110.1929693494852220.903515325257389
270.1173839576419680.2347679152839350.882616042358032
280.298366200262920.596732400525840.70163379973708
290.4039479117532130.8078958235064270.596052088246787
300.4131136637424820.8262273274849630.586886336257518
310.4332611861434290.8665223722868580.566738813856571
320.4972555409898180.9945110819796350.502744459010182
330.4745263681691310.9490527363382620.525473631830869
340.4058647888525510.8117295777051020.594135211147449
350.3097137730594330.6194275461188650.690286226940567
360.2236686045989410.4473372091978810.77633139540106
370.1508748009427570.3017496018855140.849125199057243
380.0956043783509940.1912087567019880.904395621649006
390.06435239196142310.1287047839228460.935647608038577
400.0864953498827210.1729906997654420.913504650117279
410.192532030133020.385064060266040.80746796986698
420.4227803057418110.8455606114836220.577219694258189
430.5280981385055160.9438037229889680.471901861494484

\begin{tabular}{lllllllll}
\hline
Goldfeld-Quandt test for Heteroskedasticity \tabularnewline
p-values & Alternative Hypothesis \tabularnewline
breakpoint index & greater & 2-sided & less \tabularnewline
17 & 0.215061882314459 & 0.430123764628918 & 0.784938117685541 \tabularnewline
18 & 0.217286052752197 & 0.434572105504393 & 0.782713947247803 \tabularnewline
19 & 0.301752019725494 & 0.603504039450988 & 0.698247980274506 \tabularnewline
20 & 0.434623389793940 & 0.869246779587879 & 0.56537661020606 \tabularnewline
21 & 0.392662919805990 & 0.785325839611981 & 0.60733708019401 \tabularnewline
22 & 0.30836332737232 & 0.61672665474464 & 0.69163667262768 \tabularnewline
23 & 0.217645063755917 & 0.435290127511834 & 0.782354936244083 \tabularnewline
24 & 0.146823745221628 & 0.293647490443255 & 0.853176254778372 \tabularnewline
25 & 0.111961280646939 & 0.223922561293877 & 0.888038719353061 \tabularnewline
26 & 0.096484674742611 & 0.192969349485222 & 0.903515325257389 \tabularnewline
27 & 0.117383957641968 & 0.234767915283935 & 0.882616042358032 \tabularnewline
28 & 0.29836620026292 & 0.59673240052584 & 0.70163379973708 \tabularnewline
29 & 0.403947911753213 & 0.807895823506427 & 0.596052088246787 \tabularnewline
30 & 0.413113663742482 & 0.826227327484963 & 0.586886336257518 \tabularnewline
31 & 0.433261186143429 & 0.866522372286858 & 0.566738813856571 \tabularnewline
32 & 0.497255540989818 & 0.994511081979635 & 0.502744459010182 \tabularnewline
33 & 0.474526368169131 & 0.949052736338262 & 0.525473631830869 \tabularnewline
34 & 0.405864788852551 & 0.811729577705102 & 0.594135211147449 \tabularnewline
35 & 0.309713773059433 & 0.619427546118865 & 0.690286226940567 \tabularnewline
36 & 0.223668604598941 & 0.447337209197881 & 0.77633139540106 \tabularnewline
37 & 0.150874800942757 & 0.301749601885514 & 0.849125199057243 \tabularnewline
38 & 0.095604378350994 & 0.191208756701988 & 0.904395621649006 \tabularnewline
39 & 0.0643523919614231 & 0.128704783922846 & 0.935647608038577 \tabularnewline
40 & 0.086495349882721 & 0.172990699765442 & 0.913504650117279 \tabularnewline
41 & 0.19253203013302 & 0.38506406026604 & 0.80746796986698 \tabularnewline
42 & 0.422780305741811 & 0.845560611483622 & 0.577219694258189 \tabularnewline
43 & 0.528098138505516 & 0.943803722988968 & 0.471901861494484 \tabularnewline
\hline
\end{tabular}
%Source: https://freestatistics.org/blog/index.php?pk=25230&T=5

[TABLE]
[ROW][C]Goldfeld-Quandt test for Heteroskedasticity[/C][/ROW]
[ROW][C]p-values[/C][C]Alternative Hypothesis[/C][/ROW]
[ROW][C]breakpoint index[/C][C]greater[/C][C]2-sided[/C][C]less[/C][/ROW]
[ROW][C]17[/C][C]0.215061882314459[/C][C]0.430123764628918[/C][C]0.784938117685541[/C][/ROW]
[ROW][C]18[/C][C]0.217286052752197[/C][C]0.434572105504393[/C][C]0.782713947247803[/C][/ROW]
[ROW][C]19[/C][C]0.301752019725494[/C][C]0.603504039450988[/C][C]0.698247980274506[/C][/ROW]
[ROW][C]20[/C][C]0.434623389793940[/C][C]0.869246779587879[/C][C]0.56537661020606[/C][/ROW]
[ROW][C]21[/C][C]0.392662919805990[/C][C]0.785325839611981[/C][C]0.60733708019401[/C][/ROW]
[ROW][C]22[/C][C]0.30836332737232[/C][C]0.61672665474464[/C][C]0.69163667262768[/C][/ROW]
[ROW][C]23[/C][C]0.217645063755917[/C][C]0.435290127511834[/C][C]0.782354936244083[/C][/ROW]
[ROW][C]24[/C][C]0.146823745221628[/C][C]0.293647490443255[/C][C]0.853176254778372[/C][/ROW]
[ROW][C]25[/C][C]0.111961280646939[/C][C]0.223922561293877[/C][C]0.888038719353061[/C][/ROW]
[ROW][C]26[/C][C]0.096484674742611[/C][C]0.192969349485222[/C][C]0.903515325257389[/C][/ROW]
[ROW][C]27[/C][C]0.117383957641968[/C][C]0.234767915283935[/C][C]0.882616042358032[/C][/ROW]
[ROW][C]28[/C][C]0.29836620026292[/C][C]0.59673240052584[/C][C]0.70163379973708[/C][/ROW]
[ROW][C]29[/C][C]0.403947911753213[/C][C]0.807895823506427[/C][C]0.596052088246787[/C][/ROW]
[ROW][C]30[/C][C]0.413113663742482[/C][C]0.826227327484963[/C][C]0.586886336257518[/C][/ROW]
[ROW][C]31[/C][C]0.433261186143429[/C][C]0.866522372286858[/C][C]0.566738813856571[/C][/ROW]
[ROW][C]32[/C][C]0.497255540989818[/C][C]0.994511081979635[/C][C]0.502744459010182[/C][/ROW]
[ROW][C]33[/C][C]0.474526368169131[/C][C]0.949052736338262[/C][C]0.525473631830869[/C][/ROW]
[ROW][C]34[/C][C]0.405864788852551[/C][C]0.811729577705102[/C][C]0.594135211147449[/C][/ROW]
[ROW][C]35[/C][C]0.309713773059433[/C][C]0.619427546118865[/C][C]0.690286226940567[/C][/ROW]
[ROW][C]36[/C][C]0.223668604598941[/C][C]0.447337209197881[/C][C]0.77633139540106[/C][/ROW]
[ROW][C]37[/C][C]0.150874800942757[/C][C]0.301749601885514[/C][C]0.849125199057243[/C][/ROW]
[ROW][C]38[/C][C]0.095604378350994[/C][C]0.191208756701988[/C][C]0.904395621649006[/C][/ROW]
[ROW][C]39[/C][C]0.0643523919614231[/C][C]0.128704783922846[/C][C]0.935647608038577[/C][/ROW]
[ROW][C]40[/C][C]0.086495349882721[/C][C]0.172990699765442[/C][C]0.913504650117279[/C][/ROW]
[ROW][C]41[/C][C]0.19253203013302[/C][C]0.38506406026604[/C][C]0.80746796986698[/C][/ROW]
[ROW][C]42[/C][C]0.422780305741811[/C][C]0.845560611483622[/C][C]0.577219694258189[/C][/ROW]
[ROW][C]43[/C][C]0.528098138505516[/C][C]0.943803722988968[/C][C]0.471901861494484[/C][/ROW]
[/TABLE]
Source: https://freestatistics.org/blog/index.php?pk=25230&T=5

Globally Unique Identifier (entire table): ba.freestatistics.org/blog/index.php?pk=25230&T=5

As an alternative you can also use a QR Code:  

The GUIDs for individual cells are displayed in the table below:

Goldfeld-Quandt test for Heteroskedasticity
p-valuesAlternative Hypothesis
breakpoint indexgreater2-sidedless
170.2150618823144590.4301237646289180.784938117685541
180.2172860527521970.4345721055043930.782713947247803
190.3017520197254940.6035040394509880.698247980274506
200.4346233897939400.8692467795878790.56537661020606
210.3926629198059900.7853258396119810.60733708019401
220.308363327372320.616726654744640.69163667262768
230.2176450637559170.4352901275118340.782354936244083
240.1468237452216280.2936474904432550.853176254778372
250.1119612806469390.2239225612938770.888038719353061
260.0964846747426110.1929693494852220.903515325257389
270.1173839576419680.2347679152839350.882616042358032
280.298366200262920.596732400525840.70163379973708
290.4039479117532130.8078958235064270.596052088246787
300.4131136637424820.8262273274849630.586886336257518
310.4332611861434290.8665223722868580.566738813856571
320.4972555409898180.9945110819796350.502744459010182
330.4745263681691310.9490527363382620.525473631830869
340.4058647888525510.8117295777051020.594135211147449
350.3097137730594330.6194275461188650.690286226940567
360.2236686045989410.4473372091978810.77633139540106
370.1508748009427570.3017496018855140.849125199057243
380.0956043783509940.1912087567019880.904395621649006
390.06435239196142310.1287047839228460.935647608038577
400.0864953498827210.1729906997654420.913504650117279
410.192532030133020.385064060266040.80746796986698
420.4227803057418110.8455606114836220.577219694258189
430.5280981385055160.9438037229889680.471901861494484


Meta Analysis of Goldfeld-Quandt test for Heteroskedasticity
Description# significant tests% significant testsOK/NOK
1% type I error level00OK
5% type I error level00OK
10% type I error level00OK

\begin{tabular}{lllllllll}
\hline
Meta Analysis of Goldfeld-Quandt test for Heteroskedasticity \tabularnewline
Description & # significant tests & % significant tests & OK/NOK \tabularnewline
1% type I error level & 0 & 0 & OK \tabularnewline
5% type I error level & 0 & 0 & OK \tabularnewline
10% type I error level & 0 & 0 & OK \tabularnewline
\hline
\end{tabular}
%Source: https://freestatistics.org/blog/index.php?pk=25230&T=6

[TABLE]
[ROW][C]Meta Analysis of Goldfeld-Quandt test for Heteroskedasticity[/C][/ROW]
[ROW][C]Description[/C][C]# significant tests[/C][C]% significant tests[/C][C]OK/NOK[/C][/ROW]
[ROW][C]1% type I error level[/C][C]0[/C][C]0[/C][C]OK[/C][/ROW]
[ROW][C]5% type I error level[/C][C]0[/C][C]0[/C][C]OK[/C][/ROW]
[ROW][C]10% type I error level[/C][C]0[/C][C]0[/C][C]OK[/C][/ROW]
[/TABLE]
Source: https://freestatistics.org/blog/index.php?pk=25230&T=6

Globally Unique Identifier (entire table): ba.freestatistics.org/blog/index.php?pk=25230&T=6

As an alternative you can also use a QR Code:  

The GUIDs for individual cells are displayed in the table below:

Meta Analysis of Goldfeld-Quandt test for Heteroskedasticity
Description# significant tests% significant testsOK/NOK
1% type I error level00OK
5% type I error level00OK
10% type I error level00OK


Parameters (Session):
par1 = 1 ; par2 = Include Monthly Dummies ; par3 = Linear Trend ;
Parameters (R input):
par1 = 1 ; par2 = Include Monthly Dummies ; par3 = Linear Trend ;
R code (references can be found in the software module):
library(lattice)
library(lmtest)
n25 <- 25 #minimum number of obs. for Goldfeld-Quandt test
par1 <- as.numeric(par1)
x <- t(y)
k <- length(x[1,])
n <- length(x[,1])
x1 <- cbind(x[,par1], x[,1:k!=par1])
mycolnames <- c(colnames(x)[par1], colnames(x)[1:k!=par1])
colnames(x1) <- mycolnames #colnames(x)[par1]
x <- x1
if (par3 == 'First Differences'){
x2 <- array(0, dim=c(n-1,k), dimnames=list(1:(n-1), paste('(1-B)',colnames(x),sep='')))
for (i in 1:n-1) {
for (j in 1:k) {
x2[i,j] <- x[i+1,j] - x[i,j]
}
}
x <- x2
}
if (par2 == 'Include Monthly Dummies'){
x2 <- array(0, dim=c(n,11), dimnames=list(1:n, paste('M', seq(1:11), sep ='')))
for (i in 1:11){
x2[seq(i,n,12),i] <- 1
}
x <- cbind(x, x2)
}
if (par2 == 'Include Quarterly Dummies'){
x2 <- array(0, dim=c(n,3), dimnames=list(1:n, paste('Q', seq(1:3), sep ='')))
for (i in 1:3){
x2[seq(i,n,4),i] <- 1
}
x <- cbind(x, x2)
}
k <- length(x[1,])
if (par3 == 'Linear Trend'){
x <- cbind(x, c(1:n))
colnames(x)[k+1] <- 't'
}
x
k <- length(x[1,])
df <- as.data.frame(x)
(mylm <- lm(df))
(mysum <- summary(mylm))
if (n > n25) {
kp3 <- k + 3
nmkm3 <- n - k - 3
gqarr <- array(NA, dim=c(nmkm3-kp3+1,3))
numgqtests <- 0
numsignificant1 <- 0
numsignificant5 <- 0
numsignificant10 <- 0
for (mypoint in kp3:nmkm3) {
j <- 0
numgqtests <- numgqtests + 1
for (myalt in c('greater', 'two.sided', 'less')) {
j <- j + 1
gqarr[mypoint-kp3+1,j] <- gqtest(mylm, point=mypoint, alternative=myalt)$p.value
}
if (gqarr[mypoint-kp3+1,2] < 0.01) numsignificant1 <- numsignificant1 + 1
if (gqarr[mypoint-kp3+1,2] < 0.05) numsignificant5 <- numsignificant5 + 1
if (gqarr[mypoint-kp3+1,2] < 0.10) numsignificant10 <- numsignificant10 + 1
}
gqarr
}
bitmap(file='test0.png')
plot(x[,1], type='l', main='Actuals and Interpolation', ylab='value of Actuals and Interpolation (dots)', xlab='time or index')
points(x[,1]-mysum$resid)
grid()
dev.off()
bitmap(file='test1.png')
plot(mysum$resid, type='b', pch=19, main='Residuals', ylab='value of Residuals', xlab='time or index')
grid()
dev.off()
bitmap(file='test2.png')
hist(mysum$resid, main='Residual Histogram', xlab='values of Residuals')
grid()
dev.off()
bitmap(file='test3.png')
densityplot(~mysum$resid,col='black',main='Residual Density Plot', xlab='values of Residuals')
dev.off()
bitmap(file='test4.png')
qqnorm(mysum$resid, main='Residual Normal Q-Q Plot')
qqline(mysum$resid)
grid()
dev.off()
(myerror <- as.ts(mysum$resid))
bitmap(file='test5.png')
dum <- cbind(lag(myerror,k=1),myerror)
dum
dum1 <- dum[2:length(myerror),]
dum1
z <- as.data.frame(dum1)
z
plot(z,main=paste('Residual Lag plot, lowess, and regression line'), ylab='values of Residuals', xlab='lagged values of Residuals')
lines(lowess(z))
abline(lm(z))
grid()
dev.off()
bitmap(file='test6.png')
acf(mysum$resid, lag.max=length(mysum$resid)/2, main='Residual Autocorrelation Function')
grid()
dev.off()
bitmap(file='test7.png')
pacf(mysum$resid, lag.max=length(mysum$resid)/2, main='Residual Partial Autocorrelation Function')
grid()
dev.off()
bitmap(file='test8.png')
opar <- par(mfrow = c(2,2), oma = c(0, 0, 1.1, 0))
plot(mylm, las = 1, sub='Residual Diagnostics')
par(opar)
dev.off()
if (n > n25) {
bitmap(file='test9.png')
plot(kp3:nmkm3,gqarr[,2], main='Goldfeld-Quandt test',ylab='2-sided p-value',xlab='breakpoint')
grid()
dev.off()
}
load(file='createtable')
a<-table.start()
a<-table.row.start(a)
a<-table.element(a, 'Multiple Linear Regression - Estimated Regression Equation', 1, TRUE)
a<-table.row.end(a)
myeq <- colnames(x)[1]
myeq <- paste(myeq, '[t] = ', sep='')
for (i in 1:k){
if (mysum$coefficients[i,1] > 0) myeq <- paste(myeq, '+', '')
myeq <- paste(myeq, mysum$coefficients[i,1], sep=' ')
if (rownames(mysum$coefficients)[i] != '(Intercept)') {
myeq <- paste(myeq, rownames(mysum$coefficients)[i], sep='')
if (rownames(mysum$coefficients)[i] != 't') myeq <- paste(myeq, '[t]', sep='')
}
}
myeq <- paste(myeq, ' + e[t]')
a<-table.row.start(a)
a<-table.element(a, myeq)
a<-table.row.end(a)
a<-table.end(a)
table.save(a,file='mytable1.tab')
a<-table.start()
a<-table.row.start(a)
a<-table.element(a,hyperlink('ols1.htm','Multiple Linear Regression - Ordinary Least Squares',''), 6, TRUE)
a<-table.row.end(a)
a<-table.row.start(a)
a<-table.element(a,'Variable',header=TRUE)
a<-table.element(a,'Parameter',header=TRUE)
a<-table.element(a,'S.D.',header=TRUE)
a<-table.element(a,'T-STAT
H0: parameter = 0',header=TRUE)
a<-table.element(a,'2-tail p-value',header=TRUE)
a<-table.element(a,'1-tail p-value',header=TRUE)
a<-table.row.end(a)
for (i in 1:k){
a<-table.row.start(a)
a<-table.element(a,rownames(mysum$coefficients)[i],header=TRUE)
a<-table.element(a,mysum$coefficients[i,1])
a<-table.element(a, round(mysum$coefficients[i,2],6))
a<-table.element(a, round(mysum$coefficients[i,3],4))
a<-table.element(a, round(mysum$coefficients[i,4],6))
a<-table.element(a, round(mysum$coefficients[i,4]/2,6))
a<-table.row.end(a)
}
a<-table.end(a)
table.save(a,file='mytable2.tab')
a<-table.start()
a<-table.row.start(a)
a<-table.element(a, 'Multiple Linear Regression - Regression Statistics', 2, TRUE)
a<-table.row.end(a)
a<-table.row.start(a)
a<-table.element(a, 'Multiple R',1,TRUE)
a<-table.element(a, sqrt(mysum$r.squared))
a<-table.row.end(a)
a<-table.row.start(a)
a<-table.element(a, 'R-squared',1,TRUE)
a<-table.element(a, mysum$r.squared)
a<-table.row.end(a)
a<-table.row.start(a)
a<-table.element(a, 'Adjusted R-squared',1,TRUE)
a<-table.element(a, mysum$adj.r.squared)
a<-table.row.end(a)
a<-table.row.start(a)
a<-table.element(a, 'F-TEST (value)',1,TRUE)
a<-table.element(a, mysum$fstatistic[1])
a<-table.row.end(a)
a<-table.row.start(a)
a<-table.element(a, 'F-TEST (DF numerator)',1,TRUE)
a<-table.element(a, mysum$fstatistic[2])
a<-table.row.end(a)
a<-table.row.start(a)
a<-table.element(a, 'F-TEST (DF denominator)',1,TRUE)
a<-table.element(a, mysum$fstatistic[3])
a<-table.row.end(a)
a<-table.row.start(a)
a<-table.element(a, 'p-value',1,TRUE)
a<-table.element(a, 1-pf(mysum$fstatistic[1],mysum$fstatistic[2],mysum$fstatistic[3]))
a<-table.row.end(a)
a<-table.row.start(a)
a<-table.element(a, 'Multiple Linear Regression - Residual Statistics', 2, TRUE)
a<-table.row.end(a)
a<-table.row.start(a)
a<-table.element(a, 'Residual Standard Deviation',1,TRUE)
a<-table.element(a, mysum$sigma)
a<-table.row.end(a)
a<-table.row.start(a)
a<-table.element(a, 'Sum Squared Residuals',1,TRUE)
a<-table.element(a, sum(myerror*myerror))
a<-table.row.end(a)
a<-table.end(a)
table.save(a,file='mytable3.tab')
a<-table.start()
a<-table.row.start(a)
a<-table.element(a, 'Multiple Linear Regression - Actuals, Interpolation, and Residuals', 4, TRUE)
a<-table.row.end(a)
a<-table.row.start(a)
a<-table.element(a, 'Time or Index', 1, TRUE)
a<-table.element(a, 'Actuals', 1, TRUE)
a<-table.element(a, 'Interpolation
Forecast', 1, TRUE)
a<-table.element(a, 'Residuals
Prediction Error', 1, TRUE)
a<-table.row.end(a)
for (i in 1:n) {
a<-table.row.start(a)
a<-table.element(a,i, 1, TRUE)
a<-table.element(a,x[i])
a<-table.element(a,x[i]-mysum$resid[i])
a<-table.element(a,mysum$resid[i])
a<-table.row.end(a)
}
a<-table.end(a)
table.save(a,file='mytable4.tab')
if (n > n25) {
a<-table.start()
a<-table.row.start(a)
a<-table.element(a,'Goldfeld-Quandt test for Heteroskedasticity',4,TRUE)
a<-table.row.end(a)
a<-table.row.start(a)
a<-table.element(a,'p-values',header=TRUE)
a<-table.element(a,'Alternative Hypothesis',3,header=TRUE)
a<-table.row.end(a)
a<-table.row.start(a)
a<-table.element(a,'breakpoint index',header=TRUE)
a<-table.element(a,'greater',header=TRUE)
a<-table.element(a,'2-sided',header=TRUE)
a<-table.element(a,'less',header=TRUE)
a<-table.row.end(a)
for (mypoint in kp3:nmkm3) {
a<-table.row.start(a)
a<-table.element(a,mypoint,header=TRUE)
a<-table.element(a,gqarr[mypoint-kp3+1,1])
a<-table.element(a,gqarr[mypoint-kp3+1,2])
a<-table.element(a,gqarr[mypoint-kp3+1,3])
a<-table.row.end(a)
}
a<-table.end(a)
table.save(a,file='mytable5.tab')
a<-table.start()
a<-table.row.start(a)
a<-table.element(a,'Meta Analysis of Goldfeld-Quandt test for Heteroskedasticity',4,TRUE)
a<-table.row.end(a)
a<-table.row.start(a)
a<-table.element(a,'Description',header=TRUE)
a<-table.element(a,'# significant tests',header=TRUE)
a<-table.element(a,'% significant tests',header=TRUE)
a<-table.element(a,'OK/NOK',header=TRUE)
a<-table.row.end(a)
a<-table.row.start(a)
a<-table.element(a,'1% type I error level',header=TRUE)
a<-table.element(a,numsignificant1)
a<-table.element(a,numsignificant1/numgqtests)
if (numsignificant1/numgqtests < 0.01) dum <- 'OK' else dum <- 'NOK'
a<-table.element(a,dum)
a<-table.row.end(a)
a<-table.row.start(a)
a<-table.element(a,'5% type I error level',header=TRUE)
a<-table.element(a,numsignificant5)
a<-table.element(a,numsignificant5/numgqtests)
if (numsignificant5/numgqtests < 0.05) dum <- 'OK' else dum <- 'NOK'
a<-table.element(a,dum)
a<-table.row.end(a)
a<-table.row.start(a)
a<-table.element(a,'10% type I error level',header=TRUE)
a<-table.element(a,numsignificant10)
a<-table.element(a,numsignificant10/numgqtests)
if (numsignificant10/numgqtests < 0.1) dum <- 'OK' else dum <- 'NOK'
a<-table.element(a,dum)
a<-table.row.end(a)
a<-table.end(a)
table.save(a,file='mytable6.tab')
}