Free Statistics

of Irreproducible Research!

Author's title

Author*The author of this computation has been verified*
R Software Modulerwasp_bidensity.wasp
Title produced by softwareBivariate Kernel Density Estimation
Date of computationSat, 22 Nov 2008 12:48:56 -0700
Cite this page as followsStatistical Computations at FreeStatistics.org, Office for Research Development and Education, URL https://freestatistics.org/blog/index.php?v=date/2008/Nov/22/t1227383402hod6sfxovhhui6l.htm/, Retrieved Sun, 19 May 2024 12:14:05 +0000
Statistical Computations at FreeStatistics.org, Office for Research Development and Education, URL https://freestatistics.org/blog/index.php?pk=25210, Retrieved Sun, 19 May 2024 12:14:05 +0000
QR Codes:

Original text written by user:
IsPrivate?No (this computation is public)
User-defined keywords
Estimated Impact196
Family? (F = Feedback message, R = changed R code, M = changed R Module, P = changed Parameters, D = changed Data)
F     [Bivariate Kernel Density Estimation] [Various EDA Topic...] [2008-11-12 13:37:39] [8094ad203a218aaca2d1cea2c78c2d6e]
F    D    [Bivariate Kernel Density Estimation] [Blok 8 opdracht 3 q1] [2008-11-22 19:48:56] [1237f4df7e9be807e4c0a07b90c45721] [Current]
Feedback Forum
2008-11-23 12:50:09 [c97d2ae59c98cf77a04815c1edffab5a] [reply
Ik heb per ongeluk de link van Nathalie Daneels gebruikt bij deze oefening, waarschijnlijk omdat wij deze oefening samen hebben voorbereid. Aangezien nu niemand mijn opdrachten kan assessen, zal ik mijn verbeterde oplossing geven:
Theorie: bivariate kernel density
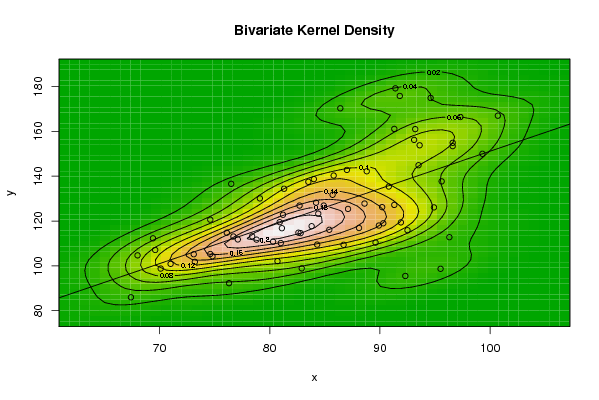
Deze wordt gevormd door: de puntenwolk van de scatterplot, rechte lijn(benadert puntenwolk zo dicht mogelijk) en hoogtelijnen (die hebben niet rechtstreeks iets te maken met de 3e dimensie, maar met de dichtheid/concentratie van de scatterplot). De hoogtelijnen geven de waarschijnlijkheid, d.m.v. de dichtheid/concentratie , aan dat een bepaald verband tussen variabelen (= de punten) zich daar bevindt, waar de hoogtelijnen de hoogste waarde aannemen (het rode-witte vlekje). M.a.w. Als er in de puntenwolk ergens heel veel punten zich samen bevinden (in ‘groep’) is er een hoge concentratie van punten daar, hier ga je dan ook de hoogste hoogtelijn vinden.
Verschillende groepen met hoge hoogtelijnen geven clustering weer. We stellen ons hierbij de vraag of er een wetmatigheid bestaan tussen 2 variabelen dat nier voor elke periode geldt? Dit kan bijvoorbeeld doordat het regime veranderd is, waardoor er een verband tussen variabelen is ontstaan dat er voordien nog niet was, of dit kan een maandelijks verband zijn dat telkens terugkeert. Dit zal dan verder onderzocht moeten worden. De richting naar waar de hoogtelijnen wijzen geeft de correlatie weer: rechts boven(positief verband), rechts beneden (negatief verband) en horizontaal (geen verband) . Vb (in geval van periodieke terugkering van een verband): is er maar 1 rode vlek, dit wil zeggen dat de maanden ongeveer gelijkaardig zijn(geen clustering). Zijn er 2 rode vlekken, dit wil zeggen dat de variabelen zich anders voordoen in bepaalde maanden (clustering). Bijvoorbeeld in het geval van clustering bij huwelijken: het zou periodiek kunnen terugkeren; in de zomer meer huwelijken dan in de winter, of het zou een plotse verandering kunnen zijn; na de oorlog.
Conclusie:
Allereerst moeten we vermelden dat de variabele ‘x’de elektrische en elektronische apparaten weergeeft en de variabele ‘y’ de medische apparatuur. De correlatie tussen de 2 variabelen is positief en bedraagt 0.63. De ‘Bivariate Kernel density’ geeft de dichtheid aan tussen 2 variabelen, die wordt aangeduid door hoogtelijnen. De hoogste concentratie bevindt zich min of meer in het midden van de figuur (witte kleur) waardoor het verband tussen de variabelen zich waarschijnlijk daar zal bevinden. Deze opvallende dichtheid komt overeen met de coördinaten 82 (voor variabele x) en 115 (voor variabele y). De hoogtelijnen evolueren van links-onder naar rechts-boven. Dit bevestigt onze conclusie, gevormd m.b.v. de tabel, van een positief verband. Doordat we geen verschillende concentraties/groepen van ‘rode vlekjes’ kunnen waarnemen, kunnen we opmaken dat we niet te maken hebben met clustering/seizoenaliteit , en de periodes gelijkaardig zijn.

Post a new message
Dataseries X:
92.3
95.5
92.5
89.6
84.3
76.3
80.7
96.3
81.0
82.9
90.3
74.8
70.1
86.7
86.4
89.9
88.1
78.8
81.1
85.4
82.6
80.3
81.2
68.0
67.4
91.3
94.9
82.8
88.6
73.1
76.7
93.2
84.9
83.8
93.5
91.9
69.6
87.0
90.2
82.7
91.4
74.6
76.1
87.1
78.4
81.3
99.3
71.0
73.2
95.6
84.0
90.8
93.6
80.9
84.4
97.3
83.5
88.8
100.7
69.4
74.6
96.6
96.6
93.1
91.8
85.7
79.1
91.3
84.2
85.8
94.6
77.1
76.5
Dataseries Y:
95.5
98.7
115.9
110.4
109.5
92.3
102.1
112.8
110.2
98.9
119.0
104.3
98.8
109.4
170.3
118.0
116.9
111.7
116.8
116.1
114.8
110.8
122.8
104.7
86.0
127.2
126.1
114.6
127.8
105.2
113.1
161.0
126.9
117.7
144.9
119.4
107.1
142.8
126.2
126.9
179.2
105.3
114.8
125.4
113.2
134.4
150.0
100.9
101.8
137.7
138.7
135.4
153.8
119.5
123.3
166.4
137.5
142.2
167.0
112.3
120.6
154.9
153.4
156.2
175.8
131.7
130.1
161.1
128.2
140.3
174.9
111.8
136.6


Summary of computational transaction
Raw Inputview raw input (R code)
Raw Outputview raw output of R engine
Computing time2 seconds
R Server'Sir Ronald Aylmer Fisher' @ 193.190.124.24

\begin{tabular}{lllllllll}
\hline
Summary of computational transaction \tabularnewline
Raw Input & view raw input (R code)  \tabularnewline
Raw Output & view raw output of R engine  \tabularnewline
Computing time & 2 seconds \tabularnewline
R Server & 'Sir Ronald Aylmer Fisher' @ 193.190.124.24 \tabularnewline
\hline
\end{tabular}
%Source: https://freestatistics.org/blog/index.php?pk=25210&T=0

[TABLE]
[ROW][C]Summary of computational transaction[/C][/ROW]
[ROW][C]Raw Input[/C][C]view raw input (R code) [/C][/ROW]
[ROW][C]Raw Output[/C][C]view raw output of R engine [/C][/ROW]
[ROW][C]Computing time[/C][C]2 seconds[/C][/ROW]
[ROW][C]R Server[/C][C]'Sir Ronald Aylmer Fisher' @ 193.190.124.24[/C][/ROW]
[/TABLE]
Source: https://freestatistics.org/blog/index.php?pk=25210&T=0

Globally Unique Identifier (entire table): ba.freestatistics.org/blog/index.php?pk=25210&T=0

As an alternative you can also use a QR Code:  

The GUIDs for individual cells are displayed in the table below:

Summary of computational transaction
Raw Inputview raw input (R code)
Raw Outputview raw output of R engine
Computing time2 seconds
R Server'Sir Ronald Aylmer Fisher' @ 193.190.124.24


Bandwidth
x axis4.0416833269622
y axis7.91421377048872
Correlation
correlation used in KDE0.631982605451482
correlation(x,y)0.631982605451482

\begin{tabular}{lllllllll}
\hline
Bandwidth \tabularnewline
x axis & 4.0416833269622 \tabularnewline
y axis & 7.91421377048872 \tabularnewline
Correlation \tabularnewline
correlation used in KDE & 0.631982605451482 \tabularnewline
correlation(x,y) & 0.631982605451482 \tabularnewline
\hline
\end{tabular}
%Source: https://freestatistics.org/blog/index.php?pk=25210&T=1

[TABLE]
[ROW][C]Bandwidth[/C][/ROW]
[ROW][C]x axis[/C][C]4.0416833269622[/C][/ROW]
[ROW][C]y axis[/C][C]7.91421377048872[/C][/ROW]
[ROW][C]Correlation[/C][/ROW]
[ROW][C]correlation used in KDE[/C][C]0.631982605451482[/C][/ROW]
[ROW][C]correlation(x,y)[/C][C]0.631982605451482[/C][/ROW]
[/TABLE]
Source: https://freestatistics.org/blog/index.php?pk=25210&T=1

Globally Unique Identifier (entire table): ba.freestatistics.org/blog/index.php?pk=25210&T=1

As an alternative you can also use a QR Code:  

The GUIDs for individual cells are displayed in the table below:

Bandwidth
x axis4.0416833269622
y axis7.91421377048872
Correlation
correlation used in KDE0.631982605451482
correlation(x,y)0.631982605451482


Parameters (Session):
par1 = 50 ; par2 = 50 ; par3 = 0 ; par4 = 0 ; par5 = 0 ; par6 = Y ; par7 = Y ;
Parameters (R input):
par1 = 50 ; par2 = 50 ; par3 = 0 ; par4 = 0 ; par5 = 0 ; par6 = Y ; par7 = Y ;
R code (references can be found in the software module):
par1 <- as(par1,'numeric')
par2 <- as(par2,'numeric')
par3 <- as(par3,'numeric')
par4 <- as(par4,'numeric')
par5 <- as(par5,'numeric')
library('GenKern')
if (par3==0) par3 <- dpik(x)
if (par4==0) par4 <- dpik(y)
if (par5==0) par5 <- cor(x,y)
if (par1 > 500) par1 <- 500
if (par2 > 500) par2 <- 500
bitmap(file='bidensity.png')
op <- KernSur(x,y, xgridsize=par1, ygridsize=par2, correlation=par5, xbandwidth=par3, ybandwidth=par4)
image(op$xords, op$yords, op$zden, col=terrain.colors(100), axes=TRUE,main=main,xlab=xlab,ylab=ylab)
if (par6=='Y') contour(op$xords, op$yords, op$zden, add=TRUE)
if (par7=='Y') points(x,y)
(r<-lm(y ~ x))
abline(r)
box()
dev.off()
load(file='createtable')
a<-table.start()
a<-table.row.start(a)
a<-table.element(a,'Bandwidth',2,TRUE)
a<-table.row.end(a)
a<-table.row.start(a)
a<-table.element(a,'x axis',header=TRUE)
a<-table.element(a,par3)
a<-table.row.end(a)
a<-table.row.start(a)
a<-table.element(a,'y axis',header=TRUE)
a<-table.element(a,par4)
a<-table.row.end(a)
a<-table.row.start(a)
a<-table.element(a,'Correlation',2,TRUE)
a<-table.row.end(a)
a<-table.row.start(a)
a<-table.element(a,'correlation used in KDE',header=TRUE)
a<-table.element(a,par5)
a<-table.row.end(a)
a<-table.row.start(a)
a<-table.element(a,'correlation(x,y)',header=TRUE)
a<-table.element(a,cor(x,y))
a<-table.row.end(a)
a<-table.end(a)
table.save(a,file='mytable.tab')