Free Statistics

of Irreproducible Research!

Author's title

Author*The author of this computation has been verified*
R Software Modulerwasp_multipleregression.wasp
Title produced by softwareMultiple Regression
Date of computationSat, 22 Nov 2008 11:09:11 -0700
Cite this page as followsStatistical Computations at FreeStatistics.org, Office for Research Development and Education, URL https://freestatistics.org/blog/index.php?v=date/2008/Nov/22/t122737744937sn5jlf7r7x708.htm/, Retrieved Sun, 19 May 2024 12:35:13 +0000
Statistical Computations at FreeStatistics.org, Office for Research Development and Education, URL https://freestatistics.org/blog/index.php?pk=25208, Retrieved Sun, 19 May 2024 12:35:13 +0000
QR Codes:

Original text written by user:
IsPrivate?No (this computation is public)
User-defined keywords
Estimated Impact209
Family? (F = Feedback message, R = changed R code, M = changed R Module, P = changed Parameters, D = changed Data)
F     [Multiple Regression] [] [2007-11-19 19:55:31] [b731da8b544846036771bbf9bf2f34ce]
- R PD  [Multiple Regression] [Case Q3] [2008-11-22 17:58:30] [de72ca3f4fcfd0997c84e1ac92aea119]
F    D      [Multiple Regression] [Case Q3] [2008-11-22 18:09:11] [56fd94b954e08a6655cb7790b21ee404] [Current]
Feedback Forum
2008-12-01 15:51:32 [Jonas Janssens] [reply
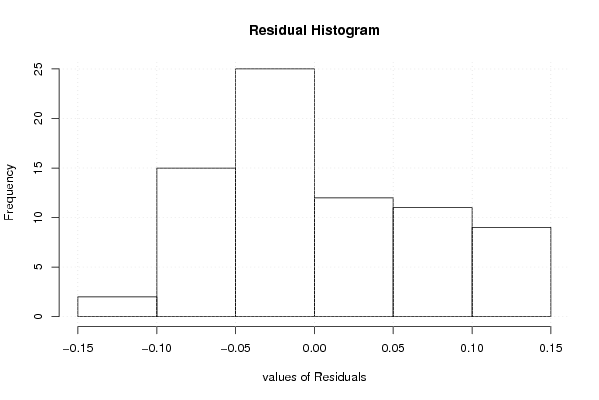
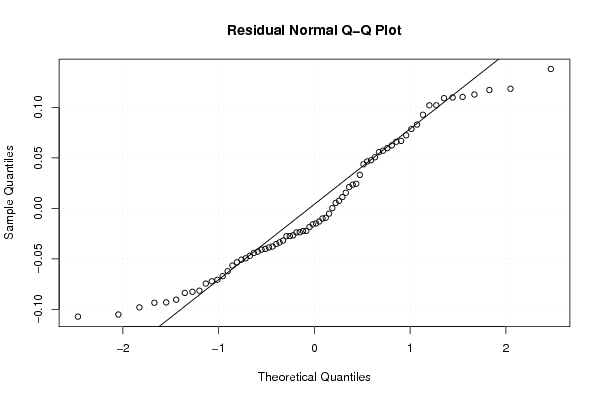
-Grafiek 'Residual Histogram': Geen normaalverdeling, omdat de top meer naar links staat en er is een rechtse scheefheid.
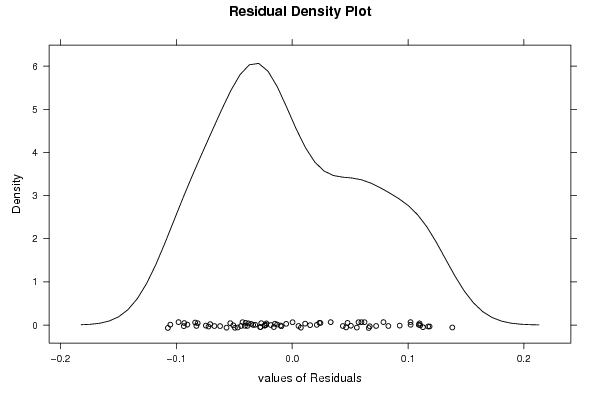
-Grafiek 'Residual Density Plot': Geen normaalverdeling voor dezelfde redenen als hierboven: top meer naar links en rechtse scheefheid. Ook zien we aan de rechtse zijde een inzakking, wat we links niet hebben.
2008-12-01 18:51:00 [Julian De Ruyter] [reply
Zeer correcte en volledige conclusie en uitleg. Je vergat enkel dat de koers (het intercept) nog kan afwijken naar boven of onder met ongeveer 0.3 (standaard deviatie) = foutenmarge

Post a new message
Dataseries X:
0,9059	0
0,8883	1
0,8924	1
0,8833	0
0,8700	0
0,8758	1
0,8858	1
0,9170	1
0,9554	1
0,9922	1
0,9778	1
0,9808	1
0,9811	1
1,0014	1
1,0183	1
1,0622	1
1,0773	1
1,0807	1
1,0848	1
1,1582	1
1,1663	1
1,1372	1
1,1139	1
1,1222	1
1,1692	1
1,1702	1
1,2286	1
1,2613	1
1,2646	1
1,2262	1
1,1985	0
1,2007	1
1,2138	1
1,2266	1
1,2176	0
1,2218	1
1,2490	1
1,2991	1
1,3408	1
1,3119	0
1,3014	0
1,3201	1
1,2938	0
1,2694	0
1,2165	0
1,2037	0
1,2292	1
1,2256	0
1,2015	0
1,1786	0
1,1856	1
1,2103	1
1,1938	0
1,2020	1
1,2271	1
1,2770	1
1,2650	0
1,2684	1
1,2811	1
1,2727	0
1,2611	0
1,2881	1
1,3213	1
1,2999	0
1,3074	1
1,3242	1
1,3516	1
1,3511	0
1,3419	0
1,3716	1
1,3622	0
1,3896	1
1,4227	1
1,4684	1


Summary of computational transaction
Raw Inputview raw input (R code)
Raw Outputview raw output of R engine
Computing time7 seconds
R Server'Herman Ole Andreas Wold' @ 193.190.124.10:1001

\begin{tabular}{lllllllll}
\hline
Summary of computational transaction \tabularnewline
Raw Input & view raw input (R code)  \tabularnewline
Raw Output & view raw output of R engine  \tabularnewline
Computing time & 7 seconds \tabularnewline
R Server & 'Herman Ole Andreas Wold' @ 193.190.124.10:1001 \tabularnewline
\hline
\end{tabular}
%Source: https://freestatistics.org/blog/index.php?pk=25208&T=0

[TABLE]
[ROW][C]Summary of computational transaction[/C][/ROW]
[ROW][C]Raw Input[/C][C]view raw input (R code) [/C][/ROW]
[ROW][C]Raw Output[/C][C]view raw output of R engine [/C][/ROW]
[ROW][C]Computing time[/C][C]7 seconds[/C][/ROW]
[ROW][C]R Server[/C][C]'Herman Ole Andreas Wold' @ 193.190.124.10:1001[/C][/ROW]
[/TABLE]
Source: https://freestatistics.org/blog/index.php?pk=25208&T=0

Globally Unique Identifier (entire table): ba.freestatistics.org/blog/index.php?pk=25208&T=0

As an alternative you can also use a QR Code:  

The GUIDs for individual cells are displayed in the table below:

Summary of computational transaction
Raw Inputview raw input (R code)
Raw Outputview raw output of R engine
Computing time7 seconds
R Server'Herman Ole Andreas Wold' @ 193.190.124.10:1001


Multiple Linear Regression - Estimated Regression Equation
y[t] = + 0.915412011076497 + 0.0300483731394946x[t] + 0.00256322682644082M1[t] + 0.00242863433823974M2[t] + 0.00951129613146747M3[t] + 0.0251694730147742M4[t] + 0.0164201299950001M5[t] -0.00253673292785442M6[t] + 0.00323004843220317M7[t] + 0.0188473720790959M8[t] + 0.015089424582571M9[t] + 0.00552395718296547M10[t] + 0.00119934301977398M11[t] + 0.00634934301977397t + e[t]

\begin{tabular}{lllllllll}
\hline
Multiple Linear Regression - Estimated Regression Equation \tabularnewline
y[t] =  +  0.915412011076497 +  0.0300483731394946x[t] +  0.00256322682644082M1[t] +  0.00242863433823974M2[t] +  0.00951129613146747M3[t] +  0.0251694730147742M4[t] +  0.0164201299950001M5[t] -0.00253673292785442M6[t] +  0.00323004843220317M7[t] +  0.0188473720790959M8[t] +  0.015089424582571M9[t] +  0.00552395718296547M10[t] +  0.00119934301977398M11[t] +  0.00634934301977397t  + e[t] \tabularnewline
\hline
\end{tabular}
%Source: https://freestatistics.org/blog/index.php?pk=25208&T=1

[TABLE]
[ROW][C]Multiple Linear Regression - Estimated Regression Equation[/C][/ROW]
[ROW][C]y[t] =  +  0.915412011076497 +  0.0300483731394946x[t] +  0.00256322682644082M1[t] +  0.00242863433823974M2[t] +  0.00951129613146747M3[t] +  0.0251694730147742M4[t] +  0.0164201299950001M5[t] -0.00253673292785442M6[t] +  0.00323004843220317M7[t] +  0.0188473720790959M8[t] +  0.015089424582571M9[t] +  0.00552395718296547M10[t] +  0.00119934301977398M11[t] +  0.00634934301977397t  + e[t][/C][/ROW]
[/TABLE]
Source: https://freestatistics.org/blog/index.php?pk=25208&T=1

Globally Unique Identifier (entire table): ba.freestatistics.org/blog/index.php?pk=25208&T=1

As an alternative you can also use a QR Code:  

The GUIDs for individual cells are displayed in the table below:

Multiple Linear Regression - Estimated Regression Equation
y[t] = + 0.915412011076497 + 0.0300483731394946x[t] + 0.00256322682644082M1[t] + 0.00242863433823974M2[t] + 0.00951129613146747M3[t] + 0.0251694730147742M4[t] + 0.0164201299950001M5[t] -0.00253673292785442M6[t] + 0.00323004843220317M7[t] + 0.0188473720790959M8[t] + 0.015089424582571M9[t] + 0.00552395718296547M10[t] + 0.00119934301977398M11[t] + 0.00634934301977397t + e[t]


Multiple Linear Regression - Ordinary Least Squares
VariableParameterS.D.T-STATH0: parameter = 02-tail p-value1-tail p-value
(Intercept)0.9154120110764970.03819323.967800
x0.03004837313949460.0204341.47050.1466530.073327
M10.002563226826440820.0403260.06360.949530.474765
M20.002428634338239740.0403880.06010.952250.476125
M30.009511296131467470.0422950.22490.8228350.411418
M40.02516947301477420.042050.59860.5517170.275858
M50.01642012999500010.0420120.39080.6972990.34865
M6-0.002536732927854420.042252-0.060.9523250.476163
M70.003230048432203170.0417720.07730.9386210.469311
M80.01884737207909590.0417540.45140.6533340.326667
M90.0150894245825710.0419020.36010.7200280.360014
M100.005523957182965470.0418530.1320.8954380.447719
M110.001199343019773980.0417240.02870.9771640.488582
t0.006349343019773970.00040815.575600

\begin{tabular}{lllllllll}
\hline
Multiple Linear Regression - Ordinary Least Squares \tabularnewline
Variable & Parameter & S.D. & T-STATH0: parameter = 0 & 2-tail p-value & 1-tail p-value \tabularnewline
(Intercept) & 0.915412011076497 & 0.038193 & 23.9678 & 0 & 0 \tabularnewline
x & 0.0300483731394946 & 0.020434 & 1.4705 & 0.146653 & 0.073327 \tabularnewline
M1 & 0.00256322682644082 & 0.040326 & 0.0636 & 0.94953 & 0.474765 \tabularnewline
M2 & 0.00242863433823974 & 0.040388 & 0.0601 & 0.95225 & 0.476125 \tabularnewline
M3 & 0.00951129613146747 & 0.042295 & 0.2249 & 0.822835 & 0.411418 \tabularnewline
M4 & 0.0251694730147742 & 0.04205 & 0.5986 & 0.551717 & 0.275858 \tabularnewline
M5 & 0.0164201299950001 & 0.042012 & 0.3908 & 0.697299 & 0.34865 \tabularnewline
M6 & -0.00253673292785442 & 0.042252 & -0.06 & 0.952325 & 0.476163 \tabularnewline
M7 & 0.00323004843220317 & 0.041772 & 0.0773 & 0.938621 & 0.469311 \tabularnewline
M8 & 0.0188473720790959 & 0.041754 & 0.4514 & 0.653334 & 0.326667 \tabularnewline
M9 & 0.015089424582571 & 0.041902 & 0.3601 & 0.720028 & 0.360014 \tabularnewline
M10 & 0.00552395718296547 & 0.041853 & 0.132 & 0.895438 & 0.447719 \tabularnewline
M11 & 0.00119934301977398 & 0.041724 & 0.0287 & 0.977164 & 0.488582 \tabularnewline
t & 0.00634934301977397 & 0.000408 & 15.5756 & 0 & 0 \tabularnewline
\hline
\end{tabular}
%Source: https://freestatistics.org/blog/index.php?pk=25208&T=2

[TABLE]
[ROW][C]Multiple Linear Regression - Ordinary Least Squares[/C][/ROW]
[ROW][C]Variable[/C][C]Parameter[/C][C]S.D.[/C][C]T-STATH0: parameter = 0[/C][C]2-tail p-value[/C][C]1-tail p-value[/C][/ROW]
[ROW][C](Intercept)[/C][C]0.915412011076497[/C][C]0.038193[/C][C]23.9678[/C][C]0[/C][C]0[/C][/ROW]
[ROW][C]x[/C][C]0.0300483731394946[/C][C]0.020434[/C][C]1.4705[/C][C]0.146653[/C][C]0.073327[/C][/ROW]
[ROW][C]M1[/C][C]0.00256322682644082[/C][C]0.040326[/C][C]0.0636[/C][C]0.94953[/C][C]0.474765[/C][/ROW]
[ROW][C]M2[/C][C]0.00242863433823974[/C][C]0.040388[/C][C]0.0601[/C][C]0.95225[/C][C]0.476125[/C][/ROW]
[ROW][C]M3[/C][C]0.00951129613146747[/C][C]0.042295[/C][C]0.2249[/C][C]0.822835[/C][C]0.411418[/C][/ROW]
[ROW][C]M4[/C][C]0.0251694730147742[/C][C]0.04205[/C][C]0.5986[/C][C]0.551717[/C][C]0.275858[/C][/ROW]
[ROW][C]M5[/C][C]0.0164201299950001[/C][C]0.042012[/C][C]0.3908[/C][C]0.697299[/C][C]0.34865[/C][/ROW]
[ROW][C]M6[/C][C]-0.00253673292785442[/C][C]0.042252[/C][C]-0.06[/C][C]0.952325[/C][C]0.476163[/C][/ROW]
[ROW][C]M7[/C][C]0.00323004843220317[/C][C]0.041772[/C][C]0.0773[/C][C]0.938621[/C][C]0.469311[/C][/ROW]
[ROW][C]M8[/C][C]0.0188473720790959[/C][C]0.041754[/C][C]0.4514[/C][C]0.653334[/C][C]0.326667[/C][/ROW]
[ROW][C]M9[/C][C]0.015089424582571[/C][C]0.041902[/C][C]0.3601[/C][C]0.720028[/C][C]0.360014[/C][/ROW]
[ROW][C]M10[/C][C]0.00552395718296547[/C][C]0.041853[/C][C]0.132[/C][C]0.895438[/C][C]0.447719[/C][/ROW]
[ROW][C]M11[/C][C]0.00119934301977398[/C][C]0.041724[/C][C]0.0287[/C][C]0.977164[/C][C]0.488582[/C][/ROW]
[ROW][C]t[/C][C]0.00634934301977397[/C][C]0.000408[/C][C]15.5756[/C][C]0[/C][C]0[/C][/ROW]
[/TABLE]
Source: https://freestatistics.org/blog/index.php?pk=25208&T=2

Globally Unique Identifier (entire table): ba.freestatistics.org/blog/index.php?pk=25208&T=2

As an alternative you can also use a QR Code:  

The GUIDs for individual cells are displayed in the table below:

Multiple Linear Regression - Ordinary Least Squares
VariableParameterS.D.T-STATH0: parameter = 02-tail p-value1-tail p-value
(Intercept)0.9154120110764970.03819323.967800
x0.03004837313949460.0204341.47050.1466530.073327
M10.002563226826440820.0403260.06360.949530.474765
M20.002428634338239740.0403880.06010.952250.476125
M30.009511296131467470.0422950.22490.8228350.411418
M40.02516947301477420.042050.59860.5517170.275858
M50.01642012999500010.0420120.39080.6972990.34865
M6-0.002536732927854420.042252-0.060.9523250.476163
M70.003230048432203170.0417720.07730.9386210.469311
M80.01884737207909590.0417540.45140.6533340.326667
M90.0150894245825710.0419020.36010.7200280.360014
M100.005523957182965470.0418530.1320.8954380.447719
M110.001199343019773980.0417240.02870.9771640.488582
t0.006349343019773970.00040815.575600


Multiple Linear Regression - Regression Statistics
Multiple R0.89809725814331
R-squared0.80657868508453
Adjusted R-squared0.764670733519511
F-TEST (value)19.2464354606585
F-TEST (DF numerator)13
F-TEST (DF denominator)60
p-value1.11022302462516e-16
Multiple Linear Regression - Residual Statistics
Residual Standard Deviation0.0722646153436207
Sum Squared Residuals0.313330477845687

\begin{tabular}{lllllllll}
\hline
Multiple Linear Regression - Regression Statistics \tabularnewline
Multiple R & 0.89809725814331 \tabularnewline
R-squared & 0.80657868508453 \tabularnewline
Adjusted R-squared & 0.764670733519511 \tabularnewline
F-TEST (value) & 19.2464354606585 \tabularnewline
F-TEST (DF numerator) & 13 \tabularnewline
F-TEST (DF denominator) & 60 \tabularnewline
p-value & 1.11022302462516e-16 \tabularnewline
Multiple Linear Regression - Residual Statistics \tabularnewline
Residual Standard Deviation & 0.0722646153436207 \tabularnewline
Sum Squared Residuals & 0.313330477845687 \tabularnewline
\hline
\end{tabular}
%Source: https://freestatistics.org/blog/index.php?pk=25208&T=3

[TABLE]
[ROW][C]Multiple Linear Regression - Regression Statistics[/C][/ROW]
[ROW][C]Multiple R[/C][C]0.89809725814331[/C][/ROW]
[ROW][C]R-squared[/C][C]0.80657868508453[/C][/ROW]
[ROW][C]Adjusted R-squared[/C][C]0.764670733519511[/C][/ROW]
[ROW][C]F-TEST (value)[/C][C]19.2464354606585[/C][/ROW]
[ROW][C]F-TEST (DF numerator)[/C][C]13[/C][/ROW]
[ROW][C]F-TEST (DF denominator)[/C][C]60[/C][/ROW]
[ROW][C]p-value[/C][C]1.11022302462516e-16[/C][/ROW]
[ROW][C]Multiple Linear Regression - Residual Statistics[/C][/ROW]
[ROW][C]Residual Standard Deviation[/C][C]0.0722646153436207[/C][/ROW]
[ROW][C]Sum Squared Residuals[/C][C]0.313330477845687[/C][/ROW]
[/TABLE]
Source: https://freestatistics.org/blog/index.php?pk=25208&T=3

Globally Unique Identifier (entire table): ba.freestatistics.org/blog/index.php?pk=25208&T=3

As an alternative you can also use a QR Code:  

The GUIDs for individual cells are displayed in the table below:

Multiple Linear Regression - Regression Statistics
Multiple R0.89809725814331
R-squared0.80657868508453
Adjusted R-squared0.764670733519511
F-TEST (value)19.2464354606585
F-TEST (DF numerator)13
F-TEST (DF denominator)60
p-value1.11022302462516e-16
Multiple Linear Regression - Residual Statistics
Residual Standard Deviation0.0722646153436207
Sum Squared Residuals0.313330477845687


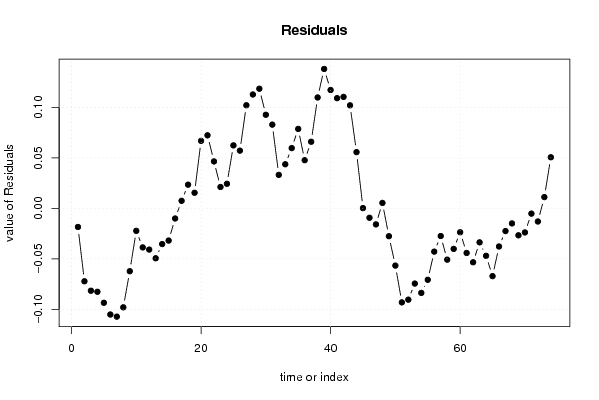
Multiple Linear Regression - Actuals, Interpolation, and Residuals
Time or IndexActualsInterpolationForecastResidualsPrediction Error
10.90590.924324580922712-0.0184245809227117
20.88830.96058770459378-0.0722877045937794
30.89240.974019709406781-0.0816197094067811
40.88330.965978856170367-0.0826788561703672
50.870.963578856170367-0.093578856170367
60.87580.981019709406781-0.105219709406781
70.88580.993135833786613-0.107335833786613
80.9171.01510250045328-0.0981025004532792
90.95541.01769389597653-0.0622938959765283
100.99221.01447777159670-0.0222777715966968
110.97781.01650250045328-0.0387025004532793
120.98081.02165250045328-0.0408525004532793
130.98111.03056507029949-0.049465070299494
141.00141.03677982083107-0.0353798208310667
151.01831.05021182564407-0.0319118256440686
161.06221.07221934554715-0.0100193455471493
171.07731.069819345547150.00748065445285071
181.08071.057211825644070.0234881743559314
191.08481.06932795002390.0154720499760998
201.15821.091294616690570.0669053833094331
211.16631.093886012213820.072413987786184
221.13721.090669887833980.0465301121660156
231.11391.092694616690570.0212053833094330
241.12221.097844616690570.0243553833094332
251.16921.106757186536780.0624428134632184
261.17021.112971937068350.0572280629316454
271.22861.126403941881360.102196058118644
281.26131.148411461784440.112888538215563
291.26461.146011461784440.118588538215563
301.22621.133403941881360.0927960581186437
311.19851.115471693121690.0830283068783068
321.20071.167486732927850.0332132670721456
331.21381.170078128451100.0437218715488965
341.22661.166862004071270.059737995928728
351.21761.138838359788360.0787616402116402
361.22181.174036732927850.0477632670721456
371.2491.182949302774070.066050697225931
381.29911.189164053305640.109935946694358
391.34081.202596058118640.138203941881356
401.31191.194555204882230.117344795117770
411.30141.192155204882230.109244795117770
421.32011.209596058118640.110503941881356
431.29381.191663809358980.102136190641019
441.26941.213630476025650.0557695239743527
451.21651.216221871548900.000278128451103460
461.20371.21300574716906-0.00930574716906494
471.22921.24507884916514-0.0158788491651419
481.22561.220180476025650.00541952397435265
491.20151.22909304587186-0.0275930458718621
501.17861.23530779640343-0.0567077964034349
511.18561.27878817435593-0.0931881743559313
521.21031.30079569425901-0.0904956942590121
531.19381.26834732111952-0.0745473211195174
541.2021.28578817435593-0.0837881743559314
551.22711.29790429873576-0.0708042987357628
561.2771.31987096540243-0.0428709654024296
571.2651.29241398778618-0.0274139877861841
581.26841.31924623654585-0.0508462365458471
591.28111.32127096540243-0.0401709654024297
601.27271.29637259226293-0.023672592262935
611.26111.30528516210915-0.0441851621091496
621.28811.34154828578022-0.0534482857802173
631.32131.35498029059322-0.0336802905932190
641.29991.34693943735680-0.0470394373568049
651.30741.3745878104963-0.0671878104962997
661.32421.36198029059322-0.0377802905932189
671.35161.37409641497305-0.0224964149730506
681.35111.36601470850022-0.0149147085002226
691.34191.36860610402347-0.0267061040234715
701.37161.39543835278313-0.0238383527831347
711.36221.36741470850022-0.00521470850022241
721.38961.40261308163972-0.0130130816397173
731.42271.411525651485930.0111743485140681
741.46841.417740402017500.0506595979824951

\begin{tabular}{lllllllll}
\hline
Multiple Linear Regression - Actuals, Interpolation, and Residuals \tabularnewline
Time or Index & Actuals & InterpolationForecast & ResidualsPrediction Error \tabularnewline
1 & 0.9059 & 0.924324580922712 & -0.0184245809227117 \tabularnewline
2 & 0.8883 & 0.96058770459378 & -0.0722877045937794 \tabularnewline
3 & 0.8924 & 0.974019709406781 & -0.0816197094067811 \tabularnewline
4 & 0.8833 & 0.965978856170367 & -0.0826788561703672 \tabularnewline
5 & 0.87 & 0.963578856170367 & -0.093578856170367 \tabularnewline
6 & 0.8758 & 0.981019709406781 & -0.105219709406781 \tabularnewline
7 & 0.8858 & 0.993135833786613 & -0.107335833786613 \tabularnewline
8 & 0.917 & 1.01510250045328 & -0.0981025004532792 \tabularnewline
9 & 0.9554 & 1.01769389597653 & -0.0622938959765283 \tabularnewline
10 & 0.9922 & 1.01447777159670 & -0.0222777715966968 \tabularnewline
11 & 0.9778 & 1.01650250045328 & -0.0387025004532793 \tabularnewline
12 & 0.9808 & 1.02165250045328 & -0.0408525004532793 \tabularnewline
13 & 0.9811 & 1.03056507029949 & -0.049465070299494 \tabularnewline
14 & 1.0014 & 1.03677982083107 & -0.0353798208310667 \tabularnewline
15 & 1.0183 & 1.05021182564407 & -0.0319118256440686 \tabularnewline
16 & 1.0622 & 1.07221934554715 & -0.0100193455471493 \tabularnewline
17 & 1.0773 & 1.06981934554715 & 0.00748065445285071 \tabularnewline
18 & 1.0807 & 1.05721182564407 & 0.0234881743559314 \tabularnewline
19 & 1.0848 & 1.0693279500239 & 0.0154720499760998 \tabularnewline
20 & 1.1582 & 1.09129461669057 & 0.0669053833094331 \tabularnewline
21 & 1.1663 & 1.09388601221382 & 0.072413987786184 \tabularnewline
22 & 1.1372 & 1.09066988783398 & 0.0465301121660156 \tabularnewline
23 & 1.1139 & 1.09269461669057 & 0.0212053833094330 \tabularnewline
24 & 1.1222 & 1.09784461669057 & 0.0243553833094332 \tabularnewline
25 & 1.1692 & 1.10675718653678 & 0.0624428134632184 \tabularnewline
26 & 1.1702 & 1.11297193706835 & 0.0572280629316454 \tabularnewline
27 & 1.2286 & 1.12640394188136 & 0.102196058118644 \tabularnewline
28 & 1.2613 & 1.14841146178444 & 0.112888538215563 \tabularnewline
29 & 1.2646 & 1.14601146178444 & 0.118588538215563 \tabularnewline
30 & 1.2262 & 1.13340394188136 & 0.0927960581186437 \tabularnewline
31 & 1.1985 & 1.11547169312169 & 0.0830283068783068 \tabularnewline
32 & 1.2007 & 1.16748673292785 & 0.0332132670721456 \tabularnewline
33 & 1.2138 & 1.17007812845110 & 0.0437218715488965 \tabularnewline
34 & 1.2266 & 1.16686200407127 & 0.059737995928728 \tabularnewline
35 & 1.2176 & 1.13883835978836 & 0.0787616402116402 \tabularnewline
36 & 1.2218 & 1.17403673292785 & 0.0477632670721456 \tabularnewline
37 & 1.249 & 1.18294930277407 & 0.066050697225931 \tabularnewline
38 & 1.2991 & 1.18916405330564 & 0.109935946694358 \tabularnewline
39 & 1.3408 & 1.20259605811864 & 0.138203941881356 \tabularnewline
40 & 1.3119 & 1.19455520488223 & 0.117344795117770 \tabularnewline
41 & 1.3014 & 1.19215520488223 & 0.109244795117770 \tabularnewline
42 & 1.3201 & 1.20959605811864 & 0.110503941881356 \tabularnewline
43 & 1.2938 & 1.19166380935898 & 0.102136190641019 \tabularnewline
44 & 1.2694 & 1.21363047602565 & 0.0557695239743527 \tabularnewline
45 & 1.2165 & 1.21622187154890 & 0.000278128451103460 \tabularnewline
46 & 1.2037 & 1.21300574716906 & -0.00930574716906494 \tabularnewline
47 & 1.2292 & 1.24507884916514 & -0.0158788491651419 \tabularnewline
48 & 1.2256 & 1.22018047602565 & 0.00541952397435265 \tabularnewline
49 & 1.2015 & 1.22909304587186 & -0.0275930458718621 \tabularnewline
50 & 1.1786 & 1.23530779640343 & -0.0567077964034349 \tabularnewline
51 & 1.1856 & 1.27878817435593 & -0.0931881743559313 \tabularnewline
52 & 1.2103 & 1.30079569425901 & -0.0904956942590121 \tabularnewline
53 & 1.1938 & 1.26834732111952 & -0.0745473211195174 \tabularnewline
54 & 1.202 & 1.28578817435593 & -0.0837881743559314 \tabularnewline
55 & 1.2271 & 1.29790429873576 & -0.0708042987357628 \tabularnewline
56 & 1.277 & 1.31987096540243 & -0.0428709654024296 \tabularnewline
57 & 1.265 & 1.29241398778618 & -0.0274139877861841 \tabularnewline
58 & 1.2684 & 1.31924623654585 & -0.0508462365458471 \tabularnewline
59 & 1.2811 & 1.32127096540243 & -0.0401709654024297 \tabularnewline
60 & 1.2727 & 1.29637259226293 & -0.023672592262935 \tabularnewline
61 & 1.2611 & 1.30528516210915 & -0.0441851621091496 \tabularnewline
62 & 1.2881 & 1.34154828578022 & -0.0534482857802173 \tabularnewline
63 & 1.3213 & 1.35498029059322 & -0.0336802905932190 \tabularnewline
64 & 1.2999 & 1.34693943735680 & -0.0470394373568049 \tabularnewline
65 & 1.3074 & 1.3745878104963 & -0.0671878104962997 \tabularnewline
66 & 1.3242 & 1.36198029059322 & -0.0377802905932189 \tabularnewline
67 & 1.3516 & 1.37409641497305 & -0.0224964149730506 \tabularnewline
68 & 1.3511 & 1.36601470850022 & -0.0149147085002226 \tabularnewline
69 & 1.3419 & 1.36860610402347 & -0.0267061040234715 \tabularnewline
70 & 1.3716 & 1.39543835278313 & -0.0238383527831347 \tabularnewline
71 & 1.3622 & 1.36741470850022 & -0.00521470850022241 \tabularnewline
72 & 1.3896 & 1.40261308163972 & -0.0130130816397173 \tabularnewline
73 & 1.4227 & 1.41152565148593 & 0.0111743485140681 \tabularnewline
74 & 1.4684 & 1.41774040201750 & 0.0506595979824951 \tabularnewline
\hline
\end{tabular}
%Source: https://freestatistics.org/blog/index.php?pk=25208&T=4

[TABLE]
[ROW][C]Multiple Linear Regression - Actuals, Interpolation, and Residuals[/C][/ROW]
[ROW][C]Time or Index[/C][C]Actuals[/C][C]InterpolationForecast[/C][C]ResidualsPrediction Error[/C][/ROW]
[ROW][C]1[/C][C]0.9059[/C][C]0.924324580922712[/C][C]-0.0184245809227117[/C][/ROW]
[ROW][C]2[/C][C]0.8883[/C][C]0.96058770459378[/C][C]-0.0722877045937794[/C][/ROW]
[ROW][C]3[/C][C]0.8924[/C][C]0.974019709406781[/C][C]-0.0816197094067811[/C][/ROW]
[ROW][C]4[/C][C]0.8833[/C][C]0.965978856170367[/C][C]-0.0826788561703672[/C][/ROW]
[ROW][C]5[/C][C]0.87[/C][C]0.963578856170367[/C][C]-0.093578856170367[/C][/ROW]
[ROW][C]6[/C][C]0.8758[/C][C]0.981019709406781[/C][C]-0.105219709406781[/C][/ROW]
[ROW][C]7[/C][C]0.8858[/C][C]0.993135833786613[/C][C]-0.107335833786613[/C][/ROW]
[ROW][C]8[/C][C]0.917[/C][C]1.01510250045328[/C][C]-0.0981025004532792[/C][/ROW]
[ROW][C]9[/C][C]0.9554[/C][C]1.01769389597653[/C][C]-0.0622938959765283[/C][/ROW]
[ROW][C]10[/C][C]0.9922[/C][C]1.01447777159670[/C][C]-0.0222777715966968[/C][/ROW]
[ROW][C]11[/C][C]0.9778[/C][C]1.01650250045328[/C][C]-0.0387025004532793[/C][/ROW]
[ROW][C]12[/C][C]0.9808[/C][C]1.02165250045328[/C][C]-0.0408525004532793[/C][/ROW]
[ROW][C]13[/C][C]0.9811[/C][C]1.03056507029949[/C][C]-0.049465070299494[/C][/ROW]
[ROW][C]14[/C][C]1.0014[/C][C]1.03677982083107[/C][C]-0.0353798208310667[/C][/ROW]
[ROW][C]15[/C][C]1.0183[/C][C]1.05021182564407[/C][C]-0.0319118256440686[/C][/ROW]
[ROW][C]16[/C][C]1.0622[/C][C]1.07221934554715[/C][C]-0.0100193455471493[/C][/ROW]
[ROW][C]17[/C][C]1.0773[/C][C]1.06981934554715[/C][C]0.00748065445285071[/C][/ROW]
[ROW][C]18[/C][C]1.0807[/C][C]1.05721182564407[/C][C]0.0234881743559314[/C][/ROW]
[ROW][C]19[/C][C]1.0848[/C][C]1.0693279500239[/C][C]0.0154720499760998[/C][/ROW]
[ROW][C]20[/C][C]1.1582[/C][C]1.09129461669057[/C][C]0.0669053833094331[/C][/ROW]
[ROW][C]21[/C][C]1.1663[/C][C]1.09388601221382[/C][C]0.072413987786184[/C][/ROW]
[ROW][C]22[/C][C]1.1372[/C][C]1.09066988783398[/C][C]0.0465301121660156[/C][/ROW]
[ROW][C]23[/C][C]1.1139[/C][C]1.09269461669057[/C][C]0.0212053833094330[/C][/ROW]
[ROW][C]24[/C][C]1.1222[/C][C]1.09784461669057[/C][C]0.0243553833094332[/C][/ROW]
[ROW][C]25[/C][C]1.1692[/C][C]1.10675718653678[/C][C]0.0624428134632184[/C][/ROW]
[ROW][C]26[/C][C]1.1702[/C][C]1.11297193706835[/C][C]0.0572280629316454[/C][/ROW]
[ROW][C]27[/C][C]1.2286[/C][C]1.12640394188136[/C][C]0.102196058118644[/C][/ROW]
[ROW][C]28[/C][C]1.2613[/C][C]1.14841146178444[/C][C]0.112888538215563[/C][/ROW]
[ROW][C]29[/C][C]1.2646[/C][C]1.14601146178444[/C][C]0.118588538215563[/C][/ROW]
[ROW][C]30[/C][C]1.2262[/C][C]1.13340394188136[/C][C]0.0927960581186437[/C][/ROW]
[ROW][C]31[/C][C]1.1985[/C][C]1.11547169312169[/C][C]0.0830283068783068[/C][/ROW]
[ROW][C]32[/C][C]1.2007[/C][C]1.16748673292785[/C][C]0.0332132670721456[/C][/ROW]
[ROW][C]33[/C][C]1.2138[/C][C]1.17007812845110[/C][C]0.0437218715488965[/C][/ROW]
[ROW][C]34[/C][C]1.2266[/C][C]1.16686200407127[/C][C]0.059737995928728[/C][/ROW]
[ROW][C]35[/C][C]1.2176[/C][C]1.13883835978836[/C][C]0.0787616402116402[/C][/ROW]
[ROW][C]36[/C][C]1.2218[/C][C]1.17403673292785[/C][C]0.0477632670721456[/C][/ROW]
[ROW][C]37[/C][C]1.249[/C][C]1.18294930277407[/C][C]0.066050697225931[/C][/ROW]
[ROW][C]38[/C][C]1.2991[/C][C]1.18916405330564[/C][C]0.109935946694358[/C][/ROW]
[ROW][C]39[/C][C]1.3408[/C][C]1.20259605811864[/C][C]0.138203941881356[/C][/ROW]
[ROW][C]40[/C][C]1.3119[/C][C]1.19455520488223[/C][C]0.117344795117770[/C][/ROW]
[ROW][C]41[/C][C]1.3014[/C][C]1.19215520488223[/C][C]0.109244795117770[/C][/ROW]
[ROW][C]42[/C][C]1.3201[/C][C]1.20959605811864[/C][C]0.110503941881356[/C][/ROW]
[ROW][C]43[/C][C]1.2938[/C][C]1.19166380935898[/C][C]0.102136190641019[/C][/ROW]
[ROW][C]44[/C][C]1.2694[/C][C]1.21363047602565[/C][C]0.0557695239743527[/C][/ROW]
[ROW][C]45[/C][C]1.2165[/C][C]1.21622187154890[/C][C]0.000278128451103460[/C][/ROW]
[ROW][C]46[/C][C]1.2037[/C][C]1.21300574716906[/C][C]-0.00930574716906494[/C][/ROW]
[ROW][C]47[/C][C]1.2292[/C][C]1.24507884916514[/C][C]-0.0158788491651419[/C][/ROW]
[ROW][C]48[/C][C]1.2256[/C][C]1.22018047602565[/C][C]0.00541952397435265[/C][/ROW]
[ROW][C]49[/C][C]1.2015[/C][C]1.22909304587186[/C][C]-0.0275930458718621[/C][/ROW]
[ROW][C]50[/C][C]1.1786[/C][C]1.23530779640343[/C][C]-0.0567077964034349[/C][/ROW]
[ROW][C]51[/C][C]1.1856[/C][C]1.27878817435593[/C][C]-0.0931881743559313[/C][/ROW]
[ROW][C]52[/C][C]1.2103[/C][C]1.30079569425901[/C][C]-0.0904956942590121[/C][/ROW]
[ROW][C]53[/C][C]1.1938[/C][C]1.26834732111952[/C][C]-0.0745473211195174[/C][/ROW]
[ROW][C]54[/C][C]1.202[/C][C]1.28578817435593[/C][C]-0.0837881743559314[/C][/ROW]
[ROW][C]55[/C][C]1.2271[/C][C]1.29790429873576[/C][C]-0.0708042987357628[/C][/ROW]
[ROW][C]56[/C][C]1.277[/C][C]1.31987096540243[/C][C]-0.0428709654024296[/C][/ROW]
[ROW][C]57[/C][C]1.265[/C][C]1.29241398778618[/C][C]-0.0274139877861841[/C][/ROW]
[ROW][C]58[/C][C]1.2684[/C][C]1.31924623654585[/C][C]-0.0508462365458471[/C][/ROW]
[ROW][C]59[/C][C]1.2811[/C][C]1.32127096540243[/C][C]-0.0401709654024297[/C][/ROW]
[ROW][C]60[/C][C]1.2727[/C][C]1.29637259226293[/C][C]-0.023672592262935[/C][/ROW]
[ROW][C]61[/C][C]1.2611[/C][C]1.30528516210915[/C][C]-0.0441851621091496[/C][/ROW]
[ROW][C]62[/C][C]1.2881[/C][C]1.34154828578022[/C][C]-0.0534482857802173[/C][/ROW]
[ROW][C]63[/C][C]1.3213[/C][C]1.35498029059322[/C][C]-0.0336802905932190[/C][/ROW]
[ROW][C]64[/C][C]1.2999[/C][C]1.34693943735680[/C][C]-0.0470394373568049[/C][/ROW]
[ROW][C]65[/C][C]1.3074[/C][C]1.3745878104963[/C][C]-0.0671878104962997[/C][/ROW]
[ROW][C]66[/C][C]1.3242[/C][C]1.36198029059322[/C][C]-0.0377802905932189[/C][/ROW]
[ROW][C]67[/C][C]1.3516[/C][C]1.37409641497305[/C][C]-0.0224964149730506[/C][/ROW]
[ROW][C]68[/C][C]1.3511[/C][C]1.36601470850022[/C][C]-0.0149147085002226[/C][/ROW]
[ROW][C]69[/C][C]1.3419[/C][C]1.36860610402347[/C][C]-0.0267061040234715[/C][/ROW]
[ROW][C]70[/C][C]1.3716[/C][C]1.39543835278313[/C][C]-0.0238383527831347[/C][/ROW]
[ROW][C]71[/C][C]1.3622[/C][C]1.36741470850022[/C][C]-0.00521470850022241[/C][/ROW]
[ROW][C]72[/C][C]1.3896[/C][C]1.40261308163972[/C][C]-0.0130130816397173[/C][/ROW]
[ROW][C]73[/C][C]1.4227[/C][C]1.41152565148593[/C][C]0.0111743485140681[/C][/ROW]
[ROW][C]74[/C][C]1.4684[/C][C]1.41774040201750[/C][C]0.0506595979824951[/C][/ROW]
[/TABLE]
Source: https://freestatistics.org/blog/index.php?pk=25208&T=4

Globally Unique Identifier (entire table): ba.freestatistics.org/blog/index.php?pk=25208&T=4

As an alternative you can also use a QR Code:  

The GUIDs for individual cells are displayed in the table below:

Multiple Linear Regression - Actuals, Interpolation, and Residuals
Time or IndexActualsInterpolationForecastResidualsPrediction Error
10.90590.924324580922712-0.0184245809227117
20.88830.96058770459378-0.0722877045937794
30.89240.974019709406781-0.0816197094067811
40.88330.965978856170367-0.0826788561703672
50.870.963578856170367-0.093578856170367
60.87580.981019709406781-0.105219709406781
70.88580.993135833786613-0.107335833786613
80.9171.01510250045328-0.0981025004532792
90.95541.01769389597653-0.0622938959765283
100.99221.01447777159670-0.0222777715966968
110.97781.01650250045328-0.0387025004532793
120.98081.02165250045328-0.0408525004532793
130.98111.03056507029949-0.049465070299494
141.00141.03677982083107-0.0353798208310667
151.01831.05021182564407-0.0319118256440686
161.06221.07221934554715-0.0100193455471493
171.07731.069819345547150.00748065445285071
181.08071.057211825644070.0234881743559314
191.08481.06932795002390.0154720499760998
201.15821.091294616690570.0669053833094331
211.16631.093886012213820.072413987786184
221.13721.090669887833980.0465301121660156
231.11391.092694616690570.0212053833094330
241.12221.097844616690570.0243553833094332
251.16921.106757186536780.0624428134632184
261.17021.112971937068350.0572280629316454
271.22861.126403941881360.102196058118644
281.26131.148411461784440.112888538215563
291.26461.146011461784440.118588538215563
301.22621.133403941881360.0927960581186437
311.19851.115471693121690.0830283068783068
321.20071.167486732927850.0332132670721456
331.21381.170078128451100.0437218715488965
341.22661.166862004071270.059737995928728
351.21761.138838359788360.0787616402116402
361.22181.174036732927850.0477632670721456
371.2491.182949302774070.066050697225931
381.29911.189164053305640.109935946694358
391.34081.202596058118640.138203941881356
401.31191.194555204882230.117344795117770
411.30141.192155204882230.109244795117770
421.32011.209596058118640.110503941881356
431.29381.191663809358980.102136190641019
441.26941.213630476025650.0557695239743527
451.21651.216221871548900.000278128451103460
461.20371.21300574716906-0.00930574716906494
471.22921.24507884916514-0.0158788491651419
481.22561.220180476025650.00541952397435265
491.20151.22909304587186-0.0275930458718621
501.17861.23530779640343-0.0567077964034349
511.18561.27878817435593-0.0931881743559313
521.21031.30079569425901-0.0904956942590121
531.19381.26834732111952-0.0745473211195174
541.2021.28578817435593-0.0837881743559314
551.22711.29790429873576-0.0708042987357628
561.2771.31987096540243-0.0428709654024296
571.2651.29241398778618-0.0274139877861841
581.26841.31924623654585-0.0508462365458471
591.28111.32127096540243-0.0401709654024297
601.27271.29637259226293-0.023672592262935
611.26111.30528516210915-0.0441851621091496
621.28811.34154828578022-0.0534482857802173
631.32131.35498029059322-0.0336802905932190
641.29991.34693943735680-0.0470394373568049
651.30741.3745878104963-0.0671878104962997
661.32421.36198029059322-0.0377802905932189
671.35161.37409641497305-0.0224964149730506
681.35111.36601470850022-0.0149147085002226
691.34191.36860610402347-0.0267061040234715
701.37161.39543835278313-0.0238383527831347
711.36221.36741470850022-0.00521470850022241
721.38961.40261308163972-0.0130130816397173
731.42271.411525651485930.0111743485140681
741.46841.417740402017500.0506595979824951


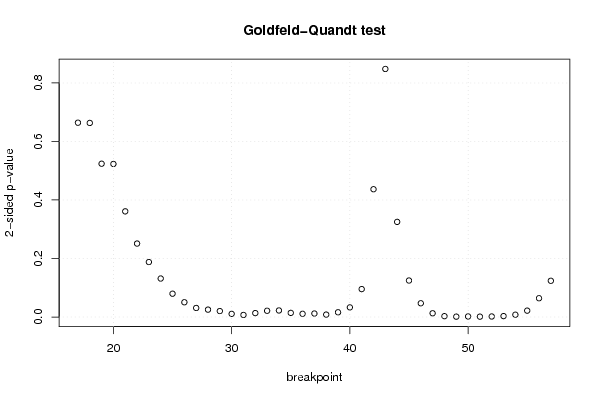
Goldfeld-Quandt test for Heteroskedasticity
p-valuesAlternative Hypothesis
breakpoint indexgreater2-sidedless
170.3320992968654840.6641985937309670.667900703134516
180.3316926960433080.6633853920866160.668307303956692
190.2619815525265560.5239631050531110.738018447473444
200.261575894727840.523151789455680.73842410527216
210.1805738441436700.3611476882873400.81942615585633
220.1255201630270100.2510403260540210.87447983697299
230.09392882125623650.1878576425124730.906071178743764
240.06577534401490320.1315506880298060.934224655985097
250.0398343193541020.0796686387082040.960165680645898
260.02519285160032890.05038570320065790.974807148399671
270.01541627665417610.03083255330835210.984583723345824
280.01258192758782770.02516385517565550.987418072412172
290.01017167907961420.02034335815922840.989828320920386
300.005365116882091490.01073023376418300.994634883117908
310.003499054597327250.006998109194654490.996500945402673
320.006684860249562510.01336972049912500.993315139750438
330.01067062256952620.02134124513905240.989329377430474
340.01117129957412070.02234259914824140.98882870042588
350.00705014828212890.01410029656425780.992949851717871
360.005472040122901270.01094408024580250.994527959877099
370.005928516376870160.01185703275374030.99407148362313
380.004089667654316340.008179335308632680.995910332345684
390.008049895402432110.01609979080486420.991950104597568
400.01644235512056030.03288471024112060.98355764487944
410.04769347209808040.09538694419616080.95230652790192
420.2183740859915750.4367481719831510.781625914008425
430.5760262523705890.8479474952588220.423973747629411
440.837422020522050.32515595895590.16257797947795
450.9376555407119020.1246889185761970.0623444592880983
460.9765091515455010.0469816969089980.023490848454499
470.9936154234039530.01276915319209450.00638457659604725
480.998562490200030.002875019599938280.00143750979996914
490.99940297720850.001194045583000740.000597022791500372
500.9990818419639890.001836316072022820.00091815803601141
510.9993766411884340.001246717623132170.000623358811566083
520.9991233342360030.001753331527993830.000876665763996913
530.9984793336199030.003041332760194170.00152066638009709
540.9960894003597240.00782119928055160.0039105996402758
550.9891460643670520.02170787126589690.0108539356329485
560.9678989576071420.06420208478571510.0321010423928576
570.9380837195835270.1238325608329460.061916280416473

\begin{tabular}{lllllllll}
\hline
Goldfeld-Quandt test for Heteroskedasticity \tabularnewline
p-values & Alternative Hypothesis \tabularnewline
breakpoint index & greater & 2-sided & less \tabularnewline
17 & 0.332099296865484 & 0.664198593730967 & 0.667900703134516 \tabularnewline
18 & 0.331692696043308 & 0.663385392086616 & 0.668307303956692 \tabularnewline
19 & 0.261981552526556 & 0.523963105053111 & 0.738018447473444 \tabularnewline
20 & 0.26157589472784 & 0.52315178945568 & 0.73842410527216 \tabularnewline
21 & 0.180573844143670 & 0.361147688287340 & 0.81942615585633 \tabularnewline
22 & 0.125520163027010 & 0.251040326054021 & 0.87447983697299 \tabularnewline
23 & 0.0939288212562365 & 0.187857642512473 & 0.906071178743764 \tabularnewline
24 & 0.0657753440149032 & 0.131550688029806 & 0.934224655985097 \tabularnewline
25 & 0.039834319354102 & 0.079668638708204 & 0.960165680645898 \tabularnewline
26 & 0.0251928516003289 & 0.0503857032006579 & 0.974807148399671 \tabularnewline
27 & 0.0154162766541761 & 0.0308325533083521 & 0.984583723345824 \tabularnewline
28 & 0.0125819275878277 & 0.0251638551756555 & 0.987418072412172 \tabularnewline
29 & 0.0101716790796142 & 0.0203433581592284 & 0.989828320920386 \tabularnewline
30 & 0.00536511688209149 & 0.0107302337641830 & 0.994634883117908 \tabularnewline
31 & 0.00349905459732725 & 0.00699810919465449 & 0.996500945402673 \tabularnewline
32 & 0.00668486024956251 & 0.0133697204991250 & 0.993315139750438 \tabularnewline
33 & 0.0106706225695262 & 0.0213412451390524 & 0.989329377430474 \tabularnewline
34 & 0.0111712995741207 & 0.0223425991482414 & 0.98882870042588 \tabularnewline
35 & 0.0070501482821289 & 0.0141002965642578 & 0.992949851717871 \tabularnewline
36 & 0.00547204012290127 & 0.0109440802458025 & 0.994527959877099 \tabularnewline
37 & 0.00592851637687016 & 0.0118570327537403 & 0.99407148362313 \tabularnewline
38 & 0.00408966765431634 & 0.00817933530863268 & 0.995910332345684 \tabularnewline
39 & 0.00804989540243211 & 0.0160997908048642 & 0.991950104597568 \tabularnewline
40 & 0.0164423551205603 & 0.0328847102411206 & 0.98355764487944 \tabularnewline
41 & 0.0476934720980804 & 0.0953869441961608 & 0.95230652790192 \tabularnewline
42 & 0.218374085991575 & 0.436748171983151 & 0.781625914008425 \tabularnewline
43 & 0.576026252370589 & 0.847947495258822 & 0.423973747629411 \tabularnewline
44 & 0.83742202052205 & 0.3251559589559 & 0.16257797947795 \tabularnewline
45 & 0.937655540711902 & 0.124688918576197 & 0.0623444592880983 \tabularnewline
46 & 0.976509151545501 & 0.046981696908998 & 0.023490848454499 \tabularnewline
47 & 0.993615423403953 & 0.0127691531920945 & 0.00638457659604725 \tabularnewline
48 & 0.99856249020003 & 0.00287501959993828 & 0.00143750979996914 \tabularnewline
49 & 0.9994029772085 & 0.00119404558300074 & 0.000597022791500372 \tabularnewline
50 & 0.999081841963989 & 0.00183631607202282 & 0.00091815803601141 \tabularnewline
51 & 0.999376641188434 & 0.00124671762313217 & 0.000623358811566083 \tabularnewline
52 & 0.999123334236003 & 0.00175333152799383 & 0.000876665763996913 \tabularnewline
53 & 0.998479333619903 & 0.00304133276019417 & 0.00152066638009709 \tabularnewline
54 & 0.996089400359724 & 0.0078211992805516 & 0.0039105996402758 \tabularnewline
55 & 0.989146064367052 & 0.0217078712658969 & 0.0108539356329485 \tabularnewline
56 & 0.967898957607142 & 0.0642020847857151 & 0.0321010423928576 \tabularnewline
57 & 0.938083719583527 & 0.123832560832946 & 0.061916280416473 \tabularnewline
\hline
\end{tabular}
%Source: https://freestatistics.org/blog/index.php?pk=25208&T=5

[TABLE]
[ROW][C]Goldfeld-Quandt test for Heteroskedasticity[/C][/ROW]
[ROW][C]p-values[/C][C]Alternative Hypothesis[/C][/ROW]
[ROW][C]breakpoint index[/C][C]greater[/C][C]2-sided[/C][C]less[/C][/ROW]
[ROW][C]17[/C][C]0.332099296865484[/C][C]0.664198593730967[/C][C]0.667900703134516[/C][/ROW]
[ROW][C]18[/C][C]0.331692696043308[/C][C]0.663385392086616[/C][C]0.668307303956692[/C][/ROW]
[ROW][C]19[/C][C]0.261981552526556[/C][C]0.523963105053111[/C][C]0.738018447473444[/C][/ROW]
[ROW][C]20[/C][C]0.26157589472784[/C][C]0.52315178945568[/C][C]0.73842410527216[/C][/ROW]
[ROW][C]21[/C][C]0.180573844143670[/C][C]0.361147688287340[/C][C]0.81942615585633[/C][/ROW]
[ROW][C]22[/C][C]0.125520163027010[/C][C]0.251040326054021[/C][C]0.87447983697299[/C][/ROW]
[ROW][C]23[/C][C]0.0939288212562365[/C][C]0.187857642512473[/C][C]0.906071178743764[/C][/ROW]
[ROW][C]24[/C][C]0.0657753440149032[/C][C]0.131550688029806[/C][C]0.934224655985097[/C][/ROW]
[ROW][C]25[/C][C]0.039834319354102[/C][C]0.079668638708204[/C][C]0.960165680645898[/C][/ROW]
[ROW][C]26[/C][C]0.0251928516003289[/C][C]0.0503857032006579[/C][C]0.974807148399671[/C][/ROW]
[ROW][C]27[/C][C]0.0154162766541761[/C][C]0.0308325533083521[/C][C]0.984583723345824[/C][/ROW]
[ROW][C]28[/C][C]0.0125819275878277[/C][C]0.0251638551756555[/C][C]0.987418072412172[/C][/ROW]
[ROW][C]29[/C][C]0.0101716790796142[/C][C]0.0203433581592284[/C][C]0.989828320920386[/C][/ROW]
[ROW][C]30[/C][C]0.00536511688209149[/C][C]0.0107302337641830[/C][C]0.994634883117908[/C][/ROW]
[ROW][C]31[/C][C]0.00349905459732725[/C][C]0.00699810919465449[/C][C]0.996500945402673[/C][/ROW]
[ROW][C]32[/C][C]0.00668486024956251[/C][C]0.0133697204991250[/C][C]0.993315139750438[/C][/ROW]
[ROW][C]33[/C][C]0.0106706225695262[/C][C]0.0213412451390524[/C][C]0.989329377430474[/C][/ROW]
[ROW][C]34[/C][C]0.0111712995741207[/C][C]0.0223425991482414[/C][C]0.98882870042588[/C][/ROW]
[ROW][C]35[/C][C]0.0070501482821289[/C][C]0.0141002965642578[/C][C]0.992949851717871[/C][/ROW]
[ROW][C]36[/C][C]0.00547204012290127[/C][C]0.0109440802458025[/C][C]0.994527959877099[/C][/ROW]
[ROW][C]37[/C][C]0.00592851637687016[/C][C]0.0118570327537403[/C][C]0.99407148362313[/C][/ROW]
[ROW][C]38[/C][C]0.00408966765431634[/C][C]0.00817933530863268[/C][C]0.995910332345684[/C][/ROW]
[ROW][C]39[/C][C]0.00804989540243211[/C][C]0.0160997908048642[/C][C]0.991950104597568[/C][/ROW]
[ROW][C]40[/C][C]0.0164423551205603[/C][C]0.0328847102411206[/C][C]0.98355764487944[/C][/ROW]
[ROW][C]41[/C][C]0.0476934720980804[/C][C]0.0953869441961608[/C][C]0.95230652790192[/C][/ROW]
[ROW][C]42[/C][C]0.218374085991575[/C][C]0.436748171983151[/C][C]0.781625914008425[/C][/ROW]
[ROW][C]43[/C][C]0.576026252370589[/C][C]0.847947495258822[/C][C]0.423973747629411[/C][/ROW]
[ROW][C]44[/C][C]0.83742202052205[/C][C]0.3251559589559[/C][C]0.16257797947795[/C][/ROW]
[ROW][C]45[/C][C]0.937655540711902[/C][C]0.124688918576197[/C][C]0.0623444592880983[/C][/ROW]
[ROW][C]46[/C][C]0.976509151545501[/C][C]0.046981696908998[/C][C]0.023490848454499[/C][/ROW]
[ROW][C]47[/C][C]0.993615423403953[/C][C]0.0127691531920945[/C][C]0.00638457659604725[/C][/ROW]
[ROW][C]48[/C][C]0.99856249020003[/C][C]0.00287501959993828[/C][C]0.00143750979996914[/C][/ROW]
[ROW][C]49[/C][C]0.9994029772085[/C][C]0.00119404558300074[/C][C]0.000597022791500372[/C][/ROW]
[ROW][C]50[/C][C]0.999081841963989[/C][C]0.00183631607202282[/C][C]0.00091815803601141[/C][/ROW]
[ROW][C]51[/C][C]0.999376641188434[/C][C]0.00124671762313217[/C][C]0.000623358811566083[/C][/ROW]
[ROW][C]52[/C][C]0.999123334236003[/C][C]0.00175333152799383[/C][C]0.000876665763996913[/C][/ROW]
[ROW][C]53[/C][C]0.998479333619903[/C][C]0.00304133276019417[/C][C]0.00152066638009709[/C][/ROW]
[ROW][C]54[/C][C]0.996089400359724[/C][C]0.0078211992805516[/C][C]0.0039105996402758[/C][/ROW]
[ROW][C]55[/C][C]0.989146064367052[/C][C]0.0217078712658969[/C][C]0.0108539356329485[/C][/ROW]
[ROW][C]56[/C][C]0.967898957607142[/C][C]0.0642020847857151[/C][C]0.0321010423928576[/C][/ROW]
[ROW][C]57[/C][C]0.938083719583527[/C][C]0.123832560832946[/C][C]0.061916280416473[/C][/ROW]
[/TABLE]
Source: https://freestatistics.org/blog/index.php?pk=25208&T=5

Globally Unique Identifier (entire table): ba.freestatistics.org/blog/index.php?pk=25208&T=5

As an alternative you can also use a QR Code:  

The GUIDs for individual cells are displayed in the table below:

Goldfeld-Quandt test for Heteroskedasticity
p-valuesAlternative Hypothesis
breakpoint indexgreater2-sidedless
170.3320992968654840.6641985937309670.667900703134516
180.3316926960433080.6633853920866160.668307303956692
190.2619815525265560.5239631050531110.738018447473444
200.261575894727840.523151789455680.73842410527216
210.1805738441436700.3611476882873400.81942615585633
220.1255201630270100.2510403260540210.87447983697299
230.09392882125623650.1878576425124730.906071178743764
240.06577534401490320.1315506880298060.934224655985097
250.0398343193541020.0796686387082040.960165680645898
260.02519285160032890.05038570320065790.974807148399671
270.01541627665417610.03083255330835210.984583723345824
280.01258192758782770.02516385517565550.987418072412172
290.01017167907961420.02034335815922840.989828320920386
300.005365116882091490.01073023376418300.994634883117908
310.003499054597327250.006998109194654490.996500945402673
320.006684860249562510.01336972049912500.993315139750438
330.01067062256952620.02134124513905240.989329377430474
340.01117129957412070.02234259914824140.98882870042588
350.00705014828212890.01410029656425780.992949851717871
360.005472040122901270.01094408024580250.994527959877099
370.005928516376870160.01185703275374030.99407148362313
380.004089667654316340.008179335308632680.995910332345684
390.008049895402432110.01609979080486420.991950104597568
400.01644235512056030.03288471024112060.98355764487944
410.04769347209808040.09538694419616080.95230652790192
420.2183740859915750.4367481719831510.781625914008425
430.5760262523705890.8479474952588220.423973747629411
440.837422020522050.32515595895590.16257797947795
450.9376555407119020.1246889185761970.0623444592880983
460.9765091515455010.0469816969089980.023490848454499
470.9936154234039530.01276915319209450.00638457659604725
480.998562490200030.002875019599938280.00143750979996914
490.99940297720850.001194045583000740.000597022791500372
500.9990818419639890.001836316072022820.00091815803601141
510.9993766411884340.001246717623132170.000623358811566083
520.9991233342360030.001753331527993830.000876665763996913
530.9984793336199030.003041332760194170.00152066638009709
540.9960894003597240.00782119928055160.0039105996402758
550.9891460643670520.02170787126589690.0108539356329485
560.9678989576071420.06420208478571510.0321010423928576
570.9380837195835270.1238325608329460.061916280416473


Meta Analysis of Goldfeld-Quandt test for Heteroskedasticity
Description# significant tests% significant testsOK/NOK
1% type I error level90.219512195121951NOK
5% type I error level240.585365853658537NOK
10% type I error level280.682926829268293NOK

\begin{tabular}{lllllllll}
\hline
Meta Analysis of Goldfeld-Quandt test for Heteroskedasticity \tabularnewline
Description & # significant tests & % significant tests & OK/NOK \tabularnewline
1% type I error level & 9 & 0.219512195121951 & NOK \tabularnewline
5% type I error level & 24 & 0.585365853658537 & NOK \tabularnewline
10% type I error level & 28 & 0.682926829268293 & NOK \tabularnewline
\hline
\end{tabular}
%Source: https://freestatistics.org/blog/index.php?pk=25208&T=6

[TABLE]
[ROW][C]Meta Analysis of Goldfeld-Quandt test for Heteroskedasticity[/C][/ROW]
[ROW][C]Description[/C][C]# significant tests[/C][C]% significant tests[/C][C]OK/NOK[/C][/ROW]
[ROW][C]1% type I error level[/C][C]9[/C][C]0.219512195121951[/C][C]NOK[/C][/ROW]
[ROW][C]5% type I error level[/C][C]24[/C][C]0.585365853658537[/C][C]NOK[/C][/ROW]
[ROW][C]10% type I error level[/C][C]28[/C][C]0.682926829268293[/C][C]NOK[/C][/ROW]
[/TABLE]
Source: https://freestatistics.org/blog/index.php?pk=25208&T=6

Globally Unique Identifier (entire table): ba.freestatistics.org/blog/index.php?pk=25208&T=6

As an alternative you can also use a QR Code:  

The GUIDs for individual cells are displayed in the table below:

Meta Analysis of Goldfeld-Quandt test for Heteroskedasticity
Description# significant tests% significant testsOK/NOK
1% type I error level90.219512195121951NOK
5% type I error level240.585365853658537NOK
10% type I error level280.682926829268293NOK


Parameters (Session):
par1 = 1 ; par2 = Include Monthly Dummies ; par3 = Linear Trend ;
Parameters (R input):
par1 = 1 ; par2 = Include Monthly Dummies ; par3 = Linear Trend ;
R code (references can be found in the software module):
library(lattice)
library(lmtest)
n25 <- 25 #minimum number of obs. for Goldfeld-Quandt test
par1 <- as.numeric(par1)
x <- t(y)
k <- length(x[1,])
n <- length(x[,1])
x1 <- cbind(x[,par1], x[,1:k!=par1])
mycolnames <- c(colnames(x)[par1], colnames(x)[1:k!=par1])
colnames(x1) <- mycolnames #colnames(x)[par1]
x <- x1
if (par3 == 'First Differences'){
x2 <- array(0, dim=c(n-1,k), dimnames=list(1:(n-1), paste('(1-B)',colnames(x),sep='')))
for (i in 1:n-1) {
for (j in 1:k) {
x2[i,j] <- x[i+1,j] - x[i,j]
}
}
x <- x2
}
if (par2 == 'Include Monthly Dummies'){
x2 <- array(0, dim=c(n,11), dimnames=list(1:n, paste('M', seq(1:11), sep ='')))
for (i in 1:11){
x2[seq(i,n,12),i] <- 1
}
x <- cbind(x, x2)
}
if (par2 == 'Include Quarterly Dummies'){
x2 <- array(0, dim=c(n,3), dimnames=list(1:n, paste('Q', seq(1:3), sep ='')))
for (i in 1:3){
x2[seq(i,n,4),i] <- 1
}
x <- cbind(x, x2)
}
k <- length(x[1,])
if (par3 == 'Linear Trend'){
x <- cbind(x, c(1:n))
colnames(x)[k+1] <- 't'
}
x
k <- length(x[1,])
df <- as.data.frame(x)
(mylm <- lm(df))
(mysum <- summary(mylm))
if (n > n25) {
kp3 <- k + 3
nmkm3 <- n - k - 3
gqarr <- array(NA, dim=c(nmkm3-kp3+1,3))
numgqtests <- 0
numsignificant1 <- 0
numsignificant5 <- 0
numsignificant10 <- 0
for (mypoint in kp3:nmkm3) {
j <- 0
numgqtests <- numgqtests + 1
for (myalt in c('greater', 'two.sided', 'less')) {
j <- j + 1
gqarr[mypoint-kp3+1,j] <- gqtest(mylm, point=mypoint, alternative=myalt)$p.value
}
if (gqarr[mypoint-kp3+1,2] < 0.01) numsignificant1 <- numsignificant1 + 1
if (gqarr[mypoint-kp3+1,2] < 0.05) numsignificant5 <- numsignificant5 + 1
if (gqarr[mypoint-kp3+1,2] < 0.10) numsignificant10 <- numsignificant10 + 1
}
gqarr
}
bitmap(file='test0.png')
plot(x[,1], type='l', main='Actuals and Interpolation', ylab='value of Actuals and Interpolation (dots)', xlab='time or index')
points(x[,1]-mysum$resid)
grid()
dev.off()
bitmap(file='test1.png')
plot(mysum$resid, type='b', pch=19, main='Residuals', ylab='value of Residuals', xlab='time or index')
grid()
dev.off()
bitmap(file='test2.png')
hist(mysum$resid, main='Residual Histogram', xlab='values of Residuals')
grid()
dev.off()
bitmap(file='test3.png')
densityplot(~mysum$resid,col='black',main='Residual Density Plot', xlab='values of Residuals')
dev.off()
bitmap(file='test4.png')
qqnorm(mysum$resid, main='Residual Normal Q-Q Plot')
qqline(mysum$resid)
grid()
dev.off()
(myerror <- as.ts(mysum$resid))
bitmap(file='test5.png')
dum <- cbind(lag(myerror,k=1),myerror)
dum
dum1 <- dum[2:length(myerror),]
dum1
z <- as.data.frame(dum1)
z
plot(z,main=paste('Residual Lag plot, lowess, and regression line'), ylab='values of Residuals', xlab='lagged values of Residuals')
lines(lowess(z))
abline(lm(z))
grid()
dev.off()
bitmap(file='test6.png')
acf(mysum$resid, lag.max=length(mysum$resid)/2, main='Residual Autocorrelation Function')
grid()
dev.off()
bitmap(file='test7.png')
pacf(mysum$resid, lag.max=length(mysum$resid)/2, main='Residual Partial Autocorrelation Function')
grid()
dev.off()
bitmap(file='test8.png')
opar <- par(mfrow = c(2,2), oma = c(0, 0, 1.1, 0))
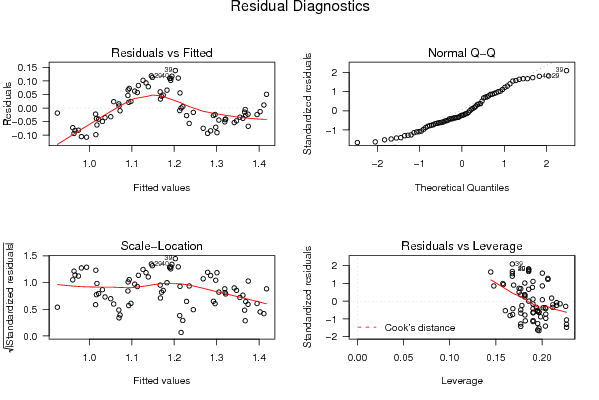
plot(mylm, las = 1, sub='Residual Diagnostics')
par(opar)
dev.off()
if (n > n25) {
bitmap(file='test9.png')
plot(kp3:nmkm3,gqarr[,2], main='Goldfeld-Quandt test',ylab='2-sided p-value',xlab='breakpoint')
grid()
dev.off()
}
load(file='createtable')
a<-table.start()
a<-table.row.start(a)
a<-table.element(a, 'Multiple Linear Regression - Estimated Regression Equation', 1, TRUE)
a<-table.row.end(a)
myeq <- colnames(x)[1]
myeq <- paste(myeq, '[t] = ', sep='')
for (i in 1:k){
if (mysum$coefficients[i,1] > 0) myeq <- paste(myeq, '+', '')
myeq <- paste(myeq, mysum$coefficients[i,1], sep=' ')
if (rownames(mysum$coefficients)[i] != '(Intercept)') {
myeq <- paste(myeq, rownames(mysum$coefficients)[i], sep='')
if (rownames(mysum$coefficients)[i] != 't') myeq <- paste(myeq, '[t]', sep='')
}
}
myeq <- paste(myeq, ' + e[t]')
a<-table.row.start(a)
a<-table.element(a, myeq)
a<-table.row.end(a)
a<-table.end(a)
table.save(a,file='mytable1.tab')
a<-table.start()
a<-table.row.start(a)
a<-table.element(a,hyperlink('ols1.htm','Multiple Linear Regression - Ordinary Least Squares',''), 6, TRUE)
a<-table.row.end(a)
a<-table.row.start(a)
a<-table.element(a,'Variable',header=TRUE)
a<-table.element(a,'Parameter',header=TRUE)
a<-table.element(a,'S.D.',header=TRUE)
a<-table.element(a,'T-STAT
H0: parameter = 0',header=TRUE)
a<-table.element(a,'2-tail p-value',header=TRUE)
a<-table.element(a,'1-tail p-value',header=TRUE)
a<-table.row.end(a)
for (i in 1:k){
a<-table.row.start(a)
a<-table.element(a,rownames(mysum$coefficients)[i],header=TRUE)
a<-table.element(a,mysum$coefficients[i,1])
a<-table.element(a, round(mysum$coefficients[i,2],6))
a<-table.element(a, round(mysum$coefficients[i,3],4))
a<-table.element(a, round(mysum$coefficients[i,4],6))
a<-table.element(a, round(mysum$coefficients[i,4]/2,6))
a<-table.row.end(a)
}
a<-table.end(a)
table.save(a,file='mytable2.tab')
a<-table.start()
a<-table.row.start(a)
a<-table.element(a, 'Multiple Linear Regression - Regression Statistics', 2, TRUE)
a<-table.row.end(a)
a<-table.row.start(a)
a<-table.element(a, 'Multiple R',1,TRUE)
a<-table.element(a, sqrt(mysum$r.squared))
a<-table.row.end(a)
a<-table.row.start(a)
a<-table.element(a, 'R-squared',1,TRUE)
a<-table.element(a, mysum$r.squared)
a<-table.row.end(a)
a<-table.row.start(a)
a<-table.element(a, 'Adjusted R-squared',1,TRUE)
a<-table.element(a, mysum$adj.r.squared)
a<-table.row.end(a)
a<-table.row.start(a)
a<-table.element(a, 'F-TEST (value)',1,TRUE)
a<-table.element(a, mysum$fstatistic[1])
a<-table.row.end(a)
a<-table.row.start(a)
a<-table.element(a, 'F-TEST (DF numerator)',1,TRUE)
a<-table.element(a, mysum$fstatistic[2])
a<-table.row.end(a)
a<-table.row.start(a)
a<-table.element(a, 'F-TEST (DF denominator)',1,TRUE)
a<-table.element(a, mysum$fstatistic[3])
a<-table.row.end(a)
a<-table.row.start(a)
a<-table.element(a, 'p-value',1,TRUE)
a<-table.element(a, 1-pf(mysum$fstatistic[1],mysum$fstatistic[2],mysum$fstatistic[3]))
a<-table.row.end(a)
a<-table.row.start(a)
a<-table.element(a, 'Multiple Linear Regression - Residual Statistics', 2, TRUE)
a<-table.row.end(a)
a<-table.row.start(a)
a<-table.element(a, 'Residual Standard Deviation',1,TRUE)
a<-table.element(a, mysum$sigma)
a<-table.row.end(a)
a<-table.row.start(a)
a<-table.element(a, 'Sum Squared Residuals',1,TRUE)
a<-table.element(a, sum(myerror*myerror))
a<-table.row.end(a)
a<-table.end(a)
table.save(a,file='mytable3.tab')
a<-table.start()
a<-table.row.start(a)
a<-table.element(a, 'Multiple Linear Regression - Actuals, Interpolation, and Residuals', 4, TRUE)
a<-table.row.end(a)
a<-table.row.start(a)
a<-table.element(a, 'Time or Index', 1, TRUE)
a<-table.element(a, 'Actuals', 1, TRUE)
a<-table.element(a, 'Interpolation
Forecast', 1, TRUE)
a<-table.element(a, 'Residuals
Prediction Error', 1, TRUE)
a<-table.row.end(a)
for (i in 1:n) {
a<-table.row.start(a)
a<-table.element(a,i, 1, TRUE)
a<-table.element(a,x[i])
a<-table.element(a,x[i]-mysum$resid[i])
a<-table.element(a,mysum$resid[i])
a<-table.row.end(a)
}
a<-table.end(a)
table.save(a,file='mytable4.tab')
if (n > n25) {
a<-table.start()
a<-table.row.start(a)
a<-table.element(a,'Goldfeld-Quandt test for Heteroskedasticity',4,TRUE)
a<-table.row.end(a)
a<-table.row.start(a)
a<-table.element(a,'p-values',header=TRUE)
a<-table.element(a,'Alternative Hypothesis',3,header=TRUE)
a<-table.row.end(a)
a<-table.row.start(a)
a<-table.element(a,'breakpoint index',header=TRUE)
a<-table.element(a,'greater',header=TRUE)
a<-table.element(a,'2-sided',header=TRUE)
a<-table.element(a,'less',header=TRUE)
a<-table.row.end(a)
for (mypoint in kp3:nmkm3) {
a<-table.row.start(a)
a<-table.element(a,mypoint,header=TRUE)
a<-table.element(a,gqarr[mypoint-kp3+1,1])
a<-table.element(a,gqarr[mypoint-kp3+1,2])
a<-table.element(a,gqarr[mypoint-kp3+1,3])
a<-table.row.end(a)
}
a<-table.end(a)
table.save(a,file='mytable5.tab')
a<-table.start()
a<-table.row.start(a)
a<-table.element(a,'Meta Analysis of Goldfeld-Quandt test for Heteroskedasticity',4,TRUE)
a<-table.row.end(a)
a<-table.row.start(a)
a<-table.element(a,'Description',header=TRUE)
a<-table.element(a,'# significant tests',header=TRUE)
a<-table.element(a,'% significant tests',header=TRUE)
a<-table.element(a,'OK/NOK',header=TRUE)
a<-table.row.end(a)
a<-table.row.start(a)
a<-table.element(a,'1% type I error level',header=TRUE)
a<-table.element(a,numsignificant1)
a<-table.element(a,numsignificant1/numgqtests)
if (numsignificant1/numgqtests < 0.01) dum <- 'OK' else dum <- 'NOK'
a<-table.element(a,dum)
a<-table.row.end(a)
a<-table.row.start(a)
a<-table.element(a,'5% type I error level',header=TRUE)
a<-table.element(a,numsignificant5)
a<-table.element(a,numsignificant5/numgqtests)
if (numsignificant5/numgqtests < 0.05) dum <- 'OK' else dum <- 'NOK'
a<-table.element(a,dum)
a<-table.row.end(a)
a<-table.row.start(a)
a<-table.element(a,'10% type I error level',header=TRUE)
a<-table.element(a,numsignificant10)
a<-table.element(a,numsignificant10/numgqtests)
if (numsignificant10/numgqtests < 0.1) dum <- 'OK' else dum <- 'NOK'
a<-table.element(a,dum)
a<-table.row.end(a)
a<-table.end(a)
table.save(a,file='mytable6.tab')
}