Free Statistics

of Irreproducible Research!

Author's title

Author*The author of this computation has been verified*
R Software Modulerwasp_multipleregression.wasp
Title produced by softwareMultiple Regression
Date of computationSat, 22 Nov 2008 08:47:21 -0700
Cite this page as followsStatistical Computations at FreeStatistics.org, Office for Research Development and Education, URL https://freestatistics.org/blog/index.php?v=date/2008/Nov/22/t12273688786b8o7qnfksphvoh.htm/, Retrieved Sun, 19 May 2024 11:33:56 +0000
Statistical Computations at FreeStatistics.org, Office for Research Development and Education, URL https://freestatistics.org/blog/index.php?pk=25196, Retrieved Sun, 19 May 2024 11:33:56 +0000
QR Codes:

Original text written by user:
IsPrivate?No (this computation is public)
User-defined keywords
Estimated Impact198
Family? (F = Feedback message, R = changed R code, M = changed R Module, P = changed Parameters, D = changed Data)
F       [Multiple Regression] [Q3 - Bob Leysen -...] [2008-11-22 15:47:21] [0831954c833179c36e9320daee0825b5] [Current]
-   P     [Multiple Regression] [Q3 - Bob Leysen -...] [2008-11-22 15:53:14] [57850c80fd59ccfb28f882be994e814e]
F   P       [Multiple Regression] [Q3 - Bob Leysen -...] [2008-11-22 15:57:05] [57850c80fd59ccfb28f882be994e814e]
Feedback Forum
2008-11-27 18:53:21 [Bob Leysen] [reply
Correct.

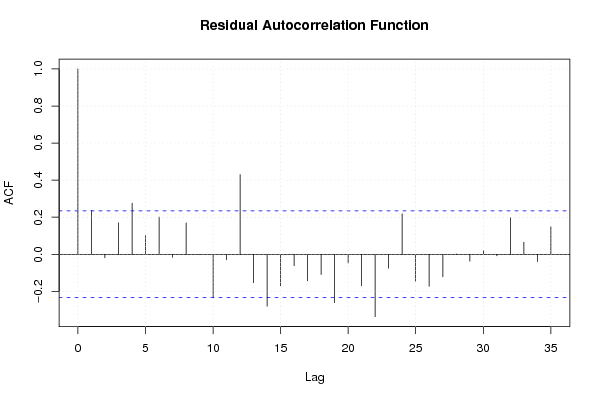
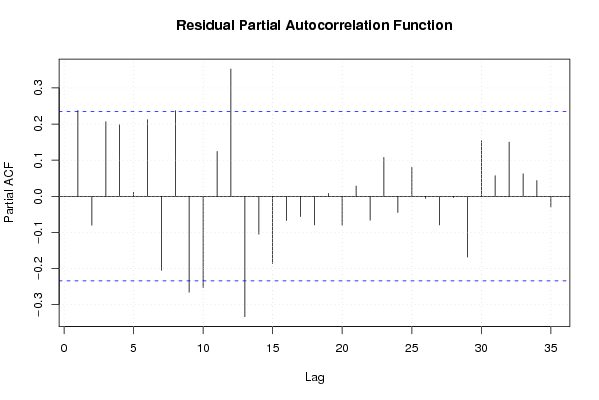
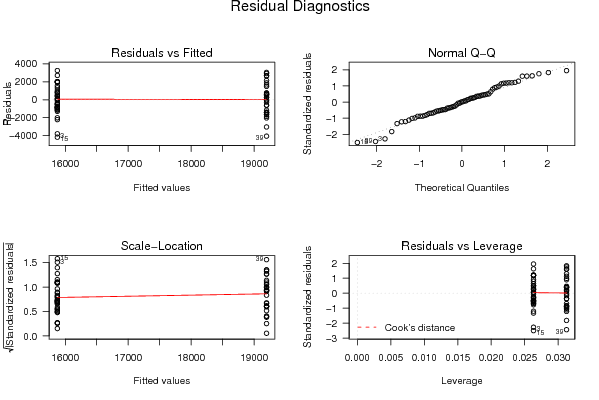
Zoals in Q1 zijn er duidelijke verschillen met of zonder dummies en lineaire trend.

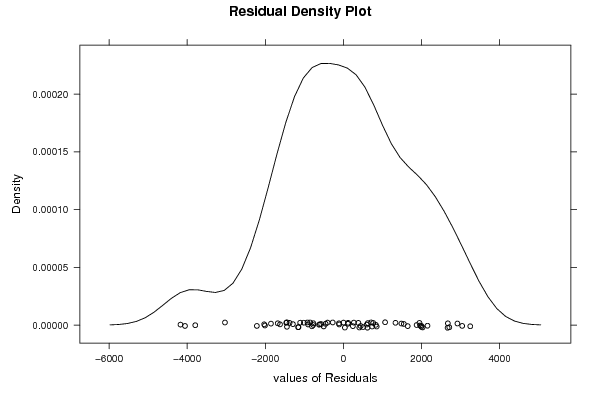
Op de density plot is er meer symmetrie als we seasonaliteit en een lineaire trend toelaten.

Op de QQ-plot liggen de punten niet op de rechte en dit is meer het geval met seasonalitieit en trend.

Zonder seasonaliteit en lineaire trend is er op de residual histogram een meer rechtse verdeling. Met seasonaliteit en trend is deze meer links

De R-squared wordt ook hoger met seasonaliteit en trend, dit is het percentage dat aantoont hoeveel procent van de schommelingen te verklaren is.

Post a new message
Dataseries X:
15107	0
15024	0
12083	0
15761	0
16943	0
15070	0
13660	0
14769	0
14725	0
15998	0
15371	0
14957	0
15470	0
15102	0
11704	0
16284	0
16727	0
14969	0
14861	0
14583	0
15306	0
17904	0
16379	0
15420	0
17871	0
15913	0
13867	0
17823	0
17872	0
17422	0
16705	0
15991	0
16584	0
19124	0
17839	0
17209	0
18587	0
16258	0
15142	1
19202	1
17747	1
19090	1
18040	1
17516	1
17752	1
21073	1
17170	1
19440	1
19795	1
17575	1
16165	1
19465	1
19932	1
19961	1
17343	1
18924	1
18574	1
21351	1
18595	1
19823	1
20844	1
19640	1
17735	1
19814	1
22239	1
20682	1
17819	1
21872	1
22117	1
21866	1


Summary of computational transaction
Raw Inputview raw input (R code)
Raw Outputview raw output of R engine
Computing time4 seconds
R Server'George Udny Yule' @ 72.249.76.132

\begin{tabular}{lllllllll}
\hline
Summary of computational transaction \tabularnewline
Raw Input & view raw input (R code)  \tabularnewline
Raw Output & view raw output of R engine  \tabularnewline
Computing time & 4 seconds \tabularnewline
R Server & 'George Udny Yule' @ 72.249.76.132 \tabularnewline
\hline
\end{tabular}
%Source: https://freestatistics.org/blog/index.php?pk=25196&T=0

[TABLE]
[ROW][C]Summary of computational transaction[/C][/ROW]
[ROW][C]Raw Input[/C][C]view raw input (R code) [/C][/ROW]
[ROW][C]Raw Output[/C][C]view raw output of R engine [/C][/ROW]
[ROW][C]Computing time[/C][C]4 seconds[/C][/ROW]
[ROW][C]R Server[/C][C]'George Udny Yule' @ 72.249.76.132[/C][/ROW]
[/TABLE]
Source: https://freestatistics.org/blog/index.php?pk=25196&T=0

Globally Unique Identifier (entire table): ba.freestatistics.org/blog/index.php?pk=25196&T=0

As an alternative you can also use a QR Code:  

The GUIDs for individual cells are displayed in the table below:

Summary of computational transaction
Raw Inputview raw input (R code)
Raw Outputview raw output of R engine
Computing time4 seconds
R Server'George Udny Yule' @ 72.249.76.132


Multiple Linear Regression - Estimated Regression Equation
x[t] = + 15874.7894736842 + 3322.17927631579y[t] + e[t]

\begin{tabular}{lllllllll}
\hline
Multiple Linear Regression - Estimated Regression Equation \tabularnewline
x[t] =  +  15874.7894736842 +  3322.17927631579y[t]  + e[t] \tabularnewline
\hline
\end{tabular}
%Source: https://freestatistics.org/blog/index.php?pk=25196&T=1

[TABLE]
[ROW][C]Multiple Linear Regression - Estimated Regression Equation[/C][/ROW]
[ROW][C]x[t] =  +  15874.7894736842 +  3322.17927631579y[t]  + e[t][/C][/ROW]
[/TABLE]
Source: https://freestatistics.org/blog/index.php?pk=25196&T=1

Globally Unique Identifier (entire table): ba.freestatistics.org/blog/index.php?pk=25196&T=1

As an alternative you can also use a QR Code:  

The GUIDs for individual cells are displayed in the table below:

Multiple Linear Regression - Estimated Regression Equation
x[t] = + 15874.7894736842 + 3322.17927631579y[t] + e[t]


Multiple Linear Regression - Ordinary Least Squares
VariableParameterS.D.T-STATH0: parameter = 02-tail p-value1-tail p-value
(Intercept)15874.7894736842273.56571958.029200
y3322.17927631579404.6091558.210800

\begin{tabular}{lllllllll}
\hline
Multiple Linear Regression - Ordinary Least Squares \tabularnewline
Variable & Parameter & S.D. & T-STATH0: parameter = 0 & 2-tail p-value & 1-tail p-value \tabularnewline
(Intercept) & 15874.7894736842 & 273.565719 & 58.0292 & 0 & 0 \tabularnewline
y & 3322.17927631579 & 404.609155 & 8.2108 & 0 & 0 \tabularnewline
\hline
\end{tabular}
%Source: https://freestatistics.org/blog/index.php?pk=25196&T=2

[TABLE]
[ROW][C]Multiple Linear Regression - Ordinary Least Squares[/C][/ROW]
[ROW][C]Variable[/C][C]Parameter[/C][C]S.D.[/C][C]T-STATH0: parameter = 0[/C][C]2-tail p-value[/C][C]1-tail p-value[/C][/ROW]
[ROW][C](Intercept)[/C][C]15874.7894736842[/C][C]273.565719[/C][C]58.0292[/C][C]0[/C][C]0[/C][/ROW]
[ROW][C]y[/C][C]3322.17927631579[/C][C]404.609155[/C][C]8.2108[/C][C]0[/C][C]0[/C][/ROW]
[/TABLE]
Source: https://freestatistics.org/blog/index.php?pk=25196&T=2

Globally Unique Identifier (entire table): ba.freestatistics.org/blog/index.php?pk=25196&T=2

As an alternative you can also use a QR Code:  

The GUIDs for individual cells are displayed in the table below:

Multiple Linear Regression - Ordinary Least Squares
VariableParameterS.D.T-STATH0: parameter = 02-tail p-value1-tail p-value
(Intercept)15874.7894736842273.56571958.029200
y3322.17927631579404.6091558.210800


Multiple Linear Regression - Regression Statistics
Multiple R0.705585174947096
R-squared0.497850439105124
Adjusted R-squared0.490465886739023
F-TEST (value)67.4178222894746
F-TEST (DF numerator)1
F-TEST (DF denominator)68
p-value9.07429686947125e-12
Multiple Linear Regression - Residual Statistics
Residual Standard Deviation1686.37234778114
Sum Squared Residuals193381915.284540

\begin{tabular}{lllllllll}
\hline
Multiple Linear Regression - Regression Statistics \tabularnewline
Multiple R & 0.705585174947096 \tabularnewline
R-squared & 0.497850439105124 \tabularnewline
Adjusted R-squared & 0.490465886739023 \tabularnewline
F-TEST (value) & 67.4178222894746 \tabularnewline
F-TEST (DF numerator) & 1 \tabularnewline
F-TEST (DF denominator) & 68 \tabularnewline
p-value & 9.07429686947125e-12 \tabularnewline
Multiple Linear Regression - Residual Statistics \tabularnewline
Residual Standard Deviation & 1686.37234778114 \tabularnewline
Sum Squared Residuals & 193381915.284540 \tabularnewline
\hline
\end{tabular}
%Source: https://freestatistics.org/blog/index.php?pk=25196&T=3

[TABLE]
[ROW][C]Multiple Linear Regression - Regression Statistics[/C][/ROW]
[ROW][C]Multiple R[/C][C]0.705585174947096[/C][/ROW]
[ROW][C]R-squared[/C][C]0.497850439105124[/C][/ROW]
[ROW][C]Adjusted R-squared[/C][C]0.490465886739023[/C][/ROW]
[ROW][C]F-TEST (value)[/C][C]67.4178222894746[/C][/ROW]
[ROW][C]F-TEST (DF numerator)[/C][C]1[/C][/ROW]
[ROW][C]F-TEST (DF denominator)[/C][C]68[/C][/ROW]
[ROW][C]p-value[/C][C]9.07429686947125e-12[/C][/ROW]
[ROW][C]Multiple Linear Regression - Residual Statistics[/C][/ROW]
[ROW][C]Residual Standard Deviation[/C][C]1686.37234778114[/C][/ROW]
[ROW][C]Sum Squared Residuals[/C][C]193381915.284540[/C][/ROW]
[/TABLE]
Source: https://freestatistics.org/blog/index.php?pk=25196&T=3

Globally Unique Identifier (entire table): ba.freestatistics.org/blog/index.php?pk=25196&T=3

As an alternative you can also use a QR Code:  

The GUIDs for individual cells are displayed in the table below:

Multiple Linear Regression - Regression Statistics
Multiple R0.705585174947096
R-squared0.497850439105124
Adjusted R-squared0.490465886739023
F-TEST (value)67.4178222894746
F-TEST (DF numerator)1
F-TEST (DF denominator)68
p-value9.07429686947125e-12
Multiple Linear Regression - Residual Statistics
Residual Standard Deviation1686.37234778114
Sum Squared Residuals193381915.284540


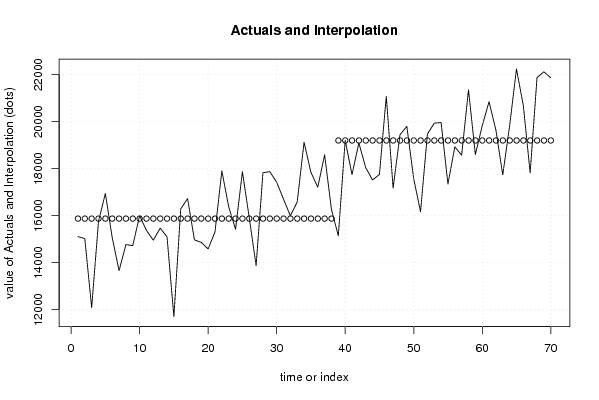
Multiple Linear Regression - Actuals, Interpolation, and Residuals
Time or IndexActualsInterpolationForecastResidualsPrediction Error
11510715874.7894736842-767.789473684233
21502415874.7894736842-850.789473684208
31208315874.7894736842-3791.78947368421
41576115874.7894736842-113.78947368421
51694315874.78947368421068.21052631579
61507015874.7894736842-804.78947368421
71366015874.7894736842-2214.78947368421
81476915874.7894736842-1105.78947368421
91472515874.7894736842-1149.78947368421
101599815874.7894736842123.21052631579
111537115874.7894736842-503.78947368421
121495715874.7894736842-917.78947368421
131547015874.7894736842-404.78947368421
141510215874.7894736842-772.78947368421
151170415874.7894736842-4170.78947368421
161628415874.7894736842409.21052631579
171672715874.7894736842852.21052631579
181496915874.7894736842-905.78947368421
191486115874.7894736842-1013.78947368421
201458315874.7894736842-1291.78947368421
211530615874.7894736842-568.78947368421
221790415874.78947368422029.21052631579
231637915874.7894736842504.21052631579
241542015874.7894736842-454.78947368421
251787115874.78947368421996.21052631579
261591315874.789473684238.21052631579
271386715874.7894736842-2007.78947368421
281782315874.78947368421948.21052631579
291787215874.78947368421997.21052631579
301742215874.78947368421547.21052631579
311670515874.7894736842830.21052631579
321599115874.7894736842116.21052631579
331658415874.7894736842709.21052631579
341912415874.78947368423249.21052631579
351783915874.78947368421964.21052631579
361720915874.78947368421334.21052631579
371858715874.78947368422712.21052631579
381625815874.7894736842383.21052631579
391514219196.96875-4054.96875
401920219196.968755.03124999999999
411774719196.96875-1449.96875
421909019196.96875-106.96875
431804019196.96875-1156.96875
441751619196.96875-1680.96875
451775219196.96875-1444.96875
462107319196.968751876.03125
471717019196.96875-2026.96875
481944019196.96875243.03125
491979519196.96875598.03125
501757519196.96875-1621.96875
511616519196.96875-3031.96875
521946519196.96875268.03125
531993219196.96875735.03125
541996119196.96875764.03125
551734319196.96875-1853.96875
561892419196.96875-272.96875
571857419196.96875-622.96875
582135119196.968752154.03125
591859519196.96875-601.96875
601982319196.96875626.03125
612084419196.968751647.03125
621964019196.96875443.03125
631773519196.96875-1461.96875
641981419196.96875617.03125
652223919196.968753042.03125
662068219196.968751485.03125
671781919196.96875-1377.96875
682187219196.968752675.03125
692211719196.968752920.03125
702186619196.968752669.03125

\begin{tabular}{lllllllll}
\hline
Multiple Linear Regression - Actuals, Interpolation, and Residuals \tabularnewline
Time or Index & Actuals & InterpolationForecast & ResidualsPrediction Error \tabularnewline
1 & 15107 & 15874.7894736842 & -767.789473684233 \tabularnewline
2 & 15024 & 15874.7894736842 & -850.789473684208 \tabularnewline
3 & 12083 & 15874.7894736842 & -3791.78947368421 \tabularnewline
4 & 15761 & 15874.7894736842 & -113.78947368421 \tabularnewline
5 & 16943 & 15874.7894736842 & 1068.21052631579 \tabularnewline
6 & 15070 & 15874.7894736842 & -804.78947368421 \tabularnewline
7 & 13660 & 15874.7894736842 & -2214.78947368421 \tabularnewline
8 & 14769 & 15874.7894736842 & -1105.78947368421 \tabularnewline
9 & 14725 & 15874.7894736842 & -1149.78947368421 \tabularnewline
10 & 15998 & 15874.7894736842 & 123.21052631579 \tabularnewline
11 & 15371 & 15874.7894736842 & -503.78947368421 \tabularnewline
12 & 14957 & 15874.7894736842 & -917.78947368421 \tabularnewline
13 & 15470 & 15874.7894736842 & -404.78947368421 \tabularnewline
14 & 15102 & 15874.7894736842 & -772.78947368421 \tabularnewline
15 & 11704 & 15874.7894736842 & -4170.78947368421 \tabularnewline
16 & 16284 & 15874.7894736842 & 409.21052631579 \tabularnewline
17 & 16727 & 15874.7894736842 & 852.21052631579 \tabularnewline
18 & 14969 & 15874.7894736842 & -905.78947368421 \tabularnewline
19 & 14861 & 15874.7894736842 & -1013.78947368421 \tabularnewline
20 & 14583 & 15874.7894736842 & -1291.78947368421 \tabularnewline
21 & 15306 & 15874.7894736842 & -568.78947368421 \tabularnewline
22 & 17904 & 15874.7894736842 & 2029.21052631579 \tabularnewline
23 & 16379 & 15874.7894736842 & 504.21052631579 \tabularnewline
24 & 15420 & 15874.7894736842 & -454.78947368421 \tabularnewline
25 & 17871 & 15874.7894736842 & 1996.21052631579 \tabularnewline
26 & 15913 & 15874.7894736842 & 38.21052631579 \tabularnewline
27 & 13867 & 15874.7894736842 & -2007.78947368421 \tabularnewline
28 & 17823 & 15874.7894736842 & 1948.21052631579 \tabularnewline
29 & 17872 & 15874.7894736842 & 1997.21052631579 \tabularnewline
30 & 17422 & 15874.7894736842 & 1547.21052631579 \tabularnewline
31 & 16705 & 15874.7894736842 & 830.21052631579 \tabularnewline
32 & 15991 & 15874.7894736842 & 116.21052631579 \tabularnewline
33 & 16584 & 15874.7894736842 & 709.21052631579 \tabularnewline
34 & 19124 & 15874.7894736842 & 3249.21052631579 \tabularnewline
35 & 17839 & 15874.7894736842 & 1964.21052631579 \tabularnewline
36 & 17209 & 15874.7894736842 & 1334.21052631579 \tabularnewline
37 & 18587 & 15874.7894736842 & 2712.21052631579 \tabularnewline
38 & 16258 & 15874.7894736842 & 383.21052631579 \tabularnewline
39 & 15142 & 19196.96875 & -4054.96875 \tabularnewline
40 & 19202 & 19196.96875 & 5.03124999999999 \tabularnewline
41 & 17747 & 19196.96875 & -1449.96875 \tabularnewline
42 & 19090 & 19196.96875 & -106.96875 \tabularnewline
43 & 18040 & 19196.96875 & -1156.96875 \tabularnewline
44 & 17516 & 19196.96875 & -1680.96875 \tabularnewline
45 & 17752 & 19196.96875 & -1444.96875 \tabularnewline
46 & 21073 & 19196.96875 & 1876.03125 \tabularnewline
47 & 17170 & 19196.96875 & -2026.96875 \tabularnewline
48 & 19440 & 19196.96875 & 243.03125 \tabularnewline
49 & 19795 & 19196.96875 & 598.03125 \tabularnewline
50 & 17575 & 19196.96875 & -1621.96875 \tabularnewline
51 & 16165 & 19196.96875 & -3031.96875 \tabularnewline
52 & 19465 & 19196.96875 & 268.03125 \tabularnewline
53 & 19932 & 19196.96875 & 735.03125 \tabularnewline
54 & 19961 & 19196.96875 & 764.03125 \tabularnewline
55 & 17343 & 19196.96875 & -1853.96875 \tabularnewline
56 & 18924 & 19196.96875 & -272.96875 \tabularnewline
57 & 18574 & 19196.96875 & -622.96875 \tabularnewline
58 & 21351 & 19196.96875 & 2154.03125 \tabularnewline
59 & 18595 & 19196.96875 & -601.96875 \tabularnewline
60 & 19823 & 19196.96875 & 626.03125 \tabularnewline
61 & 20844 & 19196.96875 & 1647.03125 \tabularnewline
62 & 19640 & 19196.96875 & 443.03125 \tabularnewline
63 & 17735 & 19196.96875 & -1461.96875 \tabularnewline
64 & 19814 & 19196.96875 & 617.03125 \tabularnewline
65 & 22239 & 19196.96875 & 3042.03125 \tabularnewline
66 & 20682 & 19196.96875 & 1485.03125 \tabularnewline
67 & 17819 & 19196.96875 & -1377.96875 \tabularnewline
68 & 21872 & 19196.96875 & 2675.03125 \tabularnewline
69 & 22117 & 19196.96875 & 2920.03125 \tabularnewline
70 & 21866 & 19196.96875 & 2669.03125 \tabularnewline
\hline
\end{tabular}
%Source: https://freestatistics.org/blog/index.php?pk=25196&T=4

[TABLE]
[ROW][C]Multiple Linear Regression - Actuals, Interpolation, and Residuals[/C][/ROW]
[ROW][C]Time or Index[/C][C]Actuals[/C][C]InterpolationForecast[/C][C]ResidualsPrediction Error[/C][/ROW]
[ROW][C]1[/C][C]15107[/C][C]15874.7894736842[/C][C]-767.789473684233[/C][/ROW]
[ROW][C]2[/C][C]15024[/C][C]15874.7894736842[/C][C]-850.789473684208[/C][/ROW]
[ROW][C]3[/C][C]12083[/C][C]15874.7894736842[/C][C]-3791.78947368421[/C][/ROW]
[ROW][C]4[/C][C]15761[/C][C]15874.7894736842[/C][C]-113.78947368421[/C][/ROW]
[ROW][C]5[/C][C]16943[/C][C]15874.7894736842[/C][C]1068.21052631579[/C][/ROW]
[ROW][C]6[/C][C]15070[/C][C]15874.7894736842[/C][C]-804.78947368421[/C][/ROW]
[ROW][C]7[/C][C]13660[/C][C]15874.7894736842[/C][C]-2214.78947368421[/C][/ROW]
[ROW][C]8[/C][C]14769[/C][C]15874.7894736842[/C][C]-1105.78947368421[/C][/ROW]
[ROW][C]9[/C][C]14725[/C][C]15874.7894736842[/C][C]-1149.78947368421[/C][/ROW]
[ROW][C]10[/C][C]15998[/C][C]15874.7894736842[/C][C]123.21052631579[/C][/ROW]
[ROW][C]11[/C][C]15371[/C][C]15874.7894736842[/C][C]-503.78947368421[/C][/ROW]
[ROW][C]12[/C][C]14957[/C][C]15874.7894736842[/C][C]-917.78947368421[/C][/ROW]
[ROW][C]13[/C][C]15470[/C][C]15874.7894736842[/C][C]-404.78947368421[/C][/ROW]
[ROW][C]14[/C][C]15102[/C][C]15874.7894736842[/C][C]-772.78947368421[/C][/ROW]
[ROW][C]15[/C][C]11704[/C][C]15874.7894736842[/C][C]-4170.78947368421[/C][/ROW]
[ROW][C]16[/C][C]16284[/C][C]15874.7894736842[/C][C]409.21052631579[/C][/ROW]
[ROW][C]17[/C][C]16727[/C][C]15874.7894736842[/C][C]852.21052631579[/C][/ROW]
[ROW][C]18[/C][C]14969[/C][C]15874.7894736842[/C][C]-905.78947368421[/C][/ROW]
[ROW][C]19[/C][C]14861[/C][C]15874.7894736842[/C][C]-1013.78947368421[/C][/ROW]
[ROW][C]20[/C][C]14583[/C][C]15874.7894736842[/C][C]-1291.78947368421[/C][/ROW]
[ROW][C]21[/C][C]15306[/C][C]15874.7894736842[/C][C]-568.78947368421[/C][/ROW]
[ROW][C]22[/C][C]17904[/C][C]15874.7894736842[/C][C]2029.21052631579[/C][/ROW]
[ROW][C]23[/C][C]16379[/C][C]15874.7894736842[/C][C]504.21052631579[/C][/ROW]
[ROW][C]24[/C][C]15420[/C][C]15874.7894736842[/C][C]-454.78947368421[/C][/ROW]
[ROW][C]25[/C][C]17871[/C][C]15874.7894736842[/C][C]1996.21052631579[/C][/ROW]
[ROW][C]26[/C][C]15913[/C][C]15874.7894736842[/C][C]38.21052631579[/C][/ROW]
[ROW][C]27[/C][C]13867[/C][C]15874.7894736842[/C][C]-2007.78947368421[/C][/ROW]
[ROW][C]28[/C][C]17823[/C][C]15874.7894736842[/C][C]1948.21052631579[/C][/ROW]
[ROW][C]29[/C][C]17872[/C][C]15874.7894736842[/C][C]1997.21052631579[/C][/ROW]
[ROW][C]30[/C][C]17422[/C][C]15874.7894736842[/C][C]1547.21052631579[/C][/ROW]
[ROW][C]31[/C][C]16705[/C][C]15874.7894736842[/C][C]830.21052631579[/C][/ROW]
[ROW][C]32[/C][C]15991[/C][C]15874.7894736842[/C][C]116.21052631579[/C][/ROW]
[ROW][C]33[/C][C]16584[/C][C]15874.7894736842[/C][C]709.21052631579[/C][/ROW]
[ROW][C]34[/C][C]19124[/C][C]15874.7894736842[/C][C]3249.21052631579[/C][/ROW]
[ROW][C]35[/C][C]17839[/C][C]15874.7894736842[/C][C]1964.21052631579[/C][/ROW]
[ROW][C]36[/C][C]17209[/C][C]15874.7894736842[/C][C]1334.21052631579[/C][/ROW]
[ROW][C]37[/C][C]18587[/C][C]15874.7894736842[/C][C]2712.21052631579[/C][/ROW]
[ROW][C]38[/C][C]16258[/C][C]15874.7894736842[/C][C]383.21052631579[/C][/ROW]
[ROW][C]39[/C][C]15142[/C][C]19196.96875[/C][C]-4054.96875[/C][/ROW]
[ROW][C]40[/C][C]19202[/C][C]19196.96875[/C][C]5.03124999999999[/C][/ROW]
[ROW][C]41[/C][C]17747[/C][C]19196.96875[/C][C]-1449.96875[/C][/ROW]
[ROW][C]42[/C][C]19090[/C][C]19196.96875[/C][C]-106.96875[/C][/ROW]
[ROW][C]43[/C][C]18040[/C][C]19196.96875[/C][C]-1156.96875[/C][/ROW]
[ROW][C]44[/C][C]17516[/C][C]19196.96875[/C][C]-1680.96875[/C][/ROW]
[ROW][C]45[/C][C]17752[/C][C]19196.96875[/C][C]-1444.96875[/C][/ROW]
[ROW][C]46[/C][C]21073[/C][C]19196.96875[/C][C]1876.03125[/C][/ROW]
[ROW][C]47[/C][C]17170[/C][C]19196.96875[/C][C]-2026.96875[/C][/ROW]
[ROW][C]48[/C][C]19440[/C][C]19196.96875[/C][C]243.03125[/C][/ROW]
[ROW][C]49[/C][C]19795[/C][C]19196.96875[/C][C]598.03125[/C][/ROW]
[ROW][C]50[/C][C]17575[/C][C]19196.96875[/C][C]-1621.96875[/C][/ROW]
[ROW][C]51[/C][C]16165[/C][C]19196.96875[/C][C]-3031.96875[/C][/ROW]
[ROW][C]52[/C][C]19465[/C][C]19196.96875[/C][C]268.03125[/C][/ROW]
[ROW][C]53[/C][C]19932[/C][C]19196.96875[/C][C]735.03125[/C][/ROW]
[ROW][C]54[/C][C]19961[/C][C]19196.96875[/C][C]764.03125[/C][/ROW]
[ROW][C]55[/C][C]17343[/C][C]19196.96875[/C][C]-1853.96875[/C][/ROW]
[ROW][C]56[/C][C]18924[/C][C]19196.96875[/C][C]-272.96875[/C][/ROW]
[ROW][C]57[/C][C]18574[/C][C]19196.96875[/C][C]-622.96875[/C][/ROW]
[ROW][C]58[/C][C]21351[/C][C]19196.96875[/C][C]2154.03125[/C][/ROW]
[ROW][C]59[/C][C]18595[/C][C]19196.96875[/C][C]-601.96875[/C][/ROW]
[ROW][C]60[/C][C]19823[/C][C]19196.96875[/C][C]626.03125[/C][/ROW]
[ROW][C]61[/C][C]20844[/C][C]19196.96875[/C][C]1647.03125[/C][/ROW]
[ROW][C]62[/C][C]19640[/C][C]19196.96875[/C][C]443.03125[/C][/ROW]
[ROW][C]63[/C][C]17735[/C][C]19196.96875[/C][C]-1461.96875[/C][/ROW]
[ROW][C]64[/C][C]19814[/C][C]19196.96875[/C][C]617.03125[/C][/ROW]
[ROW][C]65[/C][C]22239[/C][C]19196.96875[/C][C]3042.03125[/C][/ROW]
[ROW][C]66[/C][C]20682[/C][C]19196.96875[/C][C]1485.03125[/C][/ROW]
[ROW][C]67[/C][C]17819[/C][C]19196.96875[/C][C]-1377.96875[/C][/ROW]
[ROW][C]68[/C][C]21872[/C][C]19196.96875[/C][C]2675.03125[/C][/ROW]
[ROW][C]69[/C][C]22117[/C][C]19196.96875[/C][C]2920.03125[/C][/ROW]
[ROW][C]70[/C][C]21866[/C][C]19196.96875[/C][C]2669.03125[/C][/ROW]
[/TABLE]
Source: https://freestatistics.org/blog/index.php?pk=25196&T=4

Globally Unique Identifier (entire table): ba.freestatistics.org/blog/index.php?pk=25196&T=4

As an alternative you can also use a QR Code:  

The GUIDs for individual cells are displayed in the table below:

Multiple Linear Regression - Actuals, Interpolation, and Residuals
Time or IndexActualsInterpolationForecastResidualsPrediction Error
11510715874.7894736842-767.789473684233
21502415874.7894736842-850.789473684208
31208315874.7894736842-3791.78947368421
41576115874.7894736842-113.78947368421
51694315874.78947368421068.21052631579
61507015874.7894736842-804.78947368421
71366015874.7894736842-2214.78947368421
81476915874.7894736842-1105.78947368421
91472515874.7894736842-1149.78947368421
101599815874.7894736842123.21052631579
111537115874.7894736842-503.78947368421
121495715874.7894736842-917.78947368421
131547015874.7894736842-404.78947368421
141510215874.7894736842-772.78947368421
151170415874.7894736842-4170.78947368421
161628415874.7894736842409.21052631579
171672715874.7894736842852.21052631579
181496915874.7894736842-905.78947368421
191486115874.7894736842-1013.78947368421
201458315874.7894736842-1291.78947368421
211530615874.7894736842-568.78947368421
221790415874.78947368422029.21052631579
231637915874.7894736842504.21052631579
241542015874.7894736842-454.78947368421
251787115874.78947368421996.21052631579
261591315874.789473684238.21052631579
271386715874.7894736842-2007.78947368421
281782315874.78947368421948.21052631579
291787215874.78947368421997.21052631579
301742215874.78947368421547.21052631579
311670515874.7894736842830.21052631579
321599115874.7894736842116.21052631579
331658415874.7894736842709.21052631579
341912415874.78947368423249.21052631579
351783915874.78947368421964.21052631579
361720915874.78947368421334.21052631579
371858715874.78947368422712.21052631579
381625815874.7894736842383.21052631579
391514219196.96875-4054.96875
401920219196.968755.03124999999999
411774719196.96875-1449.96875
421909019196.96875-106.96875
431804019196.96875-1156.96875
441751619196.96875-1680.96875
451775219196.96875-1444.96875
462107319196.968751876.03125
471717019196.96875-2026.96875
481944019196.96875243.03125
491979519196.96875598.03125
501757519196.96875-1621.96875
511616519196.96875-3031.96875
521946519196.96875268.03125
531993219196.96875735.03125
541996119196.96875764.03125
551734319196.96875-1853.96875
561892419196.96875-272.96875
571857419196.96875-622.96875
582135119196.968752154.03125
591859519196.96875-601.96875
601982319196.96875626.03125
612084419196.968751647.03125
621964019196.96875443.03125
631773519196.96875-1461.96875
641981419196.96875617.03125
652223919196.968753042.03125
662068219196.968751485.03125
671781919196.96875-1377.96875
682187219196.968752675.03125
692211719196.968752920.03125
702186619196.968752669.03125


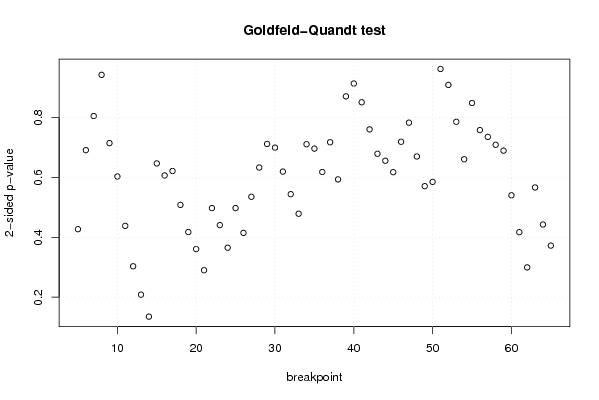
Goldfeld-Quandt test for Heteroskedasticity
p-valuesAlternative Hypothesis
breakpoint indexgreater2-sidedless
50.7862770724739630.4274458550520740.213722927526037
60.6541877458012990.6916245083974010.345812254198701
70.597208793312540.8055824133749190.402791206687459
80.4716804423314280.9433608846628550.528319557668572
90.3575936558795110.7151873117590220.642406344120489
100.3017975438091270.6035950876182540.698202456190873
110.2192853547027430.4385707094054870.780714645297257
120.1517467350780700.3034934701561400.84825326492193
130.1042646488147510.2085292976295010.89573535118525
140.06754770257409610.1350954051481920.932452297425904
150.3236218584215080.6472437168430150.676378141578492
160.3035480930704920.6070961861409840.696451906929508
170.3109845171733290.6219690343466590.68901548282667
180.2543162467561420.5086324935122830.745683753243858
190.2089366426262540.4178732852525080.791063357373746
200.1804742580898450.3609485161796910.819525741910155
210.1451207848049160.2902415696098330.854879215195084
220.2490217034387880.4980434068775760.750978296561212
230.2205546405953460.4411092811906920.779445359404654
240.1827324100796630.3654648201593260.817267589920337
250.2489742992931840.4979485985863680.751025700706816
260.2075640028172690.4151280056345380.792435997182731
270.2679006093528490.5358012187056980.732099390647151
280.3167382506418830.6334765012837660.683261749358117
290.3561423986632120.7122847973264240.643857601336788
300.3500032990330290.7000065980660580.649996700966971
310.3099655916882720.6199311833765440.690034408311728
320.2722152611614760.5444305223229530.727784738838524
330.2395410902742910.4790821805485830.760458909725709
340.3557204958677170.7114409917354340.644279504132283
350.3483487219544390.6966974439088790.651651278045561
360.3092549120831330.6185098241662660.690745087916867
370.3590027885773660.7180055771547310.640997211422634
380.2969335419408350.593867083881670.703066458059165
390.4356945469853580.8713890939707170.564305453014642
400.4571434585883960.9142869171767910.542856541411604
410.4257981234022930.8515962468045860.574201876597707
420.3805003083453310.7610006166906630.619499691654669
430.3397546166727670.6795092333455340.660245383327233
440.3281276921019160.6562553842038320.671872307898084
450.3089893041881770.6179786083763530.691010695811823
460.3598043755188280.7196087510376550.640195624481172
470.3917202917775630.7834405835551260.608279708222437
480.3352797907163260.6705595814326510.664720209283674
490.2856282912859260.5712565825718530.714371708714074
500.2927764904062460.5855529808124910.707223509593754
510.5184911337791450.963017732441710.481508866220855
520.4548106847698060.9096213695396120.545189315230194
530.393225711494370.786451422988740.60677428850563
540.3305674834725910.6611349669451810.66943251652741
550.4246219048199670.8492438096399340.575378095180033
560.3793247201234560.7586494402469110.620675279876544
570.3679784204621450.735956840924290.632021579537855
580.3547569039285900.7095138078571810.64524309607141
590.344954132923250.68990826584650.65504586707675
600.2703827489918670.5407654979837330.729617251008133
610.2087440412541140.4174880825082280.791255958745886
620.1498730229999890.2997460459999770.850126977000011
630.283440774427190.566881548854380.71655922557281
640.2215522209228110.4431044418456210.77844777907719
650.1863053583802890.3726107167605780.813694641619711

\begin{tabular}{lllllllll}
\hline
Goldfeld-Quandt test for Heteroskedasticity \tabularnewline
p-values & Alternative Hypothesis \tabularnewline
breakpoint index & greater & 2-sided & less \tabularnewline
5 & 0.786277072473963 & 0.427445855052074 & 0.213722927526037 \tabularnewline
6 & 0.654187745801299 & 0.691624508397401 & 0.345812254198701 \tabularnewline
7 & 0.59720879331254 & 0.805582413374919 & 0.402791206687459 \tabularnewline
8 & 0.471680442331428 & 0.943360884662855 & 0.528319557668572 \tabularnewline
9 & 0.357593655879511 & 0.715187311759022 & 0.642406344120489 \tabularnewline
10 & 0.301797543809127 & 0.603595087618254 & 0.698202456190873 \tabularnewline
11 & 0.219285354702743 & 0.438570709405487 & 0.780714645297257 \tabularnewline
12 & 0.151746735078070 & 0.303493470156140 & 0.84825326492193 \tabularnewline
13 & 0.104264648814751 & 0.208529297629501 & 0.89573535118525 \tabularnewline
14 & 0.0675477025740961 & 0.135095405148192 & 0.932452297425904 \tabularnewline
15 & 0.323621858421508 & 0.647243716843015 & 0.676378141578492 \tabularnewline
16 & 0.303548093070492 & 0.607096186140984 & 0.696451906929508 \tabularnewline
17 & 0.310984517173329 & 0.621969034346659 & 0.68901548282667 \tabularnewline
18 & 0.254316246756142 & 0.508632493512283 & 0.745683753243858 \tabularnewline
19 & 0.208936642626254 & 0.417873285252508 & 0.791063357373746 \tabularnewline
20 & 0.180474258089845 & 0.360948516179691 & 0.819525741910155 \tabularnewline
21 & 0.145120784804916 & 0.290241569609833 & 0.854879215195084 \tabularnewline
22 & 0.249021703438788 & 0.498043406877576 & 0.750978296561212 \tabularnewline
23 & 0.220554640595346 & 0.441109281190692 & 0.779445359404654 \tabularnewline
24 & 0.182732410079663 & 0.365464820159326 & 0.817267589920337 \tabularnewline
25 & 0.248974299293184 & 0.497948598586368 & 0.751025700706816 \tabularnewline
26 & 0.207564002817269 & 0.415128005634538 & 0.792435997182731 \tabularnewline
27 & 0.267900609352849 & 0.535801218705698 & 0.732099390647151 \tabularnewline
28 & 0.316738250641883 & 0.633476501283766 & 0.683261749358117 \tabularnewline
29 & 0.356142398663212 & 0.712284797326424 & 0.643857601336788 \tabularnewline
30 & 0.350003299033029 & 0.700006598066058 & 0.649996700966971 \tabularnewline
31 & 0.309965591688272 & 0.619931183376544 & 0.690034408311728 \tabularnewline
32 & 0.272215261161476 & 0.544430522322953 & 0.727784738838524 \tabularnewline
33 & 0.239541090274291 & 0.479082180548583 & 0.760458909725709 \tabularnewline
34 & 0.355720495867717 & 0.711440991735434 & 0.644279504132283 \tabularnewline
35 & 0.348348721954439 & 0.696697443908879 & 0.651651278045561 \tabularnewline
36 & 0.309254912083133 & 0.618509824166266 & 0.690745087916867 \tabularnewline
37 & 0.359002788577366 & 0.718005577154731 & 0.640997211422634 \tabularnewline
38 & 0.296933541940835 & 0.59386708388167 & 0.703066458059165 \tabularnewline
39 & 0.435694546985358 & 0.871389093970717 & 0.564305453014642 \tabularnewline
40 & 0.457143458588396 & 0.914286917176791 & 0.542856541411604 \tabularnewline
41 & 0.425798123402293 & 0.851596246804586 & 0.574201876597707 \tabularnewline
42 & 0.380500308345331 & 0.761000616690663 & 0.619499691654669 \tabularnewline
43 & 0.339754616672767 & 0.679509233345534 & 0.660245383327233 \tabularnewline
44 & 0.328127692101916 & 0.656255384203832 & 0.671872307898084 \tabularnewline
45 & 0.308989304188177 & 0.617978608376353 & 0.691010695811823 \tabularnewline
46 & 0.359804375518828 & 0.719608751037655 & 0.640195624481172 \tabularnewline
47 & 0.391720291777563 & 0.783440583555126 & 0.608279708222437 \tabularnewline
48 & 0.335279790716326 & 0.670559581432651 & 0.664720209283674 \tabularnewline
49 & 0.285628291285926 & 0.571256582571853 & 0.714371708714074 \tabularnewline
50 & 0.292776490406246 & 0.585552980812491 & 0.707223509593754 \tabularnewline
51 & 0.518491133779145 & 0.96301773244171 & 0.481508866220855 \tabularnewline
52 & 0.454810684769806 & 0.909621369539612 & 0.545189315230194 \tabularnewline
53 & 0.39322571149437 & 0.78645142298874 & 0.60677428850563 \tabularnewline
54 & 0.330567483472591 & 0.661134966945181 & 0.66943251652741 \tabularnewline
55 & 0.424621904819967 & 0.849243809639934 & 0.575378095180033 \tabularnewline
56 & 0.379324720123456 & 0.758649440246911 & 0.620675279876544 \tabularnewline
57 & 0.367978420462145 & 0.73595684092429 & 0.632021579537855 \tabularnewline
58 & 0.354756903928590 & 0.709513807857181 & 0.64524309607141 \tabularnewline
59 & 0.34495413292325 & 0.6899082658465 & 0.65504586707675 \tabularnewline
60 & 0.270382748991867 & 0.540765497983733 & 0.729617251008133 \tabularnewline
61 & 0.208744041254114 & 0.417488082508228 & 0.791255958745886 \tabularnewline
62 & 0.149873022999989 & 0.299746045999977 & 0.850126977000011 \tabularnewline
63 & 0.28344077442719 & 0.56688154885438 & 0.71655922557281 \tabularnewline
64 & 0.221552220922811 & 0.443104441845621 & 0.77844777907719 \tabularnewline
65 & 0.186305358380289 & 0.372610716760578 & 0.813694641619711 \tabularnewline
\hline
\end{tabular}
%Source: https://freestatistics.org/blog/index.php?pk=25196&T=5

[TABLE]
[ROW][C]Goldfeld-Quandt test for Heteroskedasticity[/C][/ROW]
[ROW][C]p-values[/C][C]Alternative Hypothesis[/C][/ROW]
[ROW][C]breakpoint index[/C][C]greater[/C][C]2-sided[/C][C]less[/C][/ROW]
[ROW][C]5[/C][C]0.786277072473963[/C][C]0.427445855052074[/C][C]0.213722927526037[/C][/ROW]
[ROW][C]6[/C][C]0.654187745801299[/C][C]0.691624508397401[/C][C]0.345812254198701[/C][/ROW]
[ROW][C]7[/C][C]0.59720879331254[/C][C]0.805582413374919[/C][C]0.402791206687459[/C][/ROW]
[ROW][C]8[/C][C]0.471680442331428[/C][C]0.943360884662855[/C][C]0.528319557668572[/C][/ROW]
[ROW][C]9[/C][C]0.357593655879511[/C][C]0.715187311759022[/C][C]0.642406344120489[/C][/ROW]
[ROW][C]10[/C][C]0.301797543809127[/C][C]0.603595087618254[/C][C]0.698202456190873[/C][/ROW]
[ROW][C]11[/C][C]0.219285354702743[/C][C]0.438570709405487[/C][C]0.780714645297257[/C][/ROW]
[ROW][C]12[/C][C]0.151746735078070[/C][C]0.303493470156140[/C][C]0.84825326492193[/C][/ROW]
[ROW][C]13[/C][C]0.104264648814751[/C][C]0.208529297629501[/C][C]0.89573535118525[/C][/ROW]
[ROW][C]14[/C][C]0.0675477025740961[/C][C]0.135095405148192[/C][C]0.932452297425904[/C][/ROW]
[ROW][C]15[/C][C]0.323621858421508[/C][C]0.647243716843015[/C][C]0.676378141578492[/C][/ROW]
[ROW][C]16[/C][C]0.303548093070492[/C][C]0.607096186140984[/C][C]0.696451906929508[/C][/ROW]
[ROW][C]17[/C][C]0.310984517173329[/C][C]0.621969034346659[/C][C]0.68901548282667[/C][/ROW]
[ROW][C]18[/C][C]0.254316246756142[/C][C]0.508632493512283[/C][C]0.745683753243858[/C][/ROW]
[ROW][C]19[/C][C]0.208936642626254[/C][C]0.417873285252508[/C][C]0.791063357373746[/C][/ROW]
[ROW][C]20[/C][C]0.180474258089845[/C][C]0.360948516179691[/C][C]0.819525741910155[/C][/ROW]
[ROW][C]21[/C][C]0.145120784804916[/C][C]0.290241569609833[/C][C]0.854879215195084[/C][/ROW]
[ROW][C]22[/C][C]0.249021703438788[/C][C]0.498043406877576[/C][C]0.750978296561212[/C][/ROW]
[ROW][C]23[/C][C]0.220554640595346[/C][C]0.441109281190692[/C][C]0.779445359404654[/C][/ROW]
[ROW][C]24[/C][C]0.182732410079663[/C][C]0.365464820159326[/C][C]0.817267589920337[/C][/ROW]
[ROW][C]25[/C][C]0.248974299293184[/C][C]0.497948598586368[/C][C]0.751025700706816[/C][/ROW]
[ROW][C]26[/C][C]0.207564002817269[/C][C]0.415128005634538[/C][C]0.792435997182731[/C][/ROW]
[ROW][C]27[/C][C]0.267900609352849[/C][C]0.535801218705698[/C][C]0.732099390647151[/C][/ROW]
[ROW][C]28[/C][C]0.316738250641883[/C][C]0.633476501283766[/C][C]0.683261749358117[/C][/ROW]
[ROW][C]29[/C][C]0.356142398663212[/C][C]0.712284797326424[/C][C]0.643857601336788[/C][/ROW]
[ROW][C]30[/C][C]0.350003299033029[/C][C]0.700006598066058[/C][C]0.649996700966971[/C][/ROW]
[ROW][C]31[/C][C]0.309965591688272[/C][C]0.619931183376544[/C][C]0.690034408311728[/C][/ROW]
[ROW][C]32[/C][C]0.272215261161476[/C][C]0.544430522322953[/C][C]0.727784738838524[/C][/ROW]
[ROW][C]33[/C][C]0.239541090274291[/C][C]0.479082180548583[/C][C]0.760458909725709[/C][/ROW]
[ROW][C]34[/C][C]0.355720495867717[/C][C]0.711440991735434[/C][C]0.644279504132283[/C][/ROW]
[ROW][C]35[/C][C]0.348348721954439[/C][C]0.696697443908879[/C][C]0.651651278045561[/C][/ROW]
[ROW][C]36[/C][C]0.309254912083133[/C][C]0.618509824166266[/C][C]0.690745087916867[/C][/ROW]
[ROW][C]37[/C][C]0.359002788577366[/C][C]0.718005577154731[/C][C]0.640997211422634[/C][/ROW]
[ROW][C]38[/C][C]0.296933541940835[/C][C]0.59386708388167[/C][C]0.703066458059165[/C][/ROW]
[ROW][C]39[/C][C]0.435694546985358[/C][C]0.871389093970717[/C][C]0.564305453014642[/C][/ROW]
[ROW][C]40[/C][C]0.457143458588396[/C][C]0.914286917176791[/C][C]0.542856541411604[/C][/ROW]
[ROW][C]41[/C][C]0.425798123402293[/C][C]0.851596246804586[/C][C]0.574201876597707[/C][/ROW]
[ROW][C]42[/C][C]0.380500308345331[/C][C]0.761000616690663[/C][C]0.619499691654669[/C][/ROW]
[ROW][C]43[/C][C]0.339754616672767[/C][C]0.679509233345534[/C][C]0.660245383327233[/C][/ROW]
[ROW][C]44[/C][C]0.328127692101916[/C][C]0.656255384203832[/C][C]0.671872307898084[/C][/ROW]
[ROW][C]45[/C][C]0.308989304188177[/C][C]0.617978608376353[/C][C]0.691010695811823[/C][/ROW]
[ROW][C]46[/C][C]0.359804375518828[/C][C]0.719608751037655[/C][C]0.640195624481172[/C][/ROW]
[ROW][C]47[/C][C]0.391720291777563[/C][C]0.783440583555126[/C][C]0.608279708222437[/C][/ROW]
[ROW][C]48[/C][C]0.335279790716326[/C][C]0.670559581432651[/C][C]0.664720209283674[/C][/ROW]
[ROW][C]49[/C][C]0.285628291285926[/C][C]0.571256582571853[/C][C]0.714371708714074[/C][/ROW]
[ROW][C]50[/C][C]0.292776490406246[/C][C]0.585552980812491[/C][C]0.707223509593754[/C][/ROW]
[ROW][C]51[/C][C]0.518491133779145[/C][C]0.96301773244171[/C][C]0.481508866220855[/C][/ROW]
[ROW][C]52[/C][C]0.454810684769806[/C][C]0.909621369539612[/C][C]0.545189315230194[/C][/ROW]
[ROW][C]53[/C][C]0.39322571149437[/C][C]0.78645142298874[/C][C]0.60677428850563[/C][/ROW]
[ROW][C]54[/C][C]0.330567483472591[/C][C]0.661134966945181[/C][C]0.66943251652741[/C][/ROW]
[ROW][C]55[/C][C]0.424621904819967[/C][C]0.849243809639934[/C][C]0.575378095180033[/C][/ROW]
[ROW][C]56[/C][C]0.379324720123456[/C][C]0.758649440246911[/C][C]0.620675279876544[/C][/ROW]
[ROW][C]57[/C][C]0.367978420462145[/C][C]0.73595684092429[/C][C]0.632021579537855[/C][/ROW]
[ROW][C]58[/C][C]0.354756903928590[/C][C]0.709513807857181[/C][C]0.64524309607141[/C][/ROW]
[ROW][C]59[/C][C]0.34495413292325[/C][C]0.6899082658465[/C][C]0.65504586707675[/C][/ROW]
[ROW][C]60[/C][C]0.270382748991867[/C][C]0.540765497983733[/C][C]0.729617251008133[/C][/ROW]
[ROW][C]61[/C][C]0.208744041254114[/C][C]0.417488082508228[/C][C]0.791255958745886[/C][/ROW]
[ROW][C]62[/C][C]0.149873022999989[/C][C]0.299746045999977[/C][C]0.850126977000011[/C][/ROW]
[ROW][C]63[/C][C]0.28344077442719[/C][C]0.56688154885438[/C][C]0.71655922557281[/C][/ROW]
[ROW][C]64[/C][C]0.221552220922811[/C][C]0.443104441845621[/C][C]0.77844777907719[/C][/ROW]
[ROW][C]65[/C][C]0.186305358380289[/C][C]0.372610716760578[/C][C]0.813694641619711[/C][/ROW]
[/TABLE]
Source: https://freestatistics.org/blog/index.php?pk=25196&T=5

Globally Unique Identifier (entire table): ba.freestatistics.org/blog/index.php?pk=25196&T=5

As an alternative you can also use a QR Code:  

The GUIDs for individual cells are displayed in the table below:

Goldfeld-Quandt test for Heteroskedasticity
p-valuesAlternative Hypothesis
breakpoint indexgreater2-sidedless
50.7862770724739630.4274458550520740.213722927526037
60.6541877458012990.6916245083974010.345812254198701
70.597208793312540.8055824133749190.402791206687459
80.4716804423314280.9433608846628550.528319557668572
90.3575936558795110.7151873117590220.642406344120489
100.3017975438091270.6035950876182540.698202456190873
110.2192853547027430.4385707094054870.780714645297257
120.1517467350780700.3034934701561400.84825326492193
130.1042646488147510.2085292976295010.89573535118525
140.06754770257409610.1350954051481920.932452297425904
150.3236218584215080.6472437168430150.676378141578492
160.3035480930704920.6070961861409840.696451906929508
170.3109845171733290.6219690343466590.68901548282667
180.2543162467561420.5086324935122830.745683753243858
190.2089366426262540.4178732852525080.791063357373746
200.1804742580898450.3609485161796910.819525741910155
210.1451207848049160.2902415696098330.854879215195084
220.2490217034387880.4980434068775760.750978296561212
230.2205546405953460.4411092811906920.779445359404654
240.1827324100796630.3654648201593260.817267589920337
250.2489742992931840.4979485985863680.751025700706816
260.2075640028172690.4151280056345380.792435997182731
270.2679006093528490.5358012187056980.732099390647151
280.3167382506418830.6334765012837660.683261749358117
290.3561423986632120.7122847973264240.643857601336788
300.3500032990330290.7000065980660580.649996700966971
310.3099655916882720.6199311833765440.690034408311728
320.2722152611614760.5444305223229530.727784738838524
330.2395410902742910.4790821805485830.760458909725709
340.3557204958677170.7114409917354340.644279504132283
350.3483487219544390.6966974439088790.651651278045561
360.3092549120831330.6185098241662660.690745087916867
370.3590027885773660.7180055771547310.640997211422634
380.2969335419408350.593867083881670.703066458059165
390.4356945469853580.8713890939707170.564305453014642
400.4571434585883960.9142869171767910.542856541411604
410.4257981234022930.8515962468045860.574201876597707
420.3805003083453310.7610006166906630.619499691654669
430.3397546166727670.6795092333455340.660245383327233
440.3281276921019160.6562553842038320.671872307898084
450.3089893041881770.6179786083763530.691010695811823
460.3598043755188280.7196087510376550.640195624481172
470.3917202917775630.7834405835551260.608279708222437
480.3352797907163260.6705595814326510.664720209283674
490.2856282912859260.5712565825718530.714371708714074
500.2927764904062460.5855529808124910.707223509593754
510.5184911337791450.963017732441710.481508866220855
520.4548106847698060.9096213695396120.545189315230194
530.393225711494370.786451422988740.60677428850563
540.3305674834725910.6611349669451810.66943251652741
550.4246219048199670.8492438096399340.575378095180033
560.3793247201234560.7586494402469110.620675279876544
570.3679784204621450.735956840924290.632021579537855
580.3547569039285900.7095138078571810.64524309607141
590.344954132923250.68990826584650.65504586707675
600.2703827489918670.5407654979837330.729617251008133
610.2087440412541140.4174880825082280.791255958745886
620.1498730229999890.2997460459999770.850126977000011
630.283440774427190.566881548854380.71655922557281
640.2215522209228110.4431044418456210.77844777907719
650.1863053583802890.3726107167605780.813694641619711


Meta Analysis of Goldfeld-Quandt test for Heteroskedasticity
Description# significant tests% significant testsOK/NOK
1% type I error level00OK
5% type I error level00OK
10% type I error level00OK

\begin{tabular}{lllllllll}
\hline
Meta Analysis of Goldfeld-Quandt test for Heteroskedasticity \tabularnewline
Description & # significant tests & % significant tests & OK/NOK \tabularnewline
1% type I error level & 0 & 0 & OK \tabularnewline
5% type I error level & 0 & 0 & OK \tabularnewline
10% type I error level & 0 & 0 & OK \tabularnewline
\hline
\end{tabular}
%Source: https://freestatistics.org/blog/index.php?pk=25196&T=6

[TABLE]
[ROW][C]Meta Analysis of Goldfeld-Quandt test for Heteroskedasticity[/C][/ROW]
[ROW][C]Description[/C][C]# significant tests[/C][C]% significant tests[/C][C]OK/NOK[/C][/ROW]
[ROW][C]1% type I error level[/C][C]0[/C][C]0[/C][C]OK[/C][/ROW]
[ROW][C]5% type I error level[/C][C]0[/C][C]0[/C][C]OK[/C][/ROW]
[ROW][C]10% type I error level[/C][C]0[/C][C]0[/C][C]OK[/C][/ROW]
[/TABLE]
Source: https://freestatistics.org/blog/index.php?pk=25196&T=6

Globally Unique Identifier (entire table): ba.freestatistics.org/blog/index.php?pk=25196&T=6

As an alternative you can also use a QR Code:  

The GUIDs for individual cells are displayed in the table below:

Meta Analysis of Goldfeld-Quandt test for Heteroskedasticity
Description# significant tests% significant testsOK/NOK
1% type I error level00OK
5% type I error level00OK
10% type I error level00OK


Parameters (Session):
par1 = 1 ; par2 = Do not include Seasonal Dummies ; par3 = No Linear Trend ;
Parameters (R input):
par1 = 1 ; par2 = Do not include Seasonal Dummies ; par3 = No Linear Trend ;
R code (references can be found in the software module):
library(lattice)
library(lmtest)
n25 <- 25 #minimum number of obs. for Goldfeld-Quandt test
par1 <- as.numeric(par1)
x <- t(y)
k <- length(x[1,])
n <- length(x[,1])
x1 <- cbind(x[,par1], x[,1:k!=par1])
mycolnames <- c(colnames(x)[par1], colnames(x)[1:k!=par1])
colnames(x1) <- mycolnames #colnames(x)[par1]
x <- x1
if (par3 == 'First Differences'){
x2 <- array(0, dim=c(n-1,k), dimnames=list(1:(n-1), paste('(1-B)',colnames(x),sep='')))
for (i in 1:n-1) {
for (j in 1:k) {
x2[i,j] <- x[i+1,j] - x[i,j]
}
}
x <- x2
}
if (par2 == 'Include Monthly Dummies'){
x2 <- array(0, dim=c(n,11), dimnames=list(1:n, paste('M', seq(1:11), sep ='')))
for (i in 1:11){
x2[seq(i,n,12),i] <- 1
}
x <- cbind(x, x2)
}
if (par2 == 'Include Quarterly Dummies'){
x2 <- array(0, dim=c(n,3), dimnames=list(1:n, paste('Q', seq(1:3), sep ='')))
for (i in 1:3){
x2[seq(i,n,4),i] <- 1
}
x <- cbind(x, x2)
}
k <- length(x[1,])
if (par3 == 'Linear Trend'){
x <- cbind(x, c(1:n))
colnames(x)[k+1] <- 't'
}
x
k <- length(x[1,])
df <- as.data.frame(x)
(mylm <- lm(df))
(mysum <- summary(mylm))
if (n > n25) {
kp3 <- k + 3
nmkm3 <- n - k - 3
gqarr <- array(NA, dim=c(nmkm3-kp3+1,3))
numgqtests <- 0
numsignificant1 <- 0
numsignificant5 <- 0
numsignificant10 <- 0
for (mypoint in kp3:nmkm3) {
j <- 0
numgqtests <- numgqtests + 1
for (myalt in c('greater', 'two.sided', 'less')) {
j <- j + 1
gqarr[mypoint-kp3+1,j] <- gqtest(mylm, point=mypoint, alternative=myalt)$p.value
}
if (gqarr[mypoint-kp3+1,2] < 0.01) numsignificant1 <- numsignificant1 + 1
if (gqarr[mypoint-kp3+1,2] < 0.05) numsignificant5 <- numsignificant5 + 1
if (gqarr[mypoint-kp3+1,2] < 0.10) numsignificant10 <- numsignificant10 + 1
}
gqarr
}
bitmap(file='test0.png')
plot(x[,1], type='l', main='Actuals and Interpolation', ylab='value of Actuals and Interpolation (dots)', xlab='time or index')
points(x[,1]-mysum$resid)
grid()
dev.off()
bitmap(file='test1.png')
plot(mysum$resid, type='b', pch=19, main='Residuals', ylab='value of Residuals', xlab='time or index')
grid()
dev.off()
bitmap(file='test2.png')
hist(mysum$resid, main='Residual Histogram', xlab='values of Residuals')
grid()
dev.off()
bitmap(file='test3.png')
densityplot(~mysum$resid,col='black',main='Residual Density Plot', xlab='values of Residuals')
dev.off()
bitmap(file='test4.png')
qqnorm(mysum$resid, main='Residual Normal Q-Q Plot')
qqline(mysum$resid)
grid()
dev.off()
(myerror <- as.ts(mysum$resid))
bitmap(file='test5.png')
dum <- cbind(lag(myerror,k=1),myerror)
dum
dum1 <- dum[2:length(myerror),]
dum1
z <- as.data.frame(dum1)
z
plot(z,main=paste('Residual Lag plot, lowess, and regression line'), ylab='values of Residuals', xlab='lagged values of Residuals')
lines(lowess(z))
abline(lm(z))
grid()
dev.off()
bitmap(file='test6.png')
acf(mysum$resid, lag.max=length(mysum$resid)/2, main='Residual Autocorrelation Function')
grid()
dev.off()
bitmap(file='test7.png')
pacf(mysum$resid, lag.max=length(mysum$resid)/2, main='Residual Partial Autocorrelation Function')
grid()
dev.off()
bitmap(file='test8.png')
opar <- par(mfrow = c(2,2), oma = c(0, 0, 1.1, 0))
plot(mylm, las = 1, sub='Residual Diagnostics')
par(opar)
dev.off()
if (n > n25) {
bitmap(file='test9.png')
plot(kp3:nmkm3,gqarr[,2], main='Goldfeld-Quandt test',ylab='2-sided p-value',xlab='breakpoint')
grid()
dev.off()
}
load(file='createtable')
a<-table.start()
a<-table.row.start(a)
a<-table.element(a, 'Multiple Linear Regression - Estimated Regression Equation', 1, TRUE)
a<-table.row.end(a)
myeq <- colnames(x)[1]
myeq <- paste(myeq, '[t] = ', sep='')
for (i in 1:k){
if (mysum$coefficients[i,1] > 0) myeq <- paste(myeq, '+', '')
myeq <- paste(myeq, mysum$coefficients[i,1], sep=' ')
if (rownames(mysum$coefficients)[i] != '(Intercept)') {
myeq <- paste(myeq, rownames(mysum$coefficients)[i], sep='')
if (rownames(mysum$coefficients)[i] != 't') myeq <- paste(myeq, '[t]', sep='')
}
}
myeq <- paste(myeq, ' + e[t]')
a<-table.row.start(a)
a<-table.element(a, myeq)
a<-table.row.end(a)
a<-table.end(a)
table.save(a,file='mytable1.tab')
a<-table.start()
a<-table.row.start(a)
a<-table.element(a,hyperlink('ols1.htm','Multiple Linear Regression - Ordinary Least Squares',''), 6, TRUE)
a<-table.row.end(a)
a<-table.row.start(a)
a<-table.element(a,'Variable',header=TRUE)
a<-table.element(a,'Parameter',header=TRUE)
a<-table.element(a,'S.D.',header=TRUE)
a<-table.element(a,'T-STAT
H0: parameter = 0',header=TRUE)
a<-table.element(a,'2-tail p-value',header=TRUE)
a<-table.element(a,'1-tail p-value',header=TRUE)
a<-table.row.end(a)
for (i in 1:k){
a<-table.row.start(a)
a<-table.element(a,rownames(mysum$coefficients)[i],header=TRUE)
a<-table.element(a,mysum$coefficients[i,1])
a<-table.element(a, round(mysum$coefficients[i,2],6))
a<-table.element(a, round(mysum$coefficients[i,3],4))
a<-table.element(a, round(mysum$coefficients[i,4],6))
a<-table.element(a, round(mysum$coefficients[i,4]/2,6))
a<-table.row.end(a)
}
a<-table.end(a)
table.save(a,file='mytable2.tab')
a<-table.start()
a<-table.row.start(a)
a<-table.element(a, 'Multiple Linear Regression - Regression Statistics', 2, TRUE)
a<-table.row.end(a)
a<-table.row.start(a)
a<-table.element(a, 'Multiple R',1,TRUE)
a<-table.element(a, sqrt(mysum$r.squared))
a<-table.row.end(a)
a<-table.row.start(a)
a<-table.element(a, 'R-squared',1,TRUE)
a<-table.element(a, mysum$r.squared)
a<-table.row.end(a)
a<-table.row.start(a)
a<-table.element(a, 'Adjusted R-squared',1,TRUE)
a<-table.element(a, mysum$adj.r.squared)
a<-table.row.end(a)
a<-table.row.start(a)
a<-table.element(a, 'F-TEST (value)',1,TRUE)
a<-table.element(a, mysum$fstatistic[1])
a<-table.row.end(a)
a<-table.row.start(a)
a<-table.element(a, 'F-TEST (DF numerator)',1,TRUE)
a<-table.element(a, mysum$fstatistic[2])
a<-table.row.end(a)
a<-table.row.start(a)
a<-table.element(a, 'F-TEST (DF denominator)',1,TRUE)
a<-table.element(a, mysum$fstatistic[3])
a<-table.row.end(a)
a<-table.row.start(a)
a<-table.element(a, 'p-value',1,TRUE)
a<-table.element(a, 1-pf(mysum$fstatistic[1],mysum$fstatistic[2],mysum$fstatistic[3]))
a<-table.row.end(a)
a<-table.row.start(a)
a<-table.element(a, 'Multiple Linear Regression - Residual Statistics', 2, TRUE)
a<-table.row.end(a)
a<-table.row.start(a)
a<-table.element(a, 'Residual Standard Deviation',1,TRUE)
a<-table.element(a, mysum$sigma)
a<-table.row.end(a)
a<-table.row.start(a)
a<-table.element(a, 'Sum Squared Residuals',1,TRUE)
a<-table.element(a, sum(myerror*myerror))
a<-table.row.end(a)
a<-table.end(a)
table.save(a,file='mytable3.tab')
a<-table.start()
a<-table.row.start(a)
a<-table.element(a, 'Multiple Linear Regression - Actuals, Interpolation, and Residuals', 4, TRUE)
a<-table.row.end(a)
a<-table.row.start(a)
a<-table.element(a, 'Time or Index', 1, TRUE)
a<-table.element(a, 'Actuals', 1, TRUE)
a<-table.element(a, 'Interpolation
Forecast', 1, TRUE)
a<-table.element(a, 'Residuals
Prediction Error', 1, TRUE)
a<-table.row.end(a)
for (i in 1:n) {
a<-table.row.start(a)
a<-table.element(a,i, 1, TRUE)
a<-table.element(a,x[i])
a<-table.element(a,x[i]-mysum$resid[i])
a<-table.element(a,mysum$resid[i])
a<-table.row.end(a)
}
a<-table.end(a)
table.save(a,file='mytable4.tab')
if (n > n25) {
a<-table.start()
a<-table.row.start(a)
a<-table.element(a,'Goldfeld-Quandt test for Heteroskedasticity',4,TRUE)
a<-table.row.end(a)
a<-table.row.start(a)
a<-table.element(a,'p-values',header=TRUE)
a<-table.element(a,'Alternative Hypothesis',3,header=TRUE)
a<-table.row.end(a)
a<-table.row.start(a)
a<-table.element(a,'breakpoint index',header=TRUE)
a<-table.element(a,'greater',header=TRUE)
a<-table.element(a,'2-sided',header=TRUE)
a<-table.element(a,'less',header=TRUE)
a<-table.row.end(a)
for (mypoint in kp3:nmkm3) {
a<-table.row.start(a)
a<-table.element(a,mypoint,header=TRUE)
a<-table.element(a,gqarr[mypoint-kp3+1,1])
a<-table.element(a,gqarr[mypoint-kp3+1,2])
a<-table.element(a,gqarr[mypoint-kp3+1,3])
a<-table.row.end(a)
}
a<-table.end(a)
table.save(a,file='mytable5.tab')
a<-table.start()
a<-table.row.start(a)
a<-table.element(a,'Meta Analysis of Goldfeld-Quandt test for Heteroskedasticity',4,TRUE)
a<-table.row.end(a)
a<-table.row.start(a)
a<-table.element(a,'Description',header=TRUE)
a<-table.element(a,'# significant tests',header=TRUE)
a<-table.element(a,'% significant tests',header=TRUE)
a<-table.element(a,'OK/NOK',header=TRUE)
a<-table.row.end(a)
a<-table.row.start(a)
a<-table.element(a,'1% type I error level',header=TRUE)
a<-table.element(a,numsignificant1)
a<-table.element(a,numsignificant1/numgqtests)
if (numsignificant1/numgqtests < 0.01) dum <- 'OK' else dum <- 'NOK'
a<-table.element(a,dum)
a<-table.row.end(a)
a<-table.row.start(a)
a<-table.element(a,'5% type I error level',header=TRUE)
a<-table.element(a,numsignificant5)
a<-table.element(a,numsignificant5/numgqtests)
if (numsignificant5/numgqtests < 0.05) dum <- 'OK' else dum <- 'NOK'
a<-table.element(a,dum)
a<-table.row.end(a)
a<-table.row.start(a)
a<-table.element(a,'10% type I error level',header=TRUE)
a<-table.element(a,numsignificant10)
a<-table.element(a,numsignificant10/numgqtests)
if (numsignificant10/numgqtests < 0.1) dum <- 'OK' else dum <- 'NOK'
a<-table.element(a,dum)
a<-table.row.end(a)
a<-table.end(a)
table.save(a,file='mytable6.tab')
}