Free Statistics

of Irreproducible Research!

Author's title

Author*The author of this computation has been verified*
R Software Modulerwasp_multipleregression.wasp
Title produced by softwareMultiple Regression
Date of computationSat, 22 Nov 2008 03:58:57 -0700
Cite this page as followsStatistical Computations at FreeStatistics.org, Office for Research Development and Education, URL https://freestatistics.org/blog/index.php?v=date/2008/Nov/22/t122735216091ky2rd2hiatmom.htm/, Retrieved Sun, 19 May 2024 10:42:53 +0000
Statistical Computations at FreeStatistics.org, Office for Research Development and Education, URL https://freestatistics.org/blog/index.php?pk=25175, Retrieved Sun, 19 May 2024 10:42:53 +0000
QR Codes:

Original text written by user:
IsPrivate?No (this computation is public)
User-defined keywordseigen dataset
Estimated Impact233
Family? (F = Feedback message, R = changed R code, M = changed R Module, P = changed Parameters, D = changed Data)
F       [Multiple Regression] [Multiple lineair ...] [2008-11-22 10:58:57] [32a7b12f2bdf14b45f7a9a96ba1ab98d] [Current]
-   PD    [Multiple Regression] [verbetering] [2008-12-01 19:24:25] [5387335d8669ad018e3e2def51162329]
Feedback Forum
2008-11-29 10:49:08 [72e979bcc364082694890d2eccc1a66f] [reply
De R² bedraagt slecht 0,2 wat heel weinig is. We kunnen dus zeggen dat dit geen goed model is.
Door monthly dummies en een lineaire trend in te voegen kom je al tot iets nauwkeuriger resultaten maar de R² blijft nog steeds laag. We kunnen dus besluiten dat de investeringen niet veel invloed hebben gehad op de werkloosheid in de textielindustrie.
2008-12-01 10:03:10 [Jessica Alves Pires] [reply
Ik ben het eens met voorgaande opmerking. Er is niet gebruikt gemaakt van dummies en linear trend. De student gebruikt maar 1 grafiek, dit is niet genoeg. Ook beschrijft ze alleen maar wat er gebeurt met de werkloosheid op de grafiek en geeft ze geen conclusie en dus geen antwoord op de vraag.
2008-12-01 12:29:04 [Steven Vanhooreweghe] [reply
Het lijkt me ook niet echt een goed model. ik heb het model gereproduceerd met seasonal dummies en daarin was de r-squared 0.4, wat toch wel al wat beter. De p-values en de t-stat schijnen in dit model wel uit dat het een goed is. Ook al is de r-squared laag, de p-value is ook bijna nul dus de 20% die verklaard word is wel significant. De student had inderdaad wel wat meer uitleg mogen geven.
2008-12-01 14:22:26 [7b82dc4d155fe51dc5dbd8b053a3bdf4] [reply
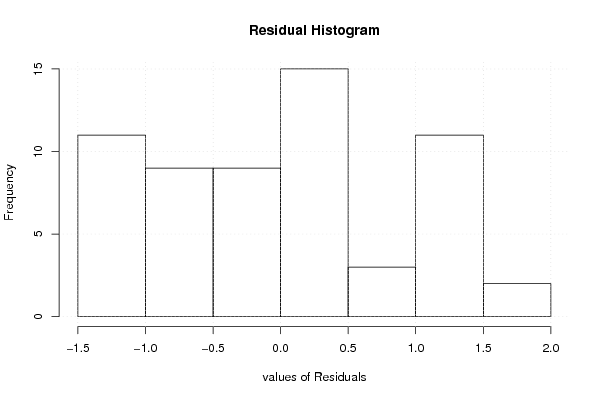
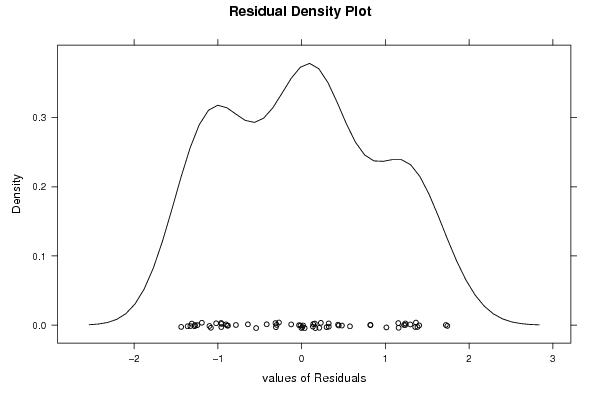
Ik vind het ook te beknopt. De grafieken zouden wat uitgebreider besproken kunnen worden. Bvb De Residual histogram zou een normale verdeling moeten weergeven, maar hier merk ik op dat dit hier nog niet het geval is. In de eerste periode zie je dat het histogram afgevlakt is.
2008-12-01 19:31:20 [Stef Vermeiren] [reply
Ik ben het eens met mijn voorgangers. In het huidige model bedraagt de R-squared 20%, wat inderdaad te weinig is. Deze geeft immers de kwaliteit van het model weer. Kortom, hoe hoger, hoe beter. Dit geeft het percentage weer van de van de spreiding van de werklozen dat je kan verklaren aan de hand van dit model.
Er werden geen seasonal dummies gebruikt.
Ook ik heb de berekening opnieuw gedaan met seasonal dummies (zie link). Hierin bedraagt de R² al 40 procent, maar dat is nog steeds te laag om van een goed model te spreken.

De student had nog aan de hand van andere grafieken meer uitleg mogen geven.


http://www.freestatistics.org/blog/index.php?v=date/2008/Dec/01/t1228159534ik5d8jqfhx7yuoi.htm

Post a new message
Dataseries X:
6,06	0
5,983	0
6,11	0
6,143	0
6,093	0
6,148	0
6,464	0
6,532	0
6,321	0
6,23	0
6,176	0
6,338	0
6,462	0
6,401	0
6,46	0
6,519	0
6,542	0
6,637	0
7,114	0
7,579	0
7,408	0
8,243	0
8,243	0
8,434	0
8,576	0
8,58	0
8,645	0
8,66	0
8,72	0
8,787	0
9,162	0
9,144	0
8,806	0
8,778	0
8,66	0
8,826	0
8,609	1
8,628	1
8,619	1
8,775	1
8,84	1
8,745	1
9,092	1
8,934	1
8,749	1
8,298	1
8,067	1
7,969	1
7,999	0
7,865	0
7,746	0
7,633	0
7,458	0
7,391	0
7,856	0
7,72	0
7,297	0
7,123	0
7,004	0
7,151	0


Summary of computational transaction
Raw Inputview raw input (R code)
Raw Outputview raw output of R engine
Computing time7 seconds
R Server'Herman Ole Andreas Wold' @ 193.190.124.10:1001

\begin{tabular}{lllllllll}
\hline
Summary of computational transaction \tabularnewline
Raw Input & view raw input (R code)  \tabularnewline
Raw Output & view raw output of R engine  \tabularnewline
Computing time & 7 seconds \tabularnewline
R Server & 'Herman Ole Andreas Wold' @ 193.190.124.10:1001 \tabularnewline
\hline
\end{tabular}
%Source: https://freestatistics.org/blog/index.php?pk=25175&T=0

[TABLE]
[ROW][C]Summary of computational transaction[/C][/ROW]
[ROW][C]Raw Input[/C][C]view raw input (R code) [/C][/ROW]
[ROW][C]Raw Output[/C][C]view raw output of R engine [/C][/ROW]
[ROW][C]Computing time[/C][C]7 seconds[/C][/ROW]
[ROW][C]R Server[/C][C]'Herman Ole Andreas Wold' @ 193.190.124.10:1001[/C][/ROW]
[/TABLE]
Source: https://freestatistics.org/blog/index.php?pk=25175&T=0

Globally Unique Identifier (entire table): ba.freestatistics.org/blog/index.php?pk=25175&T=0

As an alternative you can also use a QR Code:  

The GUIDs for individual cells are displayed in the table below:

Summary of computational transaction
Raw Inputview raw input (R code)
Raw Outputview raw output of R engine
Computing time7 seconds
R Server'Herman Ole Andreas Wold' @ 193.190.124.10:1001


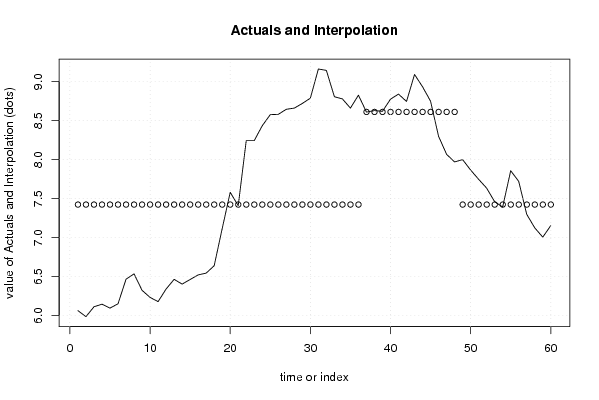
Multiple Linear Regression - Estimated Regression Equation
Textiel[t] = + 7.42139583333333 + 1.18902083333333dummy[t] + e[t]

\begin{tabular}{lllllllll}
\hline
Multiple Linear Regression - Estimated Regression Equation \tabularnewline
Textiel[t] =  +  7.42139583333333 +  1.18902083333333dummy[t]  + e[t] \tabularnewline
\hline
\end{tabular}
%Source: https://freestatistics.org/blog/index.php?pk=25175&T=1

[TABLE]
[ROW][C]Multiple Linear Regression - Estimated Regression Equation[/C][/ROW]
[ROW][C]Textiel[t] =  +  7.42139583333333 +  1.18902083333333dummy[t]  + e[t][/C][/ROW]
[/TABLE]
Source: https://freestatistics.org/blog/index.php?pk=25175&T=1

Globally Unique Identifier (entire table): ba.freestatistics.org/blog/index.php?pk=25175&T=1

As an alternative you can also use a QR Code:  

The GUIDs for individual cells are displayed in the table below:

Multiple Linear Regression - Estimated Regression Equation
Textiel[t] = + 7.42139583333333 + 1.18902083333333dummy[t] + e[t]


Multiple Linear Regression - Ordinary Least Squares
VariableParameterS.D.T-STATH0: parameter = 02-tail p-value1-tail p-value
(Intercept)7.421395833333330.13454955.157600
dummy1.189020833333330.3008613.95210.0002130.000106

\begin{tabular}{lllllllll}
\hline
Multiple Linear Regression - Ordinary Least Squares \tabularnewline
Variable & Parameter & S.D. & T-STATH0: parameter = 0 & 2-tail p-value & 1-tail p-value \tabularnewline
(Intercept) & 7.42139583333333 & 0.134549 & 55.1576 & 0 & 0 \tabularnewline
dummy & 1.18902083333333 & 0.300861 & 3.9521 & 0.000213 & 0.000106 \tabularnewline
\hline
\end{tabular}
%Source: https://freestatistics.org/blog/index.php?pk=25175&T=2

[TABLE]
[ROW][C]Multiple Linear Regression - Ordinary Least Squares[/C][/ROW]
[ROW][C]Variable[/C][C]Parameter[/C][C]S.D.[/C][C]T-STATH0: parameter = 0[/C][C]2-tail p-value[/C][C]1-tail p-value[/C][/ROW]
[ROW][C](Intercept)[/C][C]7.42139583333333[/C][C]0.134549[/C][C]55.1576[/C][C]0[/C][C]0[/C][/ROW]
[ROW][C]dummy[/C][C]1.18902083333333[/C][C]0.300861[/C][C]3.9521[/C][C]0.000213[/C][C]0.000106[/C][/ROW]
[/TABLE]
Source: https://freestatistics.org/blog/index.php?pk=25175&T=2

Globally Unique Identifier (entire table): ba.freestatistics.org/blog/index.php?pk=25175&T=2

As an alternative you can also use a QR Code:  

The GUIDs for individual cells are displayed in the table below:

Multiple Linear Regression - Ordinary Least Squares
VariableParameterS.D.T-STATH0: parameter = 02-tail p-value1-tail p-value
(Intercept)7.421395833333330.13454955.157600
dummy1.189020833333330.3008613.95210.0002130.000106


Multiple Linear Regression - Regression Statistics
Multiple R0.460606011517861
R-squared0.212157897846391
Adjusted R-squared0.198574413326502
F-TEST (value)15.6188125024721
F-TEST (DF numerator)1
F-TEST (DF denominator)58
p-value0.000212839494328709
Multiple Linear Regression - Residual Statistics
Residual Standard Deviation0.932182777658247
Sum Squared Residuals50.3999543958334

\begin{tabular}{lllllllll}
\hline
Multiple Linear Regression - Regression Statistics \tabularnewline
Multiple R & 0.460606011517861 \tabularnewline
R-squared & 0.212157897846391 \tabularnewline
Adjusted R-squared & 0.198574413326502 \tabularnewline
F-TEST (value) & 15.6188125024721 \tabularnewline
F-TEST (DF numerator) & 1 \tabularnewline
F-TEST (DF denominator) & 58 \tabularnewline
p-value & 0.000212839494328709 \tabularnewline
Multiple Linear Regression - Residual Statistics \tabularnewline
Residual Standard Deviation & 0.932182777658247 \tabularnewline
Sum Squared Residuals & 50.3999543958334 \tabularnewline
\hline
\end{tabular}
%Source: https://freestatistics.org/blog/index.php?pk=25175&T=3

[TABLE]
[ROW][C]Multiple Linear Regression - Regression Statistics[/C][/ROW]
[ROW][C]Multiple R[/C][C]0.460606011517861[/C][/ROW]
[ROW][C]R-squared[/C][C]0.212157897846391[/C][/ROW]
[ROW][C]Adjusted R-squared[/C][C]0.198574413326502[/C][/ROW]
[ROW][C]F-TEST (value)[/C][C]15.6188125024721[/C][/ROW]
[ROW][C]F-TEST (DF numerator)[/C][C]1[/C][/ROW]
[ROW][C]F-TEST (DF denominator)[/C][C]58[/C][/ROW]
[ROW][C]p-value[/C][C]0.000212839494328709[/C][/ROW]
[ROW][C]Multiple Linear Regression - Residual Statistics[/C][/ROW]
[ROW][C]Residual Standard Deviation[/C][C]0.932182777658247[/C][/ROW]
[ROW][C]Sum Squared Residuals[/C][C]50.3999543958334[/C][/ROW]
[/TABLE]
Source: https://freestatistics.org/blog/index.php?pk=25175&T=3

Globally Unique Identifier (entire table): ba.freestatistics.org/blog/index.php?pk=25175&T=3

As an alternative you can also use a QR Code:  

The GUIDs for individual cells are displayed in the table below:

Multiple Linear Regression - Regression Statistics
Multiple R0.460606011517861
R-squared0.212157897846391
Adjusted R-squared0.198574413326502
F-TEST (value)15.6188125024721
F-TEST (DF numerator)1
F-TEST (DF denominator)58
p-value0.000212839494328709
Multiple Linear Regression - Residual Statistics
Residual Standard Deviation0.932182777658247
Sum Squared Residuals50.3999543958334


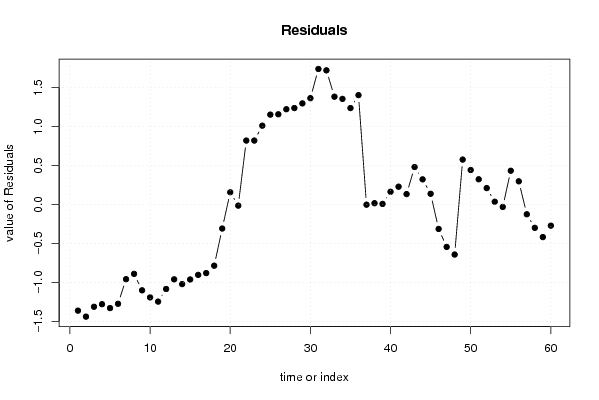
Multiple Linear Regression - Actuals, Interpolation, and Residuals
Time or IndexActualsInterpolationForecastResidualsPrediction Error
16.067.42139583333334-1.36139583333334
25.9837.42139583333333-1.43839583333333
36.117.42139583333333-1.31139583333333
46.1437.42139583333333-1.27839583333333
56.0937.42139583333333-1.32839583333333
66.1487.42139583333333-1.27339583333333
76.4647.42139583333333-0.957395833333333
86.5327.42139583333333-0.889395833333333
96.3217.42139583333333-1.10039583333333
106.237.42139583333333-1.19139583333333
116.1767.42139583333333-1.24539583333333
126.3387.42139583333333-1.08339583333333
136.4627.42139583333333-0.959395833333333
146.4017.42139583333333-1.02039583333333
156.467.42139583333333-0.961395833333333
166.5197.42139583333333-0.902395833333333
176.5427.42139583333333-0.879395833333333
186.6377.42139583333333-0.784395833333334
197.1147.42139583333333-0.307395833333333
207.5797.421395833333330.157604166666667
217.4087.42139583333333-0.0133958333333328
228.2437.421395833333330.821604166666667
238.2437.421395833333330.821604166666667
248.4347.421395833333331.01260416666667
258.5767.421395833333331.15460416666667
268.587.421395833333331.15860416666667
278.6457.421395833333331.22360416666667
288.667.421395833333331.23860416666667
298.727.421395833333331.29860416666667
308.7877.421395833333331.36560416666667
319.1627.421395833333331.74060416666667
329.1447.421395833333331.72260416666667
338.8067.421395833333331.38460416666667
348.7787.421395833333331.35660416666667
358.667.421395833333331.23860416666667
368.8267.421395833333331.40460416666667
378.6098.61041666666667-0.00141666666666670
388.6288.610416666666670.0175833333333334
398.6198.610416666666670.00858333333333309
408.7758.610416666666670.164583333333334
418.848.610416666666670.229583333333333
428.7458.610416666666670.134583333333333
439.0928.610416666666670.481583333333334
448.9348.610416666666670.323583333333333
458.7498.610416666666670.138583333333334
468.2988.61041666666667-0.312416666666667
478.0678.61041666666667-0.543416666666666
487.9698.61041666666667-0.641416666666666
497.9997.421395833333330.577604166666666
507.8657.421395833333330.443604166666667
517.7467.421395833333330.324604166666667
527.6337.421395833333330.211604166666667
537.4587.421395833333330.036604166666667
547.3917.42139583333333-0.0303958333333332
557.8567.421395833333330.434604166666667
567.727.421395833333330.298604166666667
577.2977.42139583333333-0.124395833333333
587.1237.42139583333333-0.298395833333333
597.0047.42139583333333-0.417395833333334
607.1517.42139583333333-0.270395833333333

\begin{tabular}{lllllllll}
\hline
Multiple Linear Regression - Actuals, Interpolation, and Residuals \tabularnewline
Time or Index & Actuals & InterpolationForecast & ResidualsPrediction Error \tabularnewline
1 & 6.06 & 7.42139583333334 & -1.36139583333334 \tabularnewline
2 & 5.983 & 7.42139583333333 & -1.43839583333333 \tabularnewline
3 & 6.11 & 7.42139583333333 & -1.31139583333333 \tabularnewline
4 & 6.143 & 7.42139583333333 & -1.27839583333333 \tabularnewline
5 & 6.093 & 7.42139583333333 & -1.32839583333333 \tabularnewline
6 & 6.148 & 7.42139583333333 & -1.27339583333333 \tabularnewline
7 & 6.464 & 7.42139583333333 & -0.957395833333333 \tabularnewline
8 & 6.532 & 7.42139583333333 & -0.889395833333333 \tabularnewline
9 & 6.321 & 7.42139583333333 & -1.10039583333333 \tabularnewline
10 & 6.23 & 7.42139583333333 & -1.19139583333333 \tabularnewline
11 & 6.176 & 7.42139583333333 & -1.24539583333333 \tabularnewline
12 & 6.338 & 7.42139583333333 & -1.08339583333333 \tabularnewline
13 & 6.462 & 7.42139583333333 & -0.959395833333333 \tabularnewline
14 & 6.401 & 7.42139583333333 & -1.02039583333333 \tabularnewline
15 & 6.46 & 7.42139583333333 & -0.961395833333333 \tabularnewline
16 & 6.519 & 7.42139583333333 & -0.902395833333333 \tabularnewline
17 & 6.542 & 7.42139583333333 & -0.879395833333333 \tabularnewline
18 & 6.637 & 7.42139583333333 & -0.784395833333334 \tabularnewline
19 & 7.114 & 7.42139583333333 & -0.307395833333333 \tabularnewline
20 & 7.579 & 7.42139583333333 & 0.157604166666667 \tabularnewline
21 & 7.408 & 7.42139583333333 & -0.0133958333333328 \tabularnewline
22 & 8.243 & 7.42139583333333 & 0.821604166666667 \tabularnewline
23 & 8.243 & 7.42139583333333 & 0.821604166666667 \tabularnewline
24 & 8.434 & 7.42139583333333 & 1.01260416666667 \tabularnewline
25 & 8.576 & 7.42139583333333 & 1.15460416666667 \tabularnewline
26 & 8.58 & 7.42139583333333 & 1.15860416666667 \tabularnewline
27 & 8.645 & 7.42139583333333 & 1.22360416666667 \tabularnewline
28 & 8.66 & 7.42139583333333 & 1.23860416666667 \tabularnewline
29 & 8.72 & 7.42139583333333 & 1.29860416666667 \tabularnewline
30 & 8.787 & 7.42139583333333 & 1.36560416666667 \tabularnewline
31 & 9.162 & 7.42139583333333 & 1.74060416666667 \tabularnewline
32 & 9.144 & 7.42139583333333 & 1.72260416666667 \tabularnewline
33 & 8.806 & 7.42139583333333 & 1.38460416666667 \tabularnewline
34 & 8.778 & 7.42139583333333 & 1.35660416666667 \tabularnewline
35 & 8.66 & 7.42139583333333 & 1.23860416666667 \tabularnewline
36 & 8.826 & 7.42139583333333 & 1.40460416666667 \tabularnewline
37 & 8.609 & 8.61041666666667 & -0.00141666666666670 \tabularnewline
38 & 8.628 & 8.61041666666667 & 0.0175833333333334 \tabularnewline
39 & 8.619 & 8.61041666666667 & 0.00858333333333309 \tabularnewline
40 & 8.775 & 8.61041666666667 & 0.164583333333334 \tabularnewline
41 & 8.84 & 8.61041666666667 & 0.229583333333333 \tabularnewline
42 & 8.745 & 8.61041666666667 & 0.134583333333333 \tabularnewline
43 & 9.092 & 8.61041666666667 & 0.481583333333334 \tabularnewline
44 & 8.934 & 8.61041666666667 & 0.323583333333333 \tabularnewline
45 & 8.749 & 8.61041666666667 & 0.138583333333334 \tabularnewline
46 & 8.298 & 8.61041666666667 & -0.312416666666667 \tabularnewline
47 & 8.067 & 8.61041666666667 & -0.543416666666666 \tabularnewline
48 & 7.969 & 8.61041666666667 & -0.641416666666666 \tabularnewline
49 & 7.999 & 7.42139583333333 & 0.577604166666666 \tabularnewline
50 & 7.865 & 7.42139583333333 & 0.443604166666667 \tabularnewline
51 & 7.746 & 7.42139583333333 & 0.324604166666667 \tabularnewline
52 & 7.633 & 7.42139583333333 & 0.211604166666667 \tabularnewline
53 & 7.458 & 7.42139583333333 & 0.036604166666667 \tabularnewline
54 & 7.391 & 7.42139583333333 & -0.0303958333333332 \tabularnewline
55 & 7.856 & 7.42139583333333 & 0.434604166666667 \tabularnewline
56 & 7.72 & 7.42139583333333 & 0.298604166666667 \tabularnewline
57 & 7.297 & 7.42139583333333 & -0.124395833333333 \tabularnewline
58 & 7.123 & 7.42139583333333 & -0.298395833333333 \tabularnewline
59 & 7.004 & 7.42139583333333 & -0.417395833333334 \tabularnewline
60 & 7.151 & 7.42139583333333 & -0.270395833333333 \tabularnewline
\hline
\end{tabular}
%Source: https://freestatistics.org/blog/index.php?pk=25175&T=4

[TABLE]
[ROW][C]Multiple Linear Regression - Actuals, Interpolation, and Residuals[/C][/ROW]
[ROW][C]Time or Index[/C][C]Actuals[/C][C]InterpolationForecast[/C][C]ResidualsPrediction Error[/C][/ROW]
[ROW][C]1[/C][C]6.06[/C][C]7.42139583333334[/C][C]-1.36139583333334[/C][/ROW]
[ROW][C]2[/C][C]5.983[/C][C]7.42139583333333[/C][C]-1.43839583333333[/C][/ROW]
[ROW][C]3[/C][C]6.11[/C][C]7.42139583333333[/C][C]-1.31139583333333[/C][/ROW]
[ROW][C]4[/C][C]6.143[/C][C]7.42139583333333[/C][C]-1.27839583333333[/C][/ROW]
[ROW][C]5[/C][C]6.093[/C][C]7.42139583333333[/C][C]-1.32839583333333[/C][/ROW]
[ROW][C]6[/C][C]6.148[/C][C]7.42139583333333[/C][C]-1.27339583333333[/C][/ROW]
[ROW][C]7[/C][C]6.464[/C][C]7.42139583333333[/C][C]-0.957395833333333[/C][/ROW]
[ROW][C]8[/C][C]6.532[/C][C]7.42139583333333[/C][C]-0.889395833333333[/C][/ROW]
[ROW][C]9[/C][C]6.321[/C][C]7.42139583333333[/C][C]-1.10039583333333[/C][/ROW]
[ROW][C]10[/C][C]6.23[/C][C]7.42139583333333[/C][C]-1.19139583333333[/C][/ROW]
[ROW][C]11[/C][C]6.176[/C][C]7.42139583333333[/C][C]-1.24539583333333[/C][/ROW]
[ROW][C]12[/C][C]6.338[/C][C]7.42139583333333[/C][C]-1.08339583333333[/C][/ROW]
[ROW][C]13[/C][C]6.462[/C][C]7.42139583333333[/C][C]-0.959395833333333[/C][/ROW]
[ROW][C]14[/C][C]6.401[/C][C]7.42139583333333[/C][C]-1.02039583333333[/C][/ROW]
[ROW][C]15[/C][C]6.46[/C][C]7.42139583333333[/C][C]-0.961395833333333[/C][/ROW]
[ROW][C]16[/C][C]6.519[/C][C]7.42139583333333[/C][C]-0.902395833333333[/C][/ROW]
[ROW][C]17[/C][C]6.542[/C][C]7.42139583333333[/C][C]-0.879395833333333[/C][/ROW]
[ROW][C]18[/C][C]6.637[/C][C]7.42139583333333[/C][C]-0.784395833333334[/C][/ROW]
[ROW][C]19[/C][C]7.114[/C][C]7.42139583333333[/C][C]-0.307395833333333[/C][/ROW]
[ROW][C]20[/C][C]7.579[/C][C]7.42139583333333[/C][C]0.157604166666667[/C][/ROW]
[ROW][C]21[/C][C]7.408[/C][C]7.42139583333333[/C][C]-0.0133958333333328[/C][/ROW]
[ROW][C]22[/C][C]8.243[/C][C]7.42139583333333[/C][C]0.821604166666667[/C][/ROW]
[ROW][C]23[/C][C]8.243[/C][C]7.42139583333333[/C][C]0.821604166666667[/C][/ROW]
[ROW][C]24[/C][C]8.434[/C][C]7.42139583333333[/C][C]1.01260416666667[/C][/ROW]
[ROW][C]25[/C][C]8.576[/C][C]7.42139583333333[/C][C]1.15460416666667[/C][/ROW]
[ROW][C]26[/C][C]8.58[/C][C]7.42139583333333[/C][C]1.15860416666667[/C][/ROW]
[ROW][C]27[/C][C]8.645[/C][C]7.42139583333333[/C][C]1.22360416666667[/C][/ROW]
[ROW][C]28[/C][C]8.66[/C][C]7.42139583333333[/C][C]1.23860416666667[/C][/ROW]
[ROW][C]29[/C][C]8.72[/C][C]7.42139583333333[/C][C]1.29860416666667[/C][/ROW]
[ROW][C]30[/C][C]8.787[/C][C]7.42139583333333[/C][C]1.36560416666667[/C][/ROW]
[ROW][C]31[/C][C]9.162[/C][C]7.42139583333333[/C][C]1.74060416666667[/C][/ROW]
[ROW][C]32[/C][C]9.144[/C][C]7.42139583333333[/C][C]1.72260416666667[/C][/ROW]
[ROW][C]33[/C][C]8.806[/C][C]7.42139583333333[/C][C]1.38460416666667[/C][/ROW]
[ROW][C]34[/C][C]8.778[/C][C]7.42139583333333[/C][C]1.35660416666667[/C][/ROW]
[ROW][C]35[/C][C]8.66[/C][C]7.42139583333333[/C][C]1.23860416666667[/C][/ROW]
[ROW][C]36[/C][C]8.826[/C][C]7.42139583333333[/C][C]1.40460416666667[/C][/ROW]
[ROW][C]37[/C][C]8.609[/C][C]8.61041666666667[/C][C]-0.00141666666666670[/C][/ROW]
[ROW][C]38[/C][C]8.628[/C][C]8.61041666666667[/C][C]0.0175833333333334[/C][/ROW]
[ROW][C]39[/C][C]8.619[/C][C]8.61041666666667[/C][C]0.00858333333333309[/C][/ROW]
[ROW][C]40[/C][C]8.775[/C][C]8.61041666666667[/C][C]0.164583333333334[/C][/ROW]
[ROW][C]41[/C][C]8.84[/C][C]8.61041666666667[/C][C]0.229583333333333[/C][/ROW]
[ROW][C]42[/C][C]8.745[/C][C]8.61041666666667[/C][C]0.134583333333333[/C][/ROW]
[ROW][C]43[/C][C]9.092[/C][C]8.61041666666667[/C][C]0.481583333333334[/C][/ROW]
[ROW][C]44[/C][C]8.934[/C][C]8.61041666666667[/C][C]0.323583333333333[/C][/ROW]
[ROW][C]45[/C][C]8.749[/C][C]8.61041666666667[/C][C]0.138583333333334[/C][/ROW]
[ROW][C]46[/C][C]8.298[/C][C]8.61041666666667[/C][C]-0.312416666666667[/C][/ROW]
[ROW][C]47[/C][C]8.067[/C][C]8.61041666666667[/C][C]-0.543416666666666[/C][/ROW]
[ROW][C]48[/C][C]7.969[/C][C]8.61041666666667[/C][C]-0.641416666666666[/C][/ROW]
[ROW][C]49[/C][C]7.999[/C][C]7.42139583333333[/C][C]0.577604166666666[/C][/ROW]
[ROW][C]50[/C][C]7.865[/C][C]7.42139583333333[/C][C]0.443604166666667[/C][/ROW]
[ROW][C]51[/C][C]7.746[/C][C]7.42139583333333[/C][C]0.324604166666667[/C][/ROW]
[ROW][C]52[/C][C]7.633[/C][C]7.42139583333333[/C][C]0.211604166666667[/C][/ROW]
[ROW][C]53[/C][C]7.458[/C][C]7.42139583333333[/C][C]0.036604166666667[/C][/ROW]
[ROW][C]54[/C][C]7.391[/C][C]7.42139583333333[/C][C]-0.0303958333333332[/C][/ROW]
[ROW][C]55[/C][C]7.856[/C][C]7.42139583333333[/C][C]0.434604166666667[/C][/ROW]
[ROW][C]56[/C][C]7.72[/C][C]7.42139583333333[/C][C]0.298604166666667[/C][/ROW]
[ROW][C]57[/C][C]7.297[/C][C]7.42139583333333[/C][C]-0.124395833333333[/C][/ROW]
[ROW][C]58[/C][C]7.123[/C][C]7.42139583333333[/C][C]-0.298395833333333[/C][/ROW]
[ROW][C]59[/C][C]7.004[/C][C]7.42139583333333[/C][C]-0.417395833333334[/C][/ROW]
[ROW][C]60[/C][C]7.151[/C][C]7.42139583333333[/C][C]-0.270395833333333[/C][/ROW]
[/TABLE]
Source: https://freestatistics.org/blog/index.php?pk=25175&T=4

Globally Unique Identifier (entire table): ba.freestatistics.org/blog/index.php?pk=25175&T=4

As an alternative you can also use a QR Code:  

The GUIDs for individual cells are displayed in the table below:

Multiple Linear Regression - Actuals, Interpolation, and Residuals
Time or IndexActualsInterpolationForecastResidualsPrediction Error
16.067.42139583333334-1.36139583333334
25.9837.42139583333333-1.43839583333333
36.117.42139583333333-1.31139583333333
46.1437.42139583333333-1.27839583333333
56.0937.42139583333333-1.32839583333333
66.1487.42139583333333-1.27339583333333
76.4647.42139583333333-0.957395833333333
86.5327.42139583333333-0.889395833333333
96.3217.42139583333333-1.10039583333333
106.237.42139583333333-1.19139583333333
116.1767.42139583333333-1.24539583333333
126.3387.42139583333333-1.08339583333333
136.4627.42139583333333-0.959395833333333
146.4017.42139583333333-1.02039583333333
156.467.42139583333333-0.961395833333333
166.5197.42139583333333-0.902395833333333
176.5427.42139583333333-0.879395833333333
186.6377.42139583333333-0.784395833333334
197.1147.42139583333333-0.307395833333333
207.5797.421395833333330.157604166666667
217.4087.42139583333333-0.0133958333333328
228.2437.421395833333330.821604166666667
238.2437.421395833333330.821604166666667
248.4347.421395833333331.01260416666667
258.5767.421395833333331.15460416666667
268.587.421395833333331.15860416666667
278.6457.421395833333331.22360416666667
288.667.421395833333331.23860416666667
298.727.421395833333331.29860416666667
308.7877.421395833333331.36560416666667
319.1627.421395833333331.74060416666667
329.1447.421395833333331.72260416666667
338.8067.421395833333331.38460416666667
348.7787.421395833333331.35660416666667
358.667.421395833333331.23860416666667
368.8267.421395833333331.40460416666667
378.6098.61041666666667-0.00141666666666670
388.6288.610416666666670.0175833333333334
398.6198.610416666666670.00858333333333309
408.7758.610416666666670.164583333333334
418.848.610416666666670.229583333333333
428.7458.610416666666670.134583333333333
439.0928.610416666666670.481583333333334
448.9348.610416666666670.323583333333333
458.7498.610416666666670.138583333333334
468.2988.61041666666667-0.312416666666667
478.0678.61041666666667-0.543416666666666
487.9698.61041666666667-0.641416666666666
497.9997.421395833333330.577604166666666
507.8657.421395833333330.443604166666667
517.7467.421395833333330.324604166666667
527.6337.421395833333330.211604166666667
537.4587.421395833333330.036604166666667
547.3917.42139583333333-0.0303958333333332
557.8567.421395833333330.434604166666667
567.727.421395833333330.298604166666667
577.2977.42139583333333-0.124395833333333
587.1237.42139583333333-0.298395833333333
597.0047.42139583333333-0.417395833333334
607.1517.42139583333333-0.270395833333333


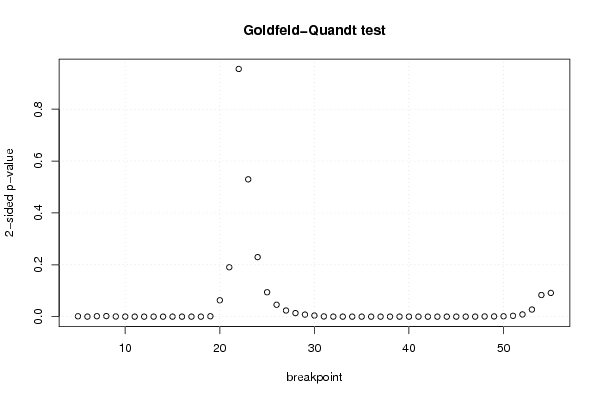
Goldfeld-Quandt test for Heteroskedasticity
p-valuesAlternative Hypothesis
breakpoint indexgreater2-sidedless
50.0007293033207814050.001458606641562810.999270696679219
68.53225654734756e-050.0001706451309469510.999914677434527
70.0008616456750073570.001723291350014710.999138354324993
80.001106611669795440.002213223339590870.998893388330205
90.0003483022335637040.0006966044671274090.999651697766436
109.83775596114345e-050.0001967551192228690.999901622440389
112.99110501428187e-055.98221002856375e-050.999970088949857
121.15244890995809e-052.30489781991619e-050.9999884755109
138.43667213359124e-061.68733442671825e-050.999991563327866
144.64397457909453e-069.28794915818906e-060.99999535602542
153.6542585501047e-067.3085171002094e-060.99999634574145
164.25735022231233e-068.51470044462466e-060.999995742649778
176.11560539018928e-061.22312107803786e-050.99999388439461
181.61278511562244e-053.22557023124489e-050.999983872148844
190.0007478727077496010.001495745415499200.99925212729225
200.03161665662543520.06323331325087040.968383343374565
210.09520081239885370.1904016247977070.904799187601146
220.4775584874251370.9551169748502740.522441512574863
230.7352408268986290.5295183462027430.264759173101371
240.8852062390308580.2295875219382840.114793760969142
250.9529449407671460.09411011846570770.0470550592328538
260.9770469015607870.04590619687842550.0229530984392128
270.9881450009030070.02370999819398520.0118549990969926
280.9931469506268060.01370609874638890.00685304937319445
290.9960321540007470.00793569199850640.0039678459992532
300.9978306085854780.004338782829044720.00216939141452236
310.9995636293450240.0008727413099510980.000436370654975549
320.9999358349003970.0001283301992066266.41650996033129e-05
330.9999783520505814.32958988379212e-052.16479494189606e-05
340.9999945147309151.09705381700253e-055.48526908501263e-06
350.9999986909148482.61817030399621e-061.30908515199810e-06
360.999999976325194.73496198879978e-082.36748099439989e-08
370.999999913900361.72199279158234e-078.60996395791169e-08
380.9999996985896456.02820710594317e-073.01410355297158e-07
390.9999989827476252.03450475011009e-061.01725237505504e-06
400.9999970195019845.96099603097202e-062.98049801548601e-06
410.9999925429783821.49140432357085e-057.45702161785424e-06
420.999979907879194.01842416212849e-052.00921208106425e-05
430.9999826301227583.47397544844124e-051.73698772422062e-05
440.9999845531156663.08937686680909e-051.54468843340455e-05
450.999985622373722.87552525604619e-051.43776262802310e-05
460.999960785215547.84295689187456e-053.92147844593728e-05
470.9998735346335120.0002529307329756910.000126465366487845
480.9996026790430150.000794641913969350.000397320956984675
490.9995327708304480.0009344583391042480.000467229169552124
500.9992441074092450.001511785181510070.000755892590755034
510.9983890580873960.003221883825207890.00161094191260395
520.995727388355880.008545223288239740.00427261164411987
530.9862795090417280.02744098191654350.0137204909582718
540.9583407687863720.08331846242725570.0416592312136279
550.9542681248577460.09146375028450820.0457318751422541

\begin{tabular}{lllllllll}
\hline
Goldfeld-Quandt test for Heteroskedasticity \tabularnewline
p-values & Alternative Hypothesis \tabularnewline
breakpoint index & greater & 2-sided & less \tabularnewline
5 & 0.000729303320781405 & 0.00145860664156281 & 0.999270696679219 \tabularnewline
6 & 8.53225654734756e-05 & 0.000170645130946951 & 0.999914677434527 \tabularnewline
7 & 0.000861645675007357 & 0.00172329135001471 & 0.999138354324993 \tabularnewline
8 & 0.00110661166979544 & 0.00221322333959087 & 0.998893388330205 \tabularnewline
9 & 0.000348302233563704 & 0.000696604467127409 & 0.999651697766436 \tabularnewline
10 & 9.83775596114345e-05 & 0.000196755119222869 & 0.999901622440389 \tabularnewline
11 & 2.99110501428187e-05 & 5.98221002856375e-05 & 0.999970088949857 \tabularnewline
12 & 1.15244890995809e-05 & 2.30489781991619e-05 & 0.9999884755109 \tabularnewline
13 & 8.43667213359124e-06 & 1.68733442671825e-05 & 0.999991563327866 \tabularnewline
14 & 4.64397457909453e-06 & 9.28794915818906e-06 & 0.99999535602542 \tabularnewline
15 & 3.6542585501047e-06 & 7.3085171002094e-06 & 0.99999634574145 \tabularnewline
16 & 4.25735022231233e-06 & 8.51470044462466e-06 & 0.999995742649778 \tabularnewline
17 & 6.11560539018928e-06 & 1.22312107803786e-05 & 0.99999388439461 \tabularnewline
18 & 1.61278511562244e-05 & 3.22557023124489e-05 & 0.999983872148844 \tabularnewline
19 & 0.000747872707749601 & 0.00149574541549920 & 0.99925212729225 \tabularnewline
20 & 0.0316166566254352 & 0.0632333132508704 & 0.968383343374565 \tabularnewline
21 & 0.0952008123988537 & 0.190401624797707 & 0.904799187601146 \tabularnewline
22 & 0.477558487425137 & 0.955116974850274 & 0.522441512574863 \tabularnewline
23 & 0.735240826898629 & 0.529518346202743 & 0.264759173101371 \tabularnewline
24 & 0.885206239030858 & 0.229587521938284 & 0.114793760969142 \tabularnewline
25 & 0.952944940767146 & 0.0941101184657077 & 0.0470550592328538 \tabularnewline
26 & 0.977046901560787 & 0.0459061968784255 & 0.0229530984392128 \tabularnewline
27 & 0.988145000903007 & 0.0237099981939852 & 0.0118549990969926 \tabularnewline
28 & 0.993146950626806 & 0.0137060987463889 & 0.00685304937319445 \tabularnewline
29 & 0.996032154000747 & 0.0079356919985064 & 0.0039678459992532 \tabularnewline
30 & 0.997830608585478 & 0.00433878282904472 & 0.00216939141452236 \tabularnewline
31 & 0.999563629345024 & 0.000872741309951098 & 0.000436370654975549 \tabularnewline
32 & 0.999935834900397 & 0.000128330199206626 & 6.41650996033129e-05 \tabularnewline
33 & 0.999978352050581 & 4.32958988379212e-05 & 2.16479494189606e-05 \tabularnewline
34 & 0.999994514730915 & 1.09705381700253e-05 & 5.48526908501263e-06 \tabularnewline
35 & 0.999998690914848 & 2.61817030399621e-06 & 1.30908515199810e-06 \tabularnewline
36 & 0.99999997632519 & 4.73496198879978e-08 & 2.36748099439989e-08 \tabularnewline
37 & 0.99999991390036 & 1.72199279158234e-07 & 8.60996395791169e-08 \tabularnewline
38 & 0.999999698589645 & 6.02820710594317e-07 & 3.01410355297158e-07 \tabularnewline
39 & 0.999998982747625 & 2.03450475011009e-06 & 1.01725237505504e-06 \tabularnewline
40 & 0.999997019501984 & 5.96099603097202e-06 & 2.98049801548601e-06 \tabularnewline
41 & 0.999992542978382 & 1.49140432357085e-05 & 7.45702161785424e-06 \tabularnewline
42 & 0.99997990787919 & 4.01842416212849e-05 & 2.00921208106425e-05 \tabularnewline
43 & 0.999982630122758 & 3.47397544844124e-05 & 1.73698772422062e-05 \tabularnewline
44 & 0.999984553115666 & 3.08937686680909e-05 & 1.54468843340455e-05 \tabularnewline
45 & 0.99998562237372 & 2.87552525604619e-05 & 1.43776262802310e-05 \tabularnewline
46 & 0.99996078521554 & 7.84295689187456e-05 & 3.92147844593728e-05 \tabularnewline
47 & 0.999873534633512 & 0.000252930732975691 & 0.000126465366487845 \tabularnewline
48 & 0.999602679043015 & 0.00079464191396935 & 0.000397320956984675 \tabularnewline
49 & 0.999532770830448 & 0.000934458339104248 & 0.000467229169552124 \tabularnewline
50 & 0.999244107409245 & 0.00151178518151007 & 0.000755892590755034 \tabularnewline
51 & 0.998389058087396 & 0.00322188382520789 & 0.00161094191260395 \tabularnewline
52 & 0.99572738835588 & 0.00854522328823974 & 0.00427261164411987 \tabularnewline
53 & 0.986279509041728 & 0.0274409819165435 & 0.0137204909582718 \tabularnewline
54 & 0.958340768786372 & 0.0833184624272557 & 0.0416592312136279 \tabularnewline
55 & 0.954268124857746 & 0.0914637502845082 & 0.0457318751422541 \tabularnewline
\hline
\end{tabular}
%Source: https://freestatistics.org/blog/index.php?pk=25175&T=5

[TABLE]
[ROW][C]Goldfeld-Quandt test for Heteroskedasticity[/C][/ROW]
[ROW][C]p-values[/C][C]Alternative Hypothesis[/C][/ROW]
[ROW][C]breakpoint index[/C][C]greater[/C][C]2-sided[/C][C]less[/C][/ROW]
[ROW][C]5[/C][C]0.000729303320781405[/C][C]0.00145860664156281[/C][C]0.999270696679219[/C][/ROW]
[ROW][C]6[/C][C]8.53225654734756e-05[/C][C]0.000170645130946951[/C][C]0.999914677434527[/C][/ROW]
[ROW][C]7[/C][C]0.000861645675007357[/C][C]0.00172329135001471[/C][C]0.999138354324993[/C][/ROW]
[ROW][C]8[/C][C]0.00110661166979544[/C][C]0.00221322333959087[/C][C]0.998893388330205[/C][/ROW]
[ROW][C]9[/C][C]0.000348302233563704[/C][C]0.000696604467127409[/C][C]0.999651697766436[/C][/ROW]
[ROW][C]10[/C][C]9.83775596114345e-05[/C][C]0.000196755119222869[/C][C]0.999901622440389[/C][/ROW]
[ROW][C]11[/C][C]2.99110501428187e-05[/C][C]5.98221002856375e-05[/C][C]0.999970088949857[/C][/ROW]
[ROW][C]12[/C][C]1.15244890995809e-05[/C][C]2.30489781991619e-05[/C][C]0.9999884755109[/C][/ROW]
[ROW][C]13[/C][C]8.43667213359124e-06[/C][C]1.68733442671825e-05[/C][C]0.999991563327866[/C][/ROW]
[ROW][C]14[/C][C]4.64397457909453e-06[/C][C]9.28794915818906e-06[/C][C]0.99999535602542[/C][/ROW]
[ROW][C]15[/C][C]3.6542585501047e-06[/C][C]7.3085171002094e-06[/C][C]0.99999634574145[/C][/ROW]
[ROW][C]16[/C][C]4.25735022231233e-06[/C][C]8.51470044462466e-06[/C][C]0.999995742649778[/C][/ROW]
[ROW][C]17[/C][C]6.11560539018928e-06[/C][C]1.22312107803786e-05[/C][C]0.99999388439461[/C][/ROW]
[ROW][C]18[/C][C]1.61278511562244e-05[/C][C]3.22557023124489e-05[/C][C]0.999983872148844[/C][/ROW]
[ROW][C]19[/C][C]0.000747872707749601[/C][C]0.00149574541549920[/C][C]0.99925212729225[/C][/ROW]
[ROW][C]20[/C][C]0.0316166566254352[/C][C]0.0632333132508704[/C][C]0.968383343374565[/C][/ROW]
[ROW][C]21[/C][C]0.0952008123988537[/C][C]0.190401624797707[/C][C]0.904799187601146[/C][/ROW]
[ROW][C]22[/C][C]0.477558487425137[/C][C]0.955116974850274[/C][C]0.522441512574863[/C][/ROW]
[ROW][C]23[/C][C]0.735240826898629[/C][C]0.529518346202743[/C][C]0.264759173101371[/C][/ROW]
[ROW][C]24[/C][C]0.885206239030858[/C][C]0.229587521938284[/C][C]0.114793760969142[/C][/ROW]
[ROW][C]25[/C][C]0.952944940767146[/C][C]0.0941101184657077[/C][C]0.0470550592328538[/C][/ROW]
[ROW][C]26[/C][C]0.977046901560787[/C][C]0.0459061968784255[/C][C]0.0229530984392128[/C][/ROW]
[ROW][C]27[/C][C]0.988145000903007[/C][C]0.0237099981939852[/C][C]0.0118549990969926[/C][/ROW]
[ROW][C]28[/C][C]0.993146950626806[/C][C]0.0137060987463889[/C][C]0.00685304937319445[/C][/ROW]
[ROW][C]29[/C][C]0.996032154000747[/C][C]0.0079356919985064[/C][C]0.0039678459992532[/C][/ROW]
[ROW][C]30[/C][C]0.997830608585478[/C][C]0.00433878282904472[/C][C]0.00216939141452236[/C][/ROW]
[ROW][C]31[/C][C]0.999563629345024[/C][C]0.000872741309951098[/C][C]0.000436370654975549[/C][/ROW]
[ROW][C]32[/C][C]0.999935834900397[/C][C]0.000128330199206626[/C][C]6.41650996033129e-05[/C][/ROW]
[ROW][C]33[/C][C]0.999978352050581[/C][C]4.32958988379212e-05[/C][C]2.16479494189606e-05[/C][/ROW]
[ROW][C]34[/C][C]0.999994514730915[/C][C]1.09705381700253e-05[/C][C]5.48526908501263e-06[/C][/ROW]
[ROW][C]35[/C][C]0.999998690914848[/C][C]2.61817030399621e-06[/C][C]1.30908515199810e-06[/C][/ROW]
[ROW][C]36[/C][C]0.99999997632519[/C][C]4.73496198879978e-08[/C][C]2.36748099439989e-08[/C][/ROW]
[ROW][C]37[/C][C]0.99999991390036[/C][C]1.72199279158234e-07[/C][C]8.60996395791169e-08[/C][/ROW]
[ROW][C]38[/C][C]0.999999698589645[/C][C]6.02820710594317e-07[/C][C]3.01410355297158e-07[/C][/ROW]
[ROW][C]39[/C][C]0.999998982747625[/C][C]2.03450475011009e-06[/C][C]1.01725237505504e-06[/C][/ROW]
[ROW][C]40[/C][C]0.999997019501984[/C][C]5.96099603097202e-06[/C][C]2.98049801548601e-06[/C][/ROW]
[ROW][C]41[/C][C]0.999992542978382[/C][C]1.49140432357085e-05[/C][C]7.45702161785424e-06[/C][/ROW]
[ROW][C]42[/C][C]0.99997990787919[/C][C]4.01842416212849e-05[/C][C]2.00921208106425e-05[/C][/ROW]
[ROW][C]43[/C][C]0.999982630122758[/C][C]3.47397544844124e-05[/C][C]1.73698772422062e-05[/C][/ROW]
[ROW][C]44[/C][C]0.999984553115666[/C][C]3.08937686680909e-05[/C][C]1.54468843340455e-05[/C][/ROW]
[ROW][C]45[/C][C]0.99998562237372[/C][C]2.87552525604619e-05[/C][C]1.43776262802310e-05[/C][/ROW]
[ROW][C]46[/C][C]0.99996078521554[/C][C]7.84295689187456e-05[/C][C]3.92147844593728e-05[/C][/ROW]
[ROW][C]47[/C][C]0.999873534633512[/C][C]0.000252930732975691[/C][C]0.000126465366487845[/C][/ROW]
[ROW][C]48[/C][C]0.999602679043015[/C][C]0.00079464191396935[/C][C]0.000397320956984675[/C][/ROW]
[ROW][C]49[/C][C]0.999532770830448[/C][C]0.000934458339104248[/C][C]0.000467229169552124[/C][/ROW]
[ROW][C]50[/C][C]0.999244107409245[/C][C]0.00151178518151007[/C][C]0.000755892590755034[/C][/ROW]
[ROW][C]51[/C][C]0.998389058087396[/C][C]0.00322188382520789[/C][C]0.00161094191260395[/C][/ROW]
[ROW][C]52[/C][C]0.99572738835588[/C][C]0.00854522328823974[/C][C]0.00427261164411987[/C][/ROW]
[ROW][C]53[/C][C]0.986279509041728[/C][C]0.0274409819165435[/C][C]0.0137204909582718[/C][/ROW]
[ROW][C]54[/C][C]0.958340768786372[/C][C]0.0833184624272557[/C][C]0.0416592312136279[/C][/ROW]
[ROW][C]55[/C][C]0.954268124857746[/C][C]0.0914637502845082[/C][C]0.0457318751422541[/C][/ROW]
[/TABLE]
Source: https://freestatistics.org/blog/index.php?pk=25175&T=5

Globally Unique Identifier (entire table): ba.freestatistics.org/blog/index.php?pk=25175&T=5

As an alternative you can also use a QR Code:  

The GUIDs for individual cells are displayed in the table below:

Goldfeld-Quandt test for Heteroskedasticity
p-valuesAlternative Hypothesis
breakpoint indexgreater2-sidedless
50.0007293033207814050.001458606641562810.999270696679219
68.53225654734756e-050.0001706451309469510.999914677434527
70.0008616456750073570.001723291350014710.999138354324993
80.001106611669795440.002213223339590870.998893388330205
90.0003483022335637040.0006966044671274090.999651697766436
109.83775596114345e-050.0001967551192228690.999901622440389
112.99110501428187e-055.98221002856375e-050.999970088949857
121.15244890995809e-052.30489781991619e-050.9999884755109
138.43667213359124e-061.68733442671825e-050.999991563327866
144.64397457909453e-069.28794915818906e-060.99999535602542
153.6542585501047e-067.3085171002094e-060.99999634574145
164.25735022231233e-068.51470044462466e-060.999995742649778
176.11560539018928e-061.22312107803786e-050.99999388439461
181.61278511562244e-053.22557023124489e-050.999983872148844
190.0007478727077496010.001495745415499200.99925212729225
200.03161665662543520.06323331325087040.968383343374565
210.09520081239885370.1904016247977070.904799187601146
220.4775584874251370.9551169748502740.522441512574863
230.7352408268986290.5295183462027430.264759173101371
240.8852062390308580.2295875219382840.114793760969142
250.9529449407671460.09411011846570770.0470550592328538
260.9770469015607870.04590619687842550.0229530984392128
270.9881450009030070.02370999819398520.0118549990969926
280.9931469506268060.01370609874638890.00685304937319445
290.9960321540007470.00793569199850640.0039678459992532
300.9978306085854780.004338782829044720.00216939141452236
310.9995636293450240.0008727413099510980.000436370654975549
320.9999358349003970.0001283301992066266.41650996033129e-05
330.9999783520505814.32958988379212e-052.16479494189606e-05
340.9999945147309151.09705381700253e-055.48526908501263e-06
350.9999986909148482.61817030399621e-061.30908515199810e-06
360.999999976325194.73496198879978e-082.36748099439989e-08
370.999999913900361.72199279158234e-078.60996395791169e-08
380.9999996985896456.02820710594317e-073.01410355297158e-07
390.9999989827476252.03450475011009e-061.01725237505504e-06
400.9999970195019845.96099603097202e-062.98049801548601e-06
410.9999925429783821.49140432357085e-057.45702161785424e-06
420.999979907879194.01842416212849e-052.00921208106425e-05
430.9999826301227583.47397544844124e-051.73698772422062e-05
440.9999845531156663.08937686680909e-051.54468843340455e-05
450.999985622373722.87552525604619e-051.43776262802310e-05
460.999960785215547.84295689187456e-053.92147844593728e-05
470.9998735346335120.0002529307329756910.000126465366487845
480.9996026790430150.000794641913969350.000397320956984675
490.9995327708304480.0009344583391042480.000467229169552124
500.9992441074092450.001511785181510070.000755892590755034
510.9983890580873960.003221883825207890.00161094191260395
520.995727388355880.008545223288239740.00427261164411987
530.9862795090417280.02744098191654350.0137204909582718
540.9583407687863720.08331846242725570.0416592312136279
550.9542681248577460.09146375028450820.0457318751422541


Meta Analysis of Goldfeld-Quandt test for Heteroskedasticity
Description# significant tests% significant testsOK/NOK
1% type I error level390.764705882352941NOK
5% type I error level430.84313725490196NOK
10% type I error level470.92156862745098NOK

\begin{tabular}{lllllllll}
\hline
Meta Analysis of Goldfeld-Quandt test for Heteroskedasticity \tabularnewline
Description & # significant tests & % significant tests & OK/NOK \tabularnewline
1% type I error level & 39 & 0.764705882352941 & NOK \tabularnewline
5% type I error level & 43 & 0.84313725490196 & NOK \tabularnewline
10% type I error level & 47 & 0.92156862745098 & NOK \tabularnewline
\hline
\end{tabular}
%Source: https://freestatistics.org/blog/index.php?pk=25175&T=6

[TABLE]
[ROW][C]Meta Analysis of Goldfeld-Quandt test for Heteroskedasticity[/C][/ROW]
[ROW][C]Description[/C][C]# significant tests[/C][C]% significant tests[/C][C]OK/NOK[/C][/ROW]
[ROW][C]1% type I error level[/C][C]39[/C][C]0.764705882352941[/C][C]NOK[/C][/ROW]
[ROW][C]5% type I error level[/C][C]43[/C][C]0.84313725490196[/C][C]NOK[/C][/ROW]
[ROW][C]10% type I error level[/C][C]47[/C][C]0.92156862745098[/C][C]NOK[/C][/ROW]
[/TABLE]
Source: https://freestatistics.org/blog/index.php?pk=25175&T=6

Globally Unique Identifier (entire table): ba.freestatistics.org/blog/index.php?pk=25175&T=6

As an alternative you can also use a QR Code:  

The GUIDs for individual cells are displayed in the table below:

Meta Analysis of Goldfeld-Quandt test for Heteroskedasticity
Description# significant tests% significant testsOK/NOK
1% type I error level390.764705882352941NOK
5% type I error level430.84313725490196NOK
10% type I error level470.92156862745098NOK


Parameters (Session):
par1 = 1 ; par2 = Do not include Seasonal Dummies ; par3 = No Linear Trend ;
Parameters (R input):
par1 = 1 ; par2 = Do not include Seasonal Dummies ; par3 = No Linear Trend ;
R code (references can be found in the software module):
library(lattice)
library(lmtest)
n25 <- 25 #minimum number of obs. for Goldfeld-Quandt test
par1 <- as.numeric(par1)
x <- t(y)
k <- length(x[1,])
n <- length(x[,1])
x1 <- cbind(x[,par1], x[,1:k!=par1])
mycolnames <- c(colnames(x)[par1], colnames(x)[1:k!=par1])
colnames(x1) <- mycolnames #colnames(x)[par1]
x <- x1
if (par3 == 'First Differences'){
x2 <- array(0, dim=c(n-1,k), dimnames=list(1:(n-1), paste('(1-B)',colnames(x),sep='')))
for (i in 1:n-1) {
for (j in 1:k) {
x2[i,j] <- x[i+1,j] - x[i,j]
}
}
x <- x2
}
if (par2 == 'Include Monthly Dummies'){
x2 <- array(0, dim=c(n,11), dimnames=list(1:n, paste('M', seq(1:11), sep ='')))
for (i in 1:11){
x2[seq(i,n,12),i] <- 1
}
x <- cbind(x, x2)
}
if (par2 == 'Include Quarterly Dummies'){
x2 <- array(0, dim=c(n,3), dimnames=list(1:n, paste('Q', seq(1:3), sep ='')))
for (i in 1:3){
x2[seq(i,n,4),i] <- 1
}
x <- cbind(x, x2)
}
k <- length(x[1,])
if (par3 == 'Linear Trend'){
x <- cbind(x, c(1:n))
colnames(x)[k+1] <- 't'
}
x
k <- length(x[1,])
df <- as.data.frame(x)
(mylm <- lm(df))
(mysum <- summary(mylm))
if (n > n25) {
kp3 <- k + 3
nmkm3 <- n - k - 3
gqarr <- array(NA, dim=c(nmkm3-kp3+1,3))
numgqtests <- 0
numsignificant1 <- 0
numsignificant5 <- 0
numsignificant10 <- 0
for (mypoint in kp3:nmkm3) {
j <- 0
numgqtests <- numgqtests + 1
for (myalt in c('greater', 'two.sided', 'less')) {
j <- j + 1
gqarr[mypoint-kp3+1,j] <- gqtest(mylm, point=mypoint, alternative=myalt)$p.value
}
if (gqarr[mypoint-kp3+1,2] < 0.01) numsignificant1 <- numsignificant1 + 1
if (gqarr[mypoint-kp3+1,2] < 0.05) numsignificant5 <- numsignificant5 + 1
if (gqarr[mypoint-kp3+1,2] < 0.10) numsignificant10 <- numsignificant10 + 1
}
gqarr
}
bitmap(file='test0.png')
plot(x[,1], type='l', main='Actuals and Interpolation', ylab='value of Actuals and Interpolation (dots)', xlab='time or index')
points(x[,1]-mysum$resid)
grid()
dev.off()
bitmap(file='test1.png')
plot(mysum$resid, type='b', pch=19, main='Residuals', ylab='value of Residuals', xlab='time or index')
grid()
dev.off()
bitmap(file='test2.png')
hist(mysum$resid, main='Residual Histogram', xlab='values of Residuals')
grid()
dev.off()
bitmap(file='test3.png')
densityplot(~mysum$resid,col='black',main='Residual Density Plot', xlab='values of Residuals')
dev.off()
bitmap(file='test4.png')
qqnorm(mysum$resid, main='Residual Normal Q-Q Plot')
qqline(mysum$resid)
grid()
dev.off()
(myerror <- as.ts(mysum$resid))
bitmap(file='test5.png')
dum <- cbind(lag(myerror,k=1),myerror)
dum
dum1 <- dum[2:length(myerror),]
dum1
z <- as.data.frame(dum1)
z
plot(z,main=paste('Residual Lag plot, lowess, and regression line'), ylab='values of Residuals', xlab='lagged values of Residuals')
lines(lowess(z))
abline(lm(z))
grid()
dev.off()
bitmap(file='test6.png')
acf(mysum$resid, lag.max=length(mysum$resid)/2, main='Residual Autocorrelation Function')
grid()
dev.off()
bitmap(file='test7.png')
pacf(mysum$resid, lag.max=length(mysum$resid)/2, main='Residual Partial Autocorrelation Function')
grid()
dev.off()
bitmap(file='test8.png')
opar <- par(mfrow = c(2,2), oma = c(0, 0, 1.1, 0))
plot(mylm, las = 1, sub='Residual Diagnostics')
par(opar)
dev.off()
if (n > n25) {
bitmap(file='test9.png')
plot(kp3:nmkm3,gqarr[,2], main='Goldfeld-Quandt test',ylab='2-sided p-value',xlab='breakpoint')
grid()
dev.off()
}
load(file='createtable')
a<-table.start()
a<-table.row.start(a)
a<-table.element(a, 'Multiple Linear Regression - Estimated Regression Equation', 1, TRUE)
a<-table.row.end(a)
myeq <- colnames(x)[1]
myeq <- paste(myeq, '[t] = ', sep='')
for (i in 1:k){
if (mysum$coefficients[i,1] > 0) myeq <- paste(myeq, '+', '')
myeq <- paste(myeq, mysum$coefficients[i,1], sep=' ')
if (rownames(mysum$coefficients)[i] != '(Intercept)') {
myeq <- paste(myeq, rownames(mysum$coefficients)[i], sep='')
if (rownames(mysum$coefficients)[i] != 't') myeq <- paste(myeq, '[t]', sep='')
}
}
myeq <- paste(myeq, ' + e[t]')
a<-table.row.start(a)
a<-table.element(a, myeq)
a<-table.row.end(a)
a<-table.end(a)
table.save(a,file='mytable1.tab')
a<-table.start()
a<-table.row.start(a)
a<-table.element(a,hyperlink('ols1.htm','Multiple Linear Regression - Ordinary Least Squares',''), 6, TRUE)
a<-table.row.end(a)
a<-table.row.start(a)
a<-table.element(a,'Variable',header=TRUE)
a<-table.element(a,'Parameter',header=TRUE)
a<-table.element(a,'S.D.',header=TRUE)
a<-table.element(a,'T-STAT
H0: parameter = 0',header=TRUE)
a<-table.element(a,'2-tail p-value',header=TRUE)
a<-table.element(a,'1-tail p-value',header=TRUE)
a<-table.row.end(a)
for (i in 1:k){
a<-table.row.start(a)
a<-table.element(a,rownames(mysum$coefficients)[i],header=TRUE)
a<-table.element(a,mysum$coefficients[i,1])
a<-table.element(a, round(mysum$coefficients[i,2],6))
a<-table.element(a, round(mysum$coefficients[i,3],4))
a<-table.element(a, round(mysum$coefficients[i,4],6))
a<-table.element(a, round(mysum$coefficients[i,4]/2,6))
a<-table.row.end(a)
}
a<-table.end(a)
table.save(a,file='mytable2.tab')
a<-table.start()
a<-table.row.start(a)
a<-table.element(a, 'Multiple Linear Regression - Regression Statistics', 2, TRUE)
a<-table.row.end(a)
a<-table.row.start(a)
a<-table.element(a, 'Multiple R',1,TRUE)
a<-table.element(a, sqrt(mysum$r.squared))
a<-table.row.end(a)
a<-table.row.start(a)
a<-table.element(a, 'R-squared',1,TRUE)
a<-table.element(a, mysum$r.squared)
a<-table.row.end(a)
a<-table.row.start(a)
a<-table.element(a, 'Adjusted R-squared',1,TRUE)
a<-table.element(a, mysum$adj.r.squared)
a<-table.row.end(a)
a<-table.row.start(a)
a<-table.element(a, 'F-TEST (value)',1,TRUE)
a<-table.element(a, mysum$fstatistic[1])
a<-table.row.end(a)
a<-table.row.start(a)
a<-table.element(a, 'F-TEST (DF numerator)',1,TRUE)
a<-table.element(a, mysum$fstatistic[2])
a<-table.row.end(a)
a<-table.row.start(a)
a<-table.element(a, 'F-TEST (DF denominator)',1,TRUE)
a<-table.element(a, mysum$fstatistic[3])
a<-table.row.end(a)
a<-table.row.start(a)
a<-table.element(a, 'p-value',1,TRUE)
a<-table.element(a, 1-pf(mysum$fstatistic[1],mysum$fstatistic[2],mysum$fstatistic[3]))
a<-table.row.end(a)
a<-table.row.start(a)
a<-table.element(a, 'Multiple Linear Regression - Residual Statistics', 2, TRUE)
a<-table.row.end(a)
a<-table.row.start(a)
a<-table.element(a, 'Residual Standard Deviation',1,TRUE)
a<-table.element(a, mysum$sigma)
a<-table.row.end(a)
a<-table.row.start(a)
a<-table.element(a, 'Sum Squared Residuals',1,TRUE)
a<-table.element(a, sum(myerror*myerror))
a<-table.row.end(a)
a<-table.end(a)
table.save(a,file='mytable3.tab')
a<-table.start()
a<-table.row.start(a)
a<-table.element(a, 'Multiple Linear Regression - Actuals, Interpolation, and Residuals', 4, TRUE)
a<-table.row.end(a)
a<-table.row.start(a)
a<-table.element(a, 'Time or Index', 1, TRUE)
a<-table.element(a, 'Actuals', 1, TRUE)
a<-table.element(a, 'Interpolation
Forecast', 1, TRUE)
a<-table.element(a, 'Residuals
Prediction Error', 1, TRUE)
a<-table.row.end(a)
for (i in 1:n) {
a<-table.row.start(a)
a<-table.element(a,i, 1, TRUE)
a<-table.element(a,x[i])
a<-table.element(a,x[i]-mysum$resid[i])
a<-table.element(a,mysum$resid[i])
a<-table.row.end(a)
}
a<-table.end(a)
table.save(a,file='mytable4.tab')
if (n > n25) {
a<-table.start()
a<-table.row.start(a)
a<-table.element(a,'Goldfeld-Quandt test for Heteroskedasticity',4,TRUE)
a<-table.row.end(a)
a<-table.row.start(a)
a<-table.element(a,'p-values',header=TRUE)
a<-table.element(a,'Alternative Hypothesis',3,header=TRUE)
a<-table.row.end(a)
a<-table.row.start(a)
a<-table.element(a,'breakpoint index',header=TRUE)
a<-table.element(a,'greater',header=TRUE)
a<-table.element(a,'2-sided',header=TRUE)
a<-table.element(a,'less',header=TRUE)
a<-table.row.end(a)
for (mypoint in kp3:nmkm3) {
a<-table.row.start(a)
a<-table.element(a,mypoint,header=TRUE)
a<-table.element(a,gqarr[mypoint-kp3+1,1])
a<-table.element(a,gqarr[mypoint-kp3+1,2])
a<-table.element(a,gqarr[mypoint-kp3+1,3])
a<-table.row.end(a)
}
a<-table.end(a)
table.save(a,file='mytable5.tab')
a<-table.start()
a<-table.row.start(a)
a<-table.element(a,'Meta Analysis of Goldfeld-Quandt test for Heteroskedasticity',4,TRUE)
a<-table.row.end(a)
a<-table.row.start(a)
a<-table.element(a,'Description',header=TRUE)
a<-table.element(a,'# significant tests',header=TRUE)
a<-table.element(a,'% significant tests',header=TRUE)
a<-table.element(a,'OK/NOK',header=TRUE)
a<-table.row.end(a)
a<-table.row.start(a)
a<-table.element(a,'1% type I error level',header=TRUE)
a<-table.element(a,numsignificant1)
a<-table.element(a,numsignificant1/numgqtests)
if (numsignificant1/numgqtests < 0.01) dum <- 'OK' else dum <- 'NOK'
a<-table.element(a,dum)
a<-table.row.end(a)
a<-table.row.start(a)
a<-table.element(a,'5% type I error level',header=TRUE)
a<-table.element(a,numsignificant5)
a<-table.element(a,numsignificant5/numgqtests)
if (numsignificant5/numgqtests < 0.05) dum <- 'OK' else dum <- 'NOK'
a<-table.element(a,dum)
a<-table.row.end(a)
a<-table.row.start(a)
a<-table.element(a,'10% type I error level',header=TRUE)
a<-table.element(a,numsignificant10)
a<-table.element(a,numsignificant10/numgqtests)
if (numsignificant10/numgqtests < 0.1) dum <- 'OK' else dum <- 'NOK'
a<-table.element(a,dum)
a<-table.row.end(a)
a<-table.end(a)
table.save(a,file='mytable6.tab')
}