Free Statistics

of Irreproducible Research!

Author's title

Author*The author of this computation has been verified*
R Software Modulerwasp_multipleregression.wasp
Title produced by softwareMultiple Regression
Date of computationWed, 19 Nov 2008 07:20:40 -0700
Cite this page as followsStatistical Computations at FreeStatistics.org, Office for Research Development and Education, URL https://freestatistics.org/blog/index.php?v=date/2008/Nov/19/t1227104480n5kz7njb4ehwbqa.htm/, Retrieved Sun, 19 May 2024 10:11:13 +0000
Statistical Computations at FreeStatistics.org, Office for Research Development and Education, URL https://freestatistics.org/blog/index.php?pk=25040, Retrieved Sun, 19 May 2024 10:11:13 +0000
QR Codes:

Original text written by user:
IsPrivate?No (this computation is public)
User-defined keywords
Estimated Impact198
Family? (F = Feedback message, R = changed R code, M = changed R Module, P = changed Parameters, D = changed Data)
F     [Multiple Regression] [Taak 6 - Q3 (2)] [2008-11-16 12:01:18] [46c5a5fbda57fdfa1d4ef48658f82a0c]
F    D    [Multiple Regression] [taak 6 Q 3, 2] [2008-11-19 14:20:40] [bda7fba231d49184c6a1b627868bbb81] [Current]
Feedback Forum
2008-12-01 17:58:45 [Stéphanie Claes] [reply
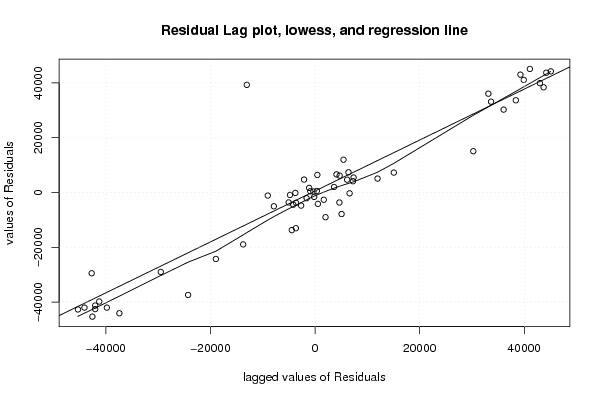
De student heeft enkel de seizonale dummy ingesteld en niet de lineaire trend. Als ze dit wel gedaan had, had ze tot een heel andere besluitvorming gekomen. Er kan beter een trend ingevoerd worden, dit kunnen we ook een beetje zien op de lag plot omdat het dal van links boven naar rechtsonder loopt en door het invoeren van de trend wordt de dummy eigenlijk onderuit gehaald want de p-waarde is dan ineens 94% en de T-test is dan ook duidelijk onder de 2.

http://www.freestatistics.org/blog/index.php?v=date/2008/Nov/30/t122806583256494evwcf2jzfl.htm (met dummies en lineaire trend)

De assumpties werden niet getest.
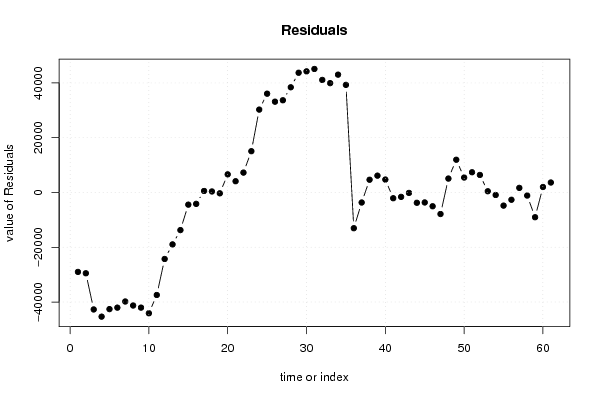
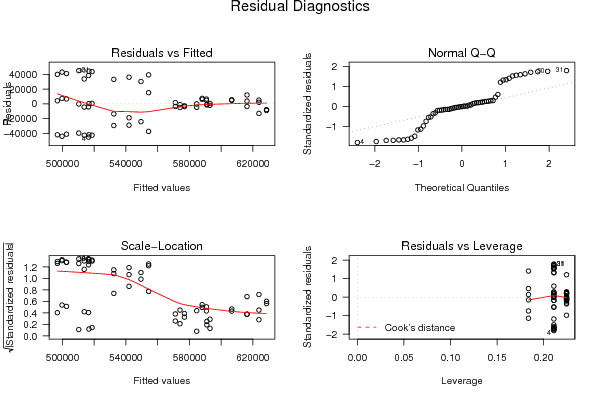
- Bij de residual grafiek zien we de voorspellingsfouten, het gemiddelde van de fouten moet constant zijn en gelijk aan nul, dit is hier niet het geval.
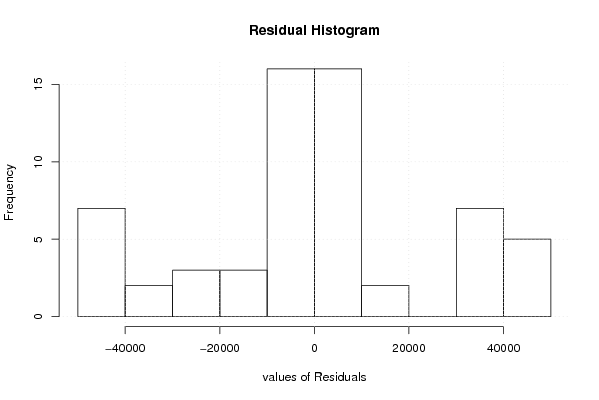
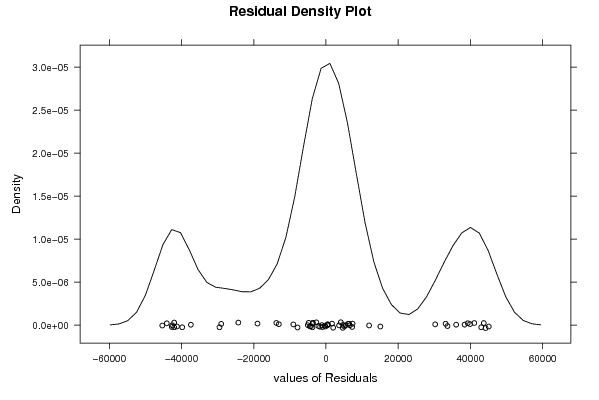
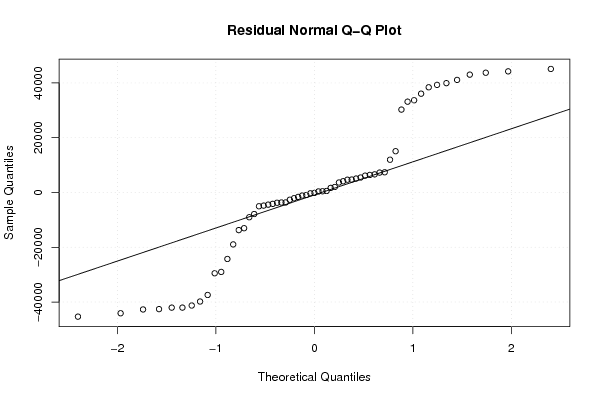
- Als we naar het histogram, density-plot en qq-plot kijken dan zien we dat er niet van een normaalverdeling gesproken kan worden (voor een goed model zou dit wel het geval moeten zijn).
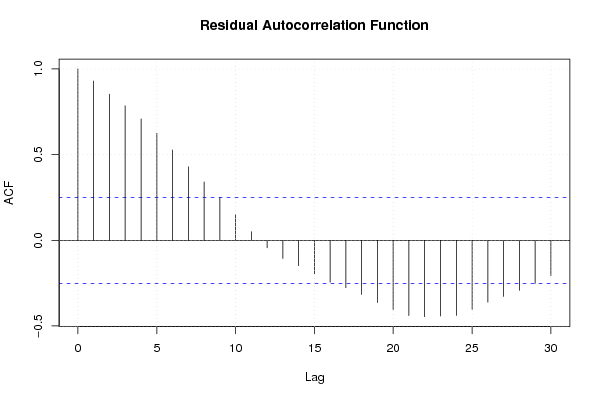
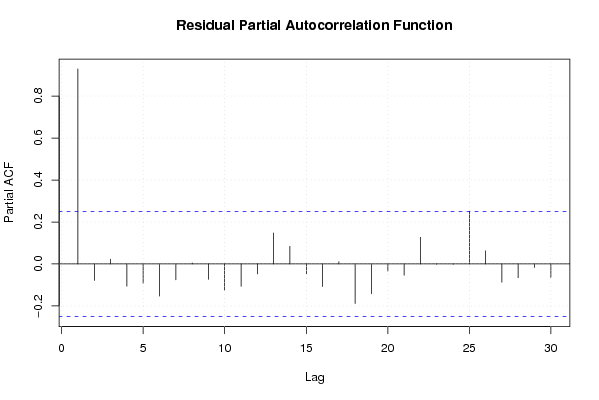
- Ten slotte kijken we naar de autocorrelatiefunctie, de blauwe lijn is het 95% betrouwbaarheidsinterval. Er vallen nog veel lijnen buiten, dus deze assumptie is niet goed.

We kunnen besluiten dat het model helemaal nog niet in orde is.

Post a new message
Dataseries X:
512927	0
502831	0
470984	0
471067	0
476049	0
474605	0
470439	0
461251	0
454724	0
455626	0
516847	0
525192	0
522975	0
518585	0
509239	0
512238	0
519164	0
517009	0
509933	0
509127	0
500857	0
506971	0
569323	0
579714	0
577992	0
565464	0
547344	0
554788	0
562325	0
560854	0
555332	0
543599	0
536662	0
542722	0
593530	0
610763	1
612613	1
611324	1
594167	1
595454	1
590865	1
589379	1
584428	1
573100	1
567456	1
569028	1
620735	1
628884	1
628232	1
612117	1
595404	1
597141	1
593408	1
590072	1
579799	1
574205	1
572775	1
572942	1
619567	1
625809	1
619916	1


Summary of computational transaction
Raw Inputview raw input (R code)
Raw Outputview raw output of R engine
Computing time4 seconds
R Server'George Udny Yule' @ 72.249.76.132

\begin{tabular}{lllllllll}
\hline
Summary of computational transaction \tabularnewline
Raw Input & view raw input (R code)  \tabularnewline
Raw Output & view raw output of R engine  \tabularnewline
Computing time & 4 seconds \tabularnewline
R Server & 'George Udny Yule' @ 72.249.76.132 \tabularnewline
\hline
\end{tabular}
%Source: https://freestatistics.org/blog/index.php?pk=25040&T=0

[TABLE]
[ROW][C]Summary of computational transaction[/C][/ROW]
[ROW][C]Raw Input[/C][C]view raw input (R code) [/C][/ROW]
[ROW][C]Raw Output[/C][C]view raw output of R engine [/C][/ROW]
[ROW][C]Computing time[/C][C]4 seconds[/C][/ROW]
[ROW][C]R Server[/C][C]'George Udny Yule' @ 72.249.76.132[/C][/ROW]
[/TABLE]
Source: https://freestatistics.org/blog/index.php?pk=25040&T=0

Globally Unique Identifier (entire table): ba.freestatistics.org/blog/index.php?pk=25040&T=0

As an alternative you can also use a QR Code:  

The GUIDs for individual cells are displayed in the table below:

Summary of computational transaction
Raw Inputview raw input (R code)
Raw Outputview raw output of R engine
Computing time4 seconds
R Server'George Udny Yule' @ 72.249.76.132


Multiple Linear Regression - Estimated Regression Equation
y[t] = + 549464.387755102 + 74346.68707483d[t] -7528.56462585037M1[t] -17138.8625850340M2[t] -35775.462585034M3[t] -33065.462585034M4[t] -30840.862585034M5[t] -32819.2625850339M6[t] -39216.862585034M7[t] -46946.662585034M8[t] -52708.262585034M9[t] -49745.262585034M10[t] + 4797.33741496601M11[t] + e[t]

\begin{tabular}{lllllllll}
\hline
Multiple Linear Regression - Estimated Regression Equation \tabularnewline
y[t] =  +  549464.387755102 +  74346.68707483d[t] -7528.56462585037M1[t] -17138.8625850340M2[t] -35775.462585034M3[t] -33065.462585034M4[t] -30840.862585034M5[t] -32819.2625850339M6[t] -39216.862585034M7[t] -46946.662585034M8[t] -52708.262585034M9[t] -49745.262585034M10[t] +  4797.33741496601M11[t]  + e[t] \tabularnewline
\hline
\end{tabular}
%Source: https://freestatistics.org/blog/index.php?pk=25040&T=1

[TABLE]
[ROW][C]Multiple Linear Regression - Estimated Regression Equation[/C][/ROW]
[ROW][C]y[t] =  +  549464.387755102 +  74346.68707483d[t] -7528.56462585037M1[t] -17138.8625850340M2[t] -35775.462585034M3[t] -33065.462585034M4[t] -30840.862585034M5[t] -32819.2625850339M6[t] -39216.862585034M7[t] -46946.662585034M8[t] -52708.262585034M9[t] -49745.262585034M10[t] +  4797.33741496601M11[t]  + e[t][/C][/ROW]
[/TABLE]
Source: https://freestatistics.org/blog/index.php?pk=25040&T=1

Globally Unique Identifier (entire table): ba.freestatistics.org/blog/index.php?pk=25040&T=1

As an alternative you can also use a QR Code:  

The GUIDs for individual cells are displayed in the table below:

Multiple Linear Regression - Estimated Regression Equation
y[t] = + 549464.387755102 + 74346.68707483d[t] -7528.56462585037M1[t] -17138.8625850340M2[t] -35775.462585034M3[t] -33065.462585034M4[t] -30840.862585034M5[t] -32819.2625850339M6[t] -39216.862585034M7[t] -46946.662585034M8[t] -52708.262585034M9[t] -49745.262585034M10[t] + 4797.33741496601M11[t] + e[t]


Multiple Linear Regression - Ordinary Least Squares
VariableParameterS.D.T-STATH0: parameter = 02-tail p-value1-tail p-value
(Intercept)549464.38775510213398.73134541.008700
d74346.687074837375.75885510.079900
M1-7528.5646258503717139.714726-0.43920.6624540.331227
M2-17138.862585034017945.995838-0.9550.3443510.172175
M3-35775.46258503417945.995838-1.99350.0519060.025953
M4-33065.46258503417945.995838-1.84250.0715830.035792
M5-30840.86258503417945.995838-1.71850.0921430.046072
M6-32819.262585033917945.995838-1.82880.0736490.036825
M7-39216.86258503417945.995838-2.18530.0337810.016891
M8-46946.66258503417945.995838-2.6160.0118580.005929
M9-52708.26258503417945.995838-2.9370.0050770.002538
M10-49745.26258503417945.995838-2.77190.0079070.003954
M114797.3374149660117945.9958380.26730.7903670.395184

\begin{tabular}{lllllllll}
\hline
Multiple Linear Regression - Ordinary Least Squares \tabularnewline
Variable & Parameter & S.D. & T-STATH0: parameter = 0 & 2-tail p-value & 1-tail p-value \tabularnewline
(Intercept) & 549464.387755102 & 13398.731345 & 41.0087 & 0 & 0 \tabularnewline
d & 74346.68707483 & 7375.758855 & 10.0799 & 0 & 0 \tabularnewline
M1 & -7528.56462585037 & 17139.714726 & -0.4392 & 0.662454 & 0.331227 \tabularnewline
M2 & -17138.8625850340 & 17945.995838 & -0.955 & 0.344351 & 0.172175 \tabularnewline
M3 & -35775.462585034 & 17945.995838 & -1.9935 & 0.051906 & 0.025953 \tabularnewline
M4 & -33065.462585034 & 17945.995838 & -1.8425 & 0.071583 & 0.035792 \tabularnewline
M5 & -30840.862585034 & 17945.995838 & -1.7185 & 0.092143 & 0.046072 \tabularnewline
M6 & -32819.2625850339 & 17945.995838 & -1.8288 & 0.073649 & 0.036825 \tabularnewline
M7 & -39216.862585034 & 17945.995838 & -2.1853 & 0.033781 & 0.016891 \tabularnewline
M8 & -46946.662585034 & 17945.995838 & -2.616 & 0.011858 & 0.005929 \tabularnewline
M9 & -52708.262585034 & 17945.995838 & -2.937 & 0.005077 & 0.002538 \tabularnewline
M10 & -49745.262585034 & 17945.995838 & -2.7719 & 0.007907 & 0.003954 \tabularnewline
M11 & 4797.33741496601 & 17945.995838 & 0.2673 & 0.790367 & 0.395184 \tabularnewline
\hline
\end{tabular}
%Source: https://freestatistics.org/blog/index.php?pk=25040&T=2

[TABLE]
[ROW][C]Multiple Linear Regression - Ordinary Least Squares[/C][/ROW]
[ROW][C]Variable[/C][C]Parameter[/C][C]S.D.[/C][C]T-STATH0: parameter = 0[/C][C]2-tail p-value[/C][C]1-tail p-value[/C][/ROW]
[ROW][C](Intercept)[/C][C]549464.387755102[/C][C]13398.731345[/C][C]41.0087[/C][C]0[/C][C]0[/C][/ROW]
[ROW][C]d[/C][C]74346.68707483[/C][C]7375.758855[/C][C]10.0799[/C][C]0[/C][C]0[/C][/ROW]
[ROW][C]M1[/C][C]-7528.56462585037[/C][C]17139.714726[/C][C]-0.4392[/C][C]0.662454[/C][C]0.331227[/C][/ROW]
[ROW][C]M2[/C][C]-17138.8625850340[/C][C]17945.995838[/C][C]-0.955[/C][C]0.344351[/C][C]0.172175[/C][/ROW]
[ROW][C]M3[/C][C]-35775.462585034[/C][C]17945.995838[/C][C]-1.9935[/C][C]0.051906[/C][C]0.025953[/C][/ROW]
[ROW][C]M4[/C][C]-33065.462585034[/C][C]17945.995838[/C][C]-1.8425[/C][C]0.071583[/C][C]0.035792[/C][/ROW]
[ROW][C]M5[/C][C]-30840.862585034[/C][C]17945.995838[/C][C]-1.7185[/C][C]0.092143[/C][C]0.046072[/C][/ROW]
[ROW][C]M6[/C][C]-32819.2625850339[/C][C]17945.995838[/C][C]-1.8288[/C][C]0.073649[/C][C]0.036825[/C][/ROW]
[ROW][C]M7[/C][C]-39216.862585034[/C][C]17945.995838[/C][C]-2.1853[/C][C]0.033781[/C][C]0.016891[/C][/ROW]
[ROW][C]M8[/C][C]-46946.662585034[/C][C]17945.995838[/C][C]-2.616[/C][C]0.011858[/C][C]0.005929[/C][/ROW]
[ROW][C]M9[/C][C]-52708.262585034[/C][C]17945.995838[/C][C]-2.937[/C][C]0.005077[/C][C]0.002538[/C][/ROW]
[ROW][C]M10[/C][C]-49745.262585034[/C][C]17945.995838[/C][C]-2.7719[/C][C]0.007907[/C][C]0.003954[/C][/ROW]
[ROW][C]M11[/C][C]4797.33741496601[/C][C]17945.995838[/C][C]0.2673[/C][C]0.790367[/C][C]0.395184[/C][/ROW]
[/TABLE]
Source: https://freestatistics.org/blog/index.php?pk=25040&T=2

Globally Unique Identifier (entire table): ba.freestatistics.org/blog/index.php?pk=25040&T=2

As an alternative you can also use a QR Code:  

The GUIDs for individual cells are displayed in the table below:

Multiple Linear Regression - Ordinary Least Squares
VariableParameterS.D.T-STATH0: parameter = 02-tail p-value1-tail p-value
(Intercept)549464.38775510213398.73134541.008700
d74346.687074837375.75885510.079900
M1-7528.5646258503717139.714726-0.43920.6624540.331227
M2-17138.862585034017945.995838-0.9550.3443510.172175
M3-35775.46258503417945.995838-1.99350.0519060.025953
M4-33065.46258503417945.995838-1.84250.0715830.035792
M5-30840.86258503417945.995838-1.71850.0921430.046072
M6-32819.262585033917945.995838-1.82880.0736490.036825
M7-39216.86258503417945.995838-2.18530.0337810.016891
M8-46946.66258503417945.995838-2.6160.0118580.005929
M9-52708.26258503417945.995838-2.9370.0050770.002538
M10-49745.26258503417945.995838-2.77190.0079070.003954
M114797.3374149660117945.9958380.26730.7903670.395184


Multiple Linear Regression - Regression Statistics
Multiple R0.860277006485671
R-squared0.740076527887947
Adjusted R-squared0.675095659859934
F-TEST (value)11.3891449952454
F-TEST (DF numerator)12
F-TEST (DF denominator)48
p-value2.56099030870871e-10
Multiple Linear Regression - Residual Statistics
Residual Standard Deviation28279.0865239866
Sum Squared Residuals38385923262.2939

\begin{tabular}{lllllllll}
\hline
Multiple Linear Regression - Regression Statistics \tabularnewline
Multiple R & 0.860277006485671 \tabularnewline
R-squared & 0.740076527887947 \tabularnewline
Adjusted R-squared & 0.675095659859934 \tabularnewline
F-TEST (value) & 11.3891449952454 \tabularnewline
F-TEST (DF numerator) & 12 \tabularnewline
F-TEST (DF denominator) & 48 \tabularnewline
p-value & 2.56099030870871e-10 \tabularnewline
Multiple Linear Regression - Residual Statistics \tabularnewline
Residual Standard Deviation & 28279.0865239866 \tabularnewline
Sum Squared Residuals & 38385923262.2939 \tabularnewline
\hline
\end{tabular}
%Source: https://freestatistics.org/blog/index.php?pk=25040&T=3

[TABLE]
[ROW][C]Multiple Linear Regression - Regression Statistics[/C][/ROW]
[ROW][C]Multiple R[/C][C]0.860277006485671[/C][/ROW]
[ROW][C]R-squared[/C][C]0.740076527887947[/C][/ROW]
[ROW][C]Adjusted R-squared[/C][C]0.675095659859934[/C][/ROW]
[ROW][C]F-TEST (value)[/C][C]11.3891449952454[/C][/ROW]
[ROW][C]F-TEST (DF numerator)[/C][C]12[/C][/ROW]
[ROW][C]F-TEST (DF denominator)[/C][C]48[/C][/ROW]
[ROW][C]p-value[/C][C]2.56099030870871e-10[/C][/ROW]
[ROW][C]Multiple Linear Regression - Residual Statistics[/C][/ROW]
[ROW][C]Residual Standard Deviation[/C][C]28279.0865239866[/C][/ROW]
[ROW][C]Sum Squared Residuals[/C][C]38385923262.2939[/C][/ROW]
[/TABLE]
Source: https://freestatistics.org/blog/index.php?pk=25040&T=3

Globally Unique Identifier (entire table): ba.freestatistics.org/blog/index.php?pk=25040&T=3

As an alternative you can also use a QR Code:  

The GUIDs for individual cells are displayed in the table below:

Multiple Linear Regression - Regression Statistics
Multiple R0.860277006485671
R-squared0.740076527887947
Adjusted R-squared0.675095659859934
F-TEST (value)11.3891449952454
F-TEST (DF numerator)12
F-TEST (DF denominator)48
p-value2.56099030870871e-10
Multiple Linear Regression - Residual Statistics
Residual Standard Deviation28279.0865239866
Sum Squared Residuals38385923262.2939


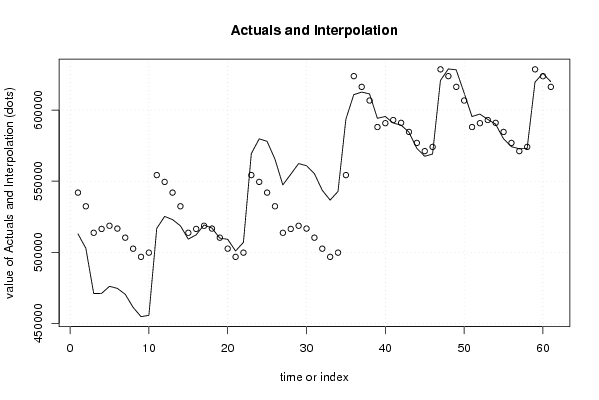
Multiple Linear Regression - Actuals, Interpolation, and Residuals
Time or IndexActualsInterpolationForecastResidualsPrediction Error
1512927541935.823129252-29008.8231292518
2502831532325.525170068-29494.5251700681
3470984513688.925170068-42704.9251700679
4471067516398.925170068-45331.925170068
5476049518623.525170068-42574.525170068
6474605516645.125170068-42040.1251700681
7470439510247.525170068-39808.525170068
8461251502517.725170068-41266.7251700681
9454724496756.125170068-42032.1251700681
10455626499719.125170068-44093.1251700681
11516847554261.725170068-37414.725170068
12525192549464.387755102-24272.387755102
13522975541935.823129252-18960.8231292517
14518585532325.525170068-13740.525170068
15509239513688.925170068-4449.92517006801
16512238516398.925170068-4160.92517006802
17519164518623.525170068540.474829931965
18517009516645.125170068363.874829931963
19509933510247.525170068-314.525170068031
20509127502517.7251700686609.27482993199
21500857496756.1251700684100.87482993199
22506971499719.1251700687251.87482993197
23569323554261.72517006815061.2748299320
24579714549464.38775510230249.6122448980
25577992541935.82312925236056.1768707483
26565464532325.52517006833138.474829932
27547344513688.92517006833655.074829932
28554788516398.92517006838389.074829932
29562325518623.52517006843701.474829932
30560854516645.12517006844208.8748299320
31555332510247.52517006845084.474829932
32543599502517.72517006841081.274829932
33536662496756.12517006839905.874829932
34542722499719.12517006843002.874829932
35593530554261.72517006839268.274829932
36610763623811.074829932-13048.0748299320
37612613616282.510204082-3669.51020408163
38611324606672.2122448984651.78775510205
39594167588035.6122448986131.38775510206
40595454590745.6122448984708.38775510203
41590865592970.212244898-2105.21224489797
42589379590991.812244898-1612.81224489797
43584428584594.212244898-166.212244897965
44573100576864.412244898-3764.41224489794
45567456571102.812244898-3646.81224489796
46569028574065.812244898-5037.81224489795
47620735628608.412244898-7873.41224489797
48628884623811.0748299325072.92517006804
49628232616282.51020408211949.4897959184
50612117606672.2122448985444.78775510205
51595404588035.6122448987368.38775510205
52597141590745.6122448986395.38775510203
53593408592970.212244898437.787755102033
54590072590991.812244898-919.812244897973
55579799584594.212244898-4795.21224489796
56574205576864.412244898-2659.41224489794
57572775571102.8122448981672.18775510204
58572942574065.812244898-1123.81224489796
59619567628608.412244898-9041.41224489797
60625809623811.0748299321997.92517006804
61619916616282.5102040823633.48979591838

\begin{tabular}{lllllllll}
\hline
Multiple Linear Regression - Actuals, Interpolation, and Residuals \tabularnewline
Time or Index & Actuals & InterpolationForecast & ResidualsPrediction Error \tabularnewline
1 & 512927 & 541935.823129252 & -29008.8231292518 \tabularnewline
2 & 502831 & 532325.525170068 & -29494.5251700681 \tabularnewline
3 & 470984 & 513688.925170068 & -42704.9251700679 \tabularnewline
4 & 471067 & 516398.925170068 & -45331.925170068 \tabularnewline
5 & 476049 & 518623.525170068 & -42574.525170068 \tabularnewline
6 & 474605 & 516645.125170068 & -42040.1251700681 \tabularnewline
7 & 470439 & 510247.525170068 & -39808.525170068 \tabularnewline
8 & 461251 & 502517.725170068 & -41266.7251700681 \tabularnewline
9 & 454724 & 496756.125170068 & -42032.1251700681 \tabularnewline
10 & 455626 & 499719.125170068 & -44093.1251700681 \tabularnewline
11 & 516847 & 554261.725170068 & -37414.725170068 \tabularnewline
12 & 525192 & 549464.387755102 & -24272.387755102 \tabularnewline
13 & 522975 & 541935.823129252 & -18960.8231292517 \tabularnewline
14 & 518585 & 532325.525170068 & -13740.525170068 \tabularnewline
15 & 509239 & 513688.925170068 & -4449.92517006801 \tabularnewline
16 & 512238 & 516398.925170068 & -4160.92517006802 \tabularnewline
17 & 519164 & 518623.525170068 & 540.474829931965 \tabularnewline
18 & 517009 & 516645.125170068 & 363.874829931963 \tabularnewline
19 & 509933 & 510247.525170068 & -314.525170068031 \tabularnewline
20 & 509127 & 502517.725170068 & 6609.27482993199 \tabularnewline
21 & 500857 & 496756.125170068 & 4100.87482993199 \tabularnewline
22 & 506971 & 499719.125170068 & 7251.87482993197 \tabularnewline
23 & 569323 & 554261.725170068 & 15061.2748299320 \tabularnewline
24 & 579714 & 549464.387755102 & 30249.6122448980 \tabularnewline
25 & 577992 & 541935.823129252 & 36056.1768707483 \tabularnewline
26 & 565464 & 532325.525170068 & 33138.474829932 \tabularnewline
27 & 547344 & 513688.925170068 & 33655.074829932 \tabularnewline
28 & 554788 & 516398.925170068 & 38389.074829932 \tabularnewline
29 & 562325 & 518623.525170068 & 43701.474829932 \tabularnewline
30 & 560854 & 516645.125170068 & 44208.8748299320 \tabularnewline
31 & 555332 & 510247.525170068 & 45084.474829932 \tabularnewline
32 & 543599 & 502517.725170068 & 41081.274829932 \tabularnewline
33 & 536662 & 496756.125170068 & 39905.874829932 \tabularnewline
34 & 542722 & 499719.125170068 & 43002.874829932 \tabularnewline
35 & 593530 & 554261.725170068 & 39268.274829932 \tabularnewline
36 & 610763 & 623811.074829932 & -13048.0748299320 \tabularnewline
37 & 612613 & 616282.510204082 & -3669.51020408163 \tabularnewline
38 & 611324 & 606672.212244898 & 4651.78775510205 \tabularnewline
39 & 594167 & 588035.612244898 & 6131.38775510206 \tabularnewline
40 & 595454 & 590745.612244898 & 4708.38775510203 \tabularnewline
41 & 590865 & 592970.212244898 & -2105.21224489797 \tabularnewline
42 & 589379 & 590991.812244898 & -1612.81224489797 \tabularnewline
43 & 584428 & 584594.212244898 & -166.212244897965 \tabularnewline
44 & 573100 & 576864.412244898 & -3764.41224489794 \tabularnewline
45 & 567456 & 571102.812244898 & -3646.81224489796 \tabularnewline
46 & 569028 & 574065.812244898 & -5037.81224489795 \tabularnewline
47 & 620735 & 628608.412244898 & -7873.41224489797 \tabularnewline
48 & 628884 & 623811.074829932 & 5072.92517006804 \tabularnewline
49 & 628232 & 616282.510204082 & 11949.4897959184 \tabularnewline
50 & 612117 & 606672.212244898 & 5444.78775510205 \tabularnewline
51 & 595404 & 588035.612244898 & 7368.38775510205 \tabularnewline
52 & 597141 & 590745.612244898 & 6395.38775510203 \tabularnewline
53 & 593408 & 592970.212244898 & 437.787755102033 \tabularnewline
54 & 590072 & 590991.812244898 & -919.812244897973 \tabularnewline
55 & 579799 & 584594.212244898 & -4795.21224489796 \tabularnewline
56 & 574205 & 576864.412244898 & -2659.41224489794 \tabularnewline
57 & 572775 & 571102.812244898 & 1672.18775510204 \tabularnewline
58 & 572942 & 574065.812244898 & -1123.81224489796 \tabularnewline
59 & 619567 & 628608.412244898 & -9041.41224489797 \tabularnewline
60 & 625809 & 623811.074829932 & 1997.92517006804 \tabularnewline
61 & 619916 & 616282.510204082 & 3633.48979591838 \tabularnewline
\hline
\end{tabular}
%Source: https://freestatistics.org/blog/index.php?pk=25040&T=4

[TABLE]
[ROW][C]Multiple Linear Regression - Actuals, Interpolation, and Residuals[/C][/ROW]
[ROW][C]Time or Index[/C][C]Actuals[/C][C]InterpolationForecast[/C][C]ResidualsPrediction Error[/C][/ROW]
[ROW][C]1[/C][C]512927[/C][C]541935.823129252[/C][C]-29008.8231292518[/C][/ROW]
[ROW][C]2[/C][C]502831[/C][C]532325.525170068[/C][C]-29494.5251700681[/C][/ROW]
[ROW][C]3[/C][C]470984[/C][C]513688.925170068[/C][C]-42704.9251700679[/C][/ROW]
[ROW][C]4[/C][C]471067[/C][C]516398.925170068[/C][C]-45331.925170068[/C][/ROW]
[ROW][C]5[/C][C]476049[/C][C]518623.525170068[/C][C]-42574.525170068[/C][/ROW]
[ROW][C]6[/C][C]474605[/C][C]516645.125170068[/C][C]-42040.1251700681[/C][/ROW]
[ROW][C]7[/C][C]470439[/C][C]510247.525170068[/C][C]-39808.525170068[/C][/ROW]
[ROW][C]8[/C][C]461251[/C][C]502517.725170068[/C][C]-41266.7251700681[/C][/ROW]
[ROW][C]9[/C][C]454724[/C][C]496756.125170068[/C][C]-42032.1251700681[/C][/ROW]
[ROW][C]10[/C][C]455626[/C][C]499719.125170068[/C][C]-44093.1251700681[/C][/ROW]
[ROW][C]11[/C][C]516847[/C][C]554261.725170068[/C][C]-37414.725170068[/C][/ROW]
[ROW][C]12[/C][C]525192[/C][C]549464.387755102[/C][C]-24272.387755102[/C][/ROW]
[ROW][C]13[/C][C]522975[/C][C]541935.823129252[/C][C]-18960.8231292517[/C][/ROW]
[ROW][C]14[/C][C]518585[/C][C]532325.525170068[/C][C]-13740.525170068[/C][/ROW]
[ROW][C]15[/C][C]509239[/C][C]513688.925170068[/C][C]-4449.92517006801[/C][/ROW]
[ROW][C]16[/C][C]512238[/C][C]516398.925170068[/C][C]-4160.92517006802[/C][/ROW]
[ROW][C]17[/C][C]519164[/C][C]518623.525170068[/C][C]540.474829931965[/C][/ROW]
[ROW][C]18[/C][C]517009[/C][C]516645.125170068[/C][C]363.874829931963[/C][/ROW]
[ROW][C]19[/C][C]509933[/C][C]510247.525170068[/C][C]-314.525170068031[/C][/ROW]
[ROW][C]20[/C][C]509127[/C][C]502517.725170068[/C][C]6609.27482993199[/C][/ROW]
[ROW][C]21[/C][C]500857[/C][C]496756.125170068[/C][C]4100.87482993199[/C][/ROW]
[ROW][C]22[/C][C]506971[/C][C]499719.125170068[/C][C]7251.87482993197[/C][/ROW]
[ROW][C]23[/C][C]569323[/C][C]554261.725170068[/C][C]15061.2748299320[/C][/ROW]
[ROW][C]24[/C][C]579714[/C][C]549464.387755102[/C][C]30249.6122448980[/C][/ROW]
[ROW][C]25[/C][C]577992[/C][C]541935.823129252[/C][C]36056.1768707483[/C][/ROW]
[ROW][C]26[/C][C]565464[/C][C]532325.525170068[/C][C]33138.474829932[/C][/ROW]
[ROW][C]27[/C][C]547344[/C][C]513688.925170068[/C][C]33655.074829932[/C][/ROW]
[ROW][C]28[/C][C]554788[/C][C]516398.925170068[/C][C]38389.074829932[/C][/ROW]
[ROW][C]29[/C][C]562325[/C][C]518623.525170068[/C][C]43701.474829932[/C][/ROW]
[ROW][C]30[/C][C]560854[/C][C]516645.125170068[/C][C]44208.8748299320[/C][/ROW]
[ROW][C]31[/C][C]555332[/C][C]510247.525170068[/C][C]45084.474829932[/C][/ROW]
[ROW][C]32[/C][C]543599[/C][C]502517.725170068[/C][C]41081.274829932[/C][/ROW]
[ROW][C]33[/C][C]536662[/C][C]496756.125170068[/C][C]39905.874829932[/C][/ROW]
[ROW][C]34[/C][C]542722[/C][C]499719.125170068[/C][C]43002.874829932[/C][/ROW]
[ROW][C]35[/C][C]593530[/C][C]554261.725170068[/C][C]39268.274829932[/C][/ROW]
[ROW][C]36[/C][C]610763[/C][C]623811.074829932[/C][C]-13048.0748299320[/C][/ROW]
[ROW][C]37[/C][C]612613[/C][C]616282.510204082[/C][C]-3669.51020408163[/C][/ROW]
[ROW][C]38[/C][C]611324[/C][C]606672.212244898[/C][C]4651.78775510205[/C][/ROW]
[ROW][C]39[/C][C]594167[/C][C]588035.612244898[/C][C]6131.38775510206[/C][/ROW]
[ROW][C]40[/C][C]595454[/C][C]590745.612244898[/C][C]4708.38775510203[/C][/ROW]
[ROW][C]41[/C][C]590865[/C][C]592970.212244898[/C][C]-2105.21224489797[/C][/ROW]
[ROW][C]42[/C][C]589379[/C][C]590991.812244898[/C][C]-1612.81224489797[/C][/ROW]
[ROW][C]43[/C][C]584428[/C][C]584594.212244898[/C][C]-166.212244897965[/C][/ROW]
[ROW][C]44[/C][C]573100[/C][C]576864.412244898[/C][C]-3764.41224489794[/C][/ROW]
[ROW][C]45[/C][C]567456[/C][C]571102.812244898[/C][C]-3646.81224489796[/C][/ROW]
[ROW][C]46[/C][C]569028[/C][C]574065.812244898[/C][C]-5037.81224489795[/C][/ROW]
[ROW][C]47[/C][C]620735[/C][C]628608.412244898[/C][C]-7873.41224489797[/C][/ROW]
[ROW][C]48[/C][C]628884[/C][C]623811.074829932[/C][C]5072.92517006804[/C][/ROW]
[ROW][C]49[/C][C]628232[/C][C]616282.510204082[/C][C]11949.4897959184[/C][/ROW]
[ROW][C]50[/C][C]612117[/C][C]606672.212244898[/C][C]5444.78775510205[/C][/ROW]
[ROW][C]51[/C][C]595404[/C][C]588035.612244898[/C][C]7368.38775510205[/C][/ROW]
[ROW][C]52[/C][C]597141[/C][C]590745.612244898[/C][C]6395.38775510203[/C][/ROW]
[ROW][C]53[/C][C]593408[/C][C]592970.212244898[/C][C]437.787755102033[/C][/ROW]
[ROW][C]54[/C][C]590072[/C][C]590991.812244898[/C][C]-919.812244897973[/C][/ROW]
[ROW][C]55[/C][C]579799[/C][C]584594.212244898[/C][C]-4795.21224489796[/C][/ROW]
[ROW][C]56[/C][C]574205[/C][C]576864.412244898[/C][C]-2659.41224489794[/C][/ROW]
[ROW][C]57[/C][C]572775[/C][C]571102.812244898[/C][C]1672.18775510204[/C][/ROW]
[ROW][C]58[/C][C]572942[/C][C]574065.812244898[/C][C]-1123.81224489796[/C][/ROW]
[ROW][C]59[/C][C]619567[/C][C]628608.412244898[/C][C]-9041.41224489797[/C][/ROW]
[ROW][C]60[/C][C]625809[/C][C]623811.074829932[/C][C]1997.92517006804[/C][/ROW]
[ROW][C]61[/C][C]619916[/C][C]616282.510204082[/C][C]3633.48979591838[/C][/ROW]
[/TABLE]
Source: https://freestatistics.org/blog/index.php?pk=25040&T=4

Globally Unique Identifier (entire table): ba.freestatistics.org/blog/index.php?pk=25040&T=4

As an alternative you can also use a QR Code:  

The GUIDs for individual cells are displayed in the table below:

Multiple Linear Regression - Actuals, Interpolation, and Residuals
Time or IndexActualsInterpolationForecastResidualsPrediction Error
1512927541935.823129252-29008.8231292518
2502831532325.525170068-29494.5251700681
3470984513688.925170068-42704.9251700679
4471067516398.925170068-45331.925170068
5476049518623.525170068-42574.525170068
6474605516645.125170068-42040.1251700681
7470439510247.525170068-39808.525170068
8461251502517.725170068-41266.7251700681
9454724496756.125170068-42032.1251700681
10455626499719.125170068-44093.1251700681
11516847554261.725170068-37414.725170068
12525192549464.387755102-24272.387755102
13522975541935.823129252-18960.8231292517
14518585532325.525170068-13740.525170068
15509239513688.925170068-4449.92517006801
16512238516398.925170068-4160.92517006802
17519164518623.525170068540.474829931965
18517009516645.125170068363.874829931963
19509933510247.525170068-314.525170068031
20509127502517.7251700686609.27482993199
21500857496756.1251700684100.87482993199
22506971499719.1251700687251.87482993197
23569323554261.72517006815061.2748299320
24579714549464.38775510230249.6122448980
25577992541935.82312925236056.1768707483
26565464532325.52517006833138.474829932
27547344513688.92517006833655.074829932
28554788516398.92517006838389.074829932
29562325518623.52517006843701.474829932
30560854516645.12517006844208.8748299320
31555332510247.52517006845084.474829932
32543599502517.72517006841081.274829932
33536662496756.12517006839905.874829932
34542722499719.12517006843002.874829932
35593530554261.72517006839268.274829932
36610763623811.074829932-13048.0748299320
37612613616282.510204082-3669.51020408163
38611324606672.2122448984651.78775510205
39594167588035.6122448986131.38775510206
40595454590745.6122448984708.38775510203
41590865592970.212244898-2105.21224489797
42589379590991.812244898-1612.81224489797
43584428584594.212244898-166.212244897965
44573100576864.412244898-3764.41224489794
45567456571102.812244898-3646.81224489796
46569028574065.812244898-5037.81224489795
47620735628608.412244898-7873.41224489797
48628884623811.0748299325072.92517006804
49628232616282.51020408211949.4897959184
50612117606672.2122448985444.78775510205
51595404588035.6122448987368.38775510205
52597141590745.6122448986395.38775510203
53593408592970.212244898437.787755102033
54590072590991.812244898-919.812244897973
55579799584594.212244898-4795.21224489796
56574205576864.412244898-2659.41224489794
57572775571102.8122448981672.18775510204
58572942574065.812244898-1123.81224489796
59619567628608.412244898-9041.41224489797
60625809623811.0748299321997.92517006804
61619916616282.5102040823633.48979591838


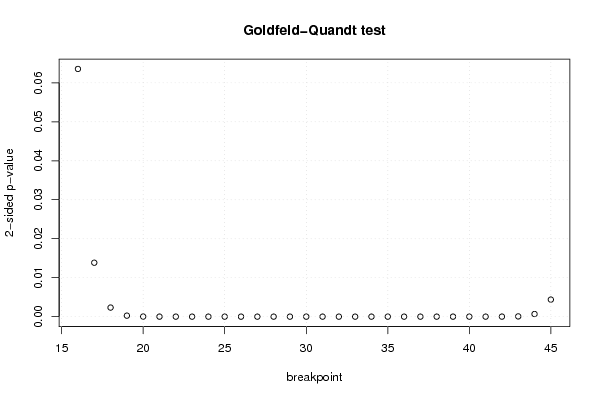
Goldfeld-Quandt test for Heteroskedasticity
p-valuesAlternative Hypothesis
breakpoint indexgreater2-sidedless
160.96821942214780.06356115570440110.0317805778522006
170.9930800260299860.01383994794002860.0069199739700143
180.9988345107943750.002330978411249350.00116548920562467
190.9998733609814930.0002532780370141390.000126639018507069
200.999989656803282.06863934385355e-051.03431967192677e-05
210.9999997962331844.0753363115481e-072.03766815577405e-07
220.9999999992363771.5272467810508e-097.636233905254e-10
230.999999999961337.73418449500377e-113.86709224750189e-11
240.9999999999738565.22869393416352e-112.61434696708176e-11
250.999999999990741.85206080023093e-119.26030400115463e-12
260.9999999999975994.80238934713291e-122.40119467356646e-12
270.999999999999813.80545732980839e-131.90272866490419e-13
280.9999999999999549.28142004060876e-144.64071002030438e-14
290.999999999999882.40330553665628e-131.20165276832814e-13
300.999999999999627.6027948716987e-133.80139743584935e-13
310.9999999999987232.55399072986245e-121.27699536493123e-12
320.9999999999938531.22937452101713e-116.14687260508564e-12
330.9999999999774834.50336246661722e-112.25168123330861e-11
340.9999999998840462.31908100655069e-101.15954050327534e-10
350.9999999992681971.46360659761121e-097.31803298805607e-10
360.9999999999248431.50314639365906e-107.5157319682953e-11
370.9999999999858062.83885885731338e-111.41942942865669e-11
380.999999999791584.1683782622588e-102.0841891311294e-10
390.9999999971796545.64069219753395e-092.82034609876698e-09
400.9999999649726387.00547235908845e-083.50273617954423e-08
410.999999621803337.56393340837332e-073.78196670418666e-07
420.9999955680908568.86381828719378e-064.43190914359689e-06
430.9999675163590526.49672818951066e-053.24836409475533e-05
440.9996617415023470.000676516995305830.000338258497652915
450.9978109405375920.004378118924816420.00218905946240821

\begin{tabular}{lllllllll}
\hline
Goldfeld-Quandt test for Heteroskedasticity \tabularnewline
p-values & Alternative Hypothesis \tabularnewline
breakpoint index & greater & 2-sided & less \tabularnewline
16 & 0.9682194221478 & 0.0635611557044011 & 0.0317805778522006 \tabularnewline
17 & 0.993080026029986 & 0.0138399479400286 & 0.0069199739700143 \tabularnewline
18 & 0.998834510794375 & 0.00233097841124935 & 0.00116548920562467 \tabularnewline
19 & 0.999873360981493 & 0.000253278037014139 & 0.000126639018507069 \tabularnewline
20 & 0.99998965680328 & 2.06863934385355e-05 & 1.03431967192677e-05 \tabularnewline
21 & 0.999999796233184 & 4.0753363115481e-07 & 2.03766815577405e-07 \tabularnewline
22 & 0.999999999236377 & 1.5272467810508e-09 & 7.636233905254e-10 \tabularnewline
23 & 0.99999999996133 & 7.73418449500377e-11 & 3.86709224750189e-11 \tabularnewline
24 & 0.999999999973856 & 5.22869393416352e-11 & 2.61434696708176e-11 \tabularnewline
25 & 0.99999999999074 & 1.85206080023093e-11 & 9.26030400115463e-12 \tabularnewline
26 & 0.999999999997599 & 4.80238934713291e-12 & 2.40119467356646e-12 \tabularnewline
27 & 0.99999999999981 & 3.80545732980839e-13 & 1.90272866490419e-13 \tabularnewline
28 & 0.999999999999954 & 9.28142004060876e-14 & 4.64071002030438e-14 \tabularnewline
29 & 0.99999999999988 & 2.40330553665628e-13 & 1.20165276832814e-13 \tabularnewline
30 & 0.99999999999962 & 7.6027948716987e-13 & 3.80139743584935e-13 \tabularnewline
31 & 0.999999999998723 & 2.55399072986245e-12 & 1.27699536493123e-12 \tabularnewline
32 & 0.999999999993853 & 1.22937452101713e-11 & 6.14687260508564e-12 \tabularnewline
33 & 0.999999999977483 & 4.50336246661722e-11 & 2.25168123330861e-11 \tabularnewline
34 & 0.999999999884046 & 2.31908100655069e-10 & 1.15954050327534e-10 \tabularnewline
35 & 0.999999999268197 & 1.46360659761121e-09 & 7.31803298805607e-10 \tabularnewline
36 & 0.999999999924843 & 1.50314639365906e-10 & 7.5157319682953e-11 \tabularnewline
37 & 0.999999999985806 & 2.83885885731338e-11 & 1.41942942865669e-11 \tabularnewline
38 & 0.99999999979158 & 4.1683782622588e-10 & 2.0841891311294e-10 \tabularnewline
39 & 0.999999997179654 & 5.64069219753395e-09 & 2.82034609876698e-09 \tabularnewline
40 & 0.999999964972638 & 7.00547235908845e-08 & 3.50273617954423e-08 \tabularnewline
41 & 0.99999962180333 & 7.56393340837332e-07 & 3.78196670418666e-07 \tabularnewline
42 & 0.999995568090856 & 8.86381828719378e-06 & 4.43190914359689e-06 \tabularnewline
43 & 0.999967516359052 & 6.49672818951066e-05 & 3.24836409475533e-05 \tabularnewline
44 & 0.999661741502347 & 0.00067651699530583 & 0.000338258497652915 \tabularnewline
45 & 0.997810940537592 & 0.00437811892481642 & 0.00218905946240821 \tabularnewline
\hline
\end{tabular}
%Source: https://freestatistics.org/blog/index.php?pk=25040&T=5

[TABLE]
[ROW][C]Goldfeld-Quandt test for Heteroskedasticity[/C][/ROW]
[ROW][C]p-values[/C][C]Alternative Hypothesis[/C][/ROW]
[ROW][C]breakpoint index[/C][C]greater[/C][C]2-sided[/C][C]less[/C][/ROW]
[ROW][C]16[/C][C]0.9682194221478[/C][C]0.0635611557044011[/C][C]0.0317805778522006[/C][/ROW]
[ROW][C]17[/C][C]0.993080026029986[/C][C]0.0138399479400286[/C][C]0.0069199739700143[/C][/ROW]
[ROW][C]18[/C][C]0.998834510794375[/C][C]0.00233097841124935[/C][C]0.00116548920562467[/C][/ROW]
[ROW][C]19[/C][C]0.999873360981493[/C][C]0.000253278037014139[/C][C]0.000126639018507069[/C][/ROW]
[ROW][C]20[/C][C]0.99998965680328[/C][C]2.06863934385355e-05[/C][C]1.03431967192677e-05[/C][/ROW]
[ROW][C]21[/C][C]0.999999796233184[/C][C]4.0753363115481e-07[/C][C]2.03766815577405e-07[/C][/ROW]
[ROW][C]22[/C][C]0.999999999236377[/C][C]1.5272467810508e-09[/C][C]7.636233905254e-10[/C][/ROW]
[ROW][C]23[/C][C]0.99999999996133[/C][C]7.73418449500377e-11[/C][C]3.86709224750189e-11[/C][/ROW]
[ROW][C]24[/C][C]0.999999999973856[/C][C]5.22869393416352e-11[/C][C]2.61434696708176e-11[/C][/ROW]
[ROW][C]25[/C][C]0.99999999999074[/C][C]1.85206080023093e-11[/C][C]9.26030400115463e-12[/C][/ROW]
[ROW][C]26[/C][C]0.999999999997599[/C][C]4.80238934713291e-12[/C][C]2.40119467356646e-12[/C][/ROW]
[ROW][C]27[/C][C]0.99999999999981[/C][C]3.80545732980839e-13[/C][C]1.90272866490419e-13[/C][/ROW]
[ROW][C]28[/C][C]0.999999999999954[/C][C]9.28142004060876e-14[/C][C]4.64071002030438e-14[/C][/ROW]
[ROW][C]29[/C][C]0.99999999999988[/C][C]2.40330553665628e-13[/C][C]1.20165276832814e-13[/C][/ROW]
[ROW][C]30[/C][C]0.99999999999962[/C][C]7.6027948716987e-13[/C][C]3.80139743584935e-13[/C][/ROW]
[ROW][C]31[/C][C]0.999999999998723[/C][C]2.55399072986245e-12[/C][C]1.27699536493123e-12[/C][/ROW]
[ROW][C]32[/C][C]0.999999999993853[/C][C]1.22937452101713e-11[/C][C]6.14687260508564e-12[/C][/ROW]
[ROW][C]33[/C][C]0.999999999977483[/C][C]4.50336246661722e-11[/C][C]2.25168123330861e-11[/C][/ROW]
[ROW][C]34[/C][C]0.999999999884046[/C][C]2.31908100655069e-10[/C][C]1.15954050327534e-10[/C][/ROW]
[ROW][C]35[/C][C]0.999999999268197[/C][C]1.46360659761121e-09[/C][C]7.31803298805607e-10[/C][/ROW]
[ROW][C]36[/C][C]0.999999999924843[/C][C]1.50314639365906e-10[/C][C]7.5157319682953e-11[/C][/ROW]
[ROW][C]37[/C][C]0.999999999985806[/C][C]2.83885885731338e-11[/C][C]1.41942942865669e-11[/C][/ROW]
[ROW][C]38[/C][C]0.99999999979158[/C][C]4.1683782622588e-10[/C][C]2.0841891311294e-10[/C][/ROW]
[ROW][C]39[/C][C]0.999999997179654[/C][C]5.64069219753395e-09[/C][C]2.82034609876698e-09[/C][/ROW]
[ROW][C]40[/C][C]0.999999964972638[/C][C]7.00547235908845e-08[/C][C]3.50273617954423e-08[/C][/ROW]
[ROW][C]41[/C][C]0.99999962180333[/C][C]7.56393340837332e-07[/C][C]3.78196670418666e-07[/C][/ROW]
[ROW][C]42[/C][C]0.999995568090856[/C][C]8.86381828719378e-06[/C][C]4.43190914359689e-06[/C][/ROW]
[ROW][C]43[/C][C]0.999967516359052[/C][C]6.49672818951066e-05[/C][C]3.24836409475533e-05[/C][/ROW]
[ROW][C]44[/C][C]0.999661741502347[/C][C]0.00067651699530583[/C][C]0.000338258497652915[/C][/ROW]
[ROW][C]45[/C][C]0.997810940537592[/C][C]0.00437811892481642[/C][C]0.00218905946240821[/C][/ROW]
[/TABLE]
Source: https://freestatistics.org/blog/index.php?pk=25040&T=5

Globally Unique Identifier (entire table): ba.freestatistics.org/blog/index.php?pk=25040&T=5

As an alternative you can also use a QR Code:  

The GUIDs for individual cells are displayed in the table below:

Goldfeld-Quandt test for Heteroskedasticity
p-valuesAlternative Hypothesis
breakpoint indexgreater2-sidedless
160.96821942214780.06356115570440110.0317805778522006
170.9930800260299860.01383994794002860.0069199739700143
180.9988345107943750.002330978411249350.00116548920562467
190.9998733609814930.0002532780370141390.000126639018507069
200.999989656803282.06863934385355e-051.03431967192677e-05
210.9999997962331844.0753363115481e-072.03766815577405e-07
220.9999999992363771.5272467810508e-097.636233905254e-10
230.999999999961337.73418449500377e-113.86709224750189e-11
240.9999999999738565.22869393416352e-112.61434696708176e-11
250.999999999990741.85206080023093e-119.26030400115463e-12
260.9999999999975994.80238934713291e-122.40119467356646e-12
270.999999999999813.80545732980839e-131.90272866490419e-13
280.9999999999999549.28142004060876e-144.64071002030438e-14
290.999999999999882.40330553665628e-131.20165276832814e-13
300.999999999999627.6027948716987e-133.80139743584935e-13
310.9999999999987232.55399072986245e-121.27699536493123e-12
320.9999999999938531.22937452101713e-116.14687260508564e-12
330.9999999999774834.50336246661722e-112.25168123330861e-11
340.9999999998840462.31908100655069e-101.15954050327534e-10
350.9999999992681971.46360659761121e-097.31803298805607e-10
360.9999999999248431.50314639365906e-107.5157319682953e-11
370.9999999999858062.83885885731338e-111.41942942865669e-11
380.999999999791584.1683782622588e-102.0841891311294e-10
390.9999999971796545.64069219753395e-092.82034609876698e-09
400.9999999649726387.00547235908845e-083.50273617954423e-08
410.999999621803337.56393340837332e-073.78196670418666e-07
420.9999955680908568.86381828719378e-064.43190914359689e-06
430.9999675163590526.49672818951066e-053.24836409475533e-05
440.9996617415023470.000676516995305830.000338258497652915
450.9978109405375920.004378118924816420.00218905946240821


Meta Analysis of Goldfeld-Quandt test for Heteroskedasticity
Description# significant tests% significant testsOK/NOK
1% type I error level280.933333333333333NOK
5% type I error level290.966666666666667NOK
10% type I error level301NOK

\begin{tabular}{lllllllll}
\hline
Meta Analysis of Goldfeld-Quandt test for Heteroskedasticity \tabularnewline
Description & # significant tests & % significant tests & OK/NOK \tabularnewline
1% type I error level & 28 & 0.933333333333333 & NOK \tabularnewline
5% type I error level & 29 & 0.966666666666667 & NOK \tabularnewline
10% type I error level & 30 & 1 & NOK \tabularnewline
\hline
\end{tabular}
%Source: https://freestatistics.org/blog/index.php?pk=25040&T=6

[TABLE]
[ROW][C]Meta Analysis of Goldfeld-Quandt test for Heteroskedasticity[/C][/ROW]
[ROW][C]Description[/C][C]# significant tests[/C][C]% significant tests[/C][C]OK/NOK[/C][/ROW]
[ROW][C]1% type I error level[/C][C]28[/C][C]0.933333333333333[/C][C]NOK[/C][/ROW]
[ROW][C]5% type I error level[/C][C]29[/C][C]0.966666666666667[/C][C]NOK[/C][/ROW]
[ROW][C]10% type I error level[/C][C]30[/C][C]1[/C][C]NOK[/C][/ROW]
[/TABLE]
Source: https://freestatistics.org/blog/index.php?pk=25040&T=6

Globally Unique Identifier (entire table): ba.freestatistics.org/blog/index.php?pk=25040&T=6

As an alternative you can also use a QR Code:  

The GUIDs for individual cells are displayed in the table below:

Meta Analysis of Goldfeld-Quandt test for Heteroskedasticity
Description# significant tests% significant testsOK/NOK
1% type I error level280.933333333333333NOK
5% type I error level290.966666666666667NOK
10% type I error level301NOK


Parameters (Session):
par1 = 1 ; par2 = Include Monthly Dummies ; par3 = No Linear Trend ;
Parameters (R input):
par1 = 1 ; par2 = Include Monthly Dummies ; par3 = No Linear Trend ;
R code (references can be found in the software module):
library(lattice)
library(lmtest)
n25 <- 25 #minimum number of obs. for Goldfeld-Quandt test
par1 <- as.numeric(par1)
x <- t(y)
k <- length(x[1,])
n <- length(x[,1])
x1 <- cbind(x[,par1], x[,1:k!=par1])
mycolnames <- c(colnames(x)[par1], colnames(x)[1:k!=par1])
colnames(x1) <- mycolnames #colnames(x)[par1]
x <- x1
if (par3 == 'First Differences'){
x2 <- array(0, dim=c(n-1,k), dimnames=list(1:(n-1), paste('(1-B)',colnames(x),sep='')))
for (i in 1:n-1) {
for (j in 1:k) {
x2[i,j] <- x[i+1,j] - x[i,j]
}
}
x <- x2
}
if (par2 == 'Include Monthly Dummies'){
x2 <- array(0, dim=c(n,11), dimnames=list(1:n, paste('M', seq(1:11), sep ='')))
for (i in 1:11){
x2[seq(i,n,12),i] <- 1
}
x <- cbind(x, x2)
}
if (par2 == 'Include Quarterly Dummies'){
x2 <- array(0, dim=c(n,3), dimnames=list(1:n, paste('Q', seq(1:3), sep ='')))
for (i in 1:3){
x2[seq(i,n,4),i] <- 1
}
x <- cbind(x, x2)
}
k <- length(x[1,])
if (par3 == 'Linear Trend'){
x <- cbind(x, c(1:n))
colnames(x)[k+1] <- 't'
}
x
k <- length(x[1,])
df <- as.data.frame(x)
(mylm <- lm(df))
(mysum <- summary(mylm))
if (n > n25) {
kp3 <- k + 3
nmkm3 <- n - k - 3
gqarr <- array(NA, dim=c(nmkm3-kp3+1,3))
numgqtests <- 0
numsignificant1 <- 0
numsignificant5 <- 0
numsignificant10 <- 0
for (mypoint in kp3:nmkm3) {
j <- 0
numgqtests <- numgqtests + 1
for (myalt in c('greater', 'two.sided', 'less')) {
j <- j + 1
gqarr[mypoint-kp3+1,j] <- gqtest(mylm, point=mypoint, alternative=myalt)$p.value
}
if (gqarr[mypoint-kp3+1,2] < 0.01) numsignificant1 <- numsignificant1 + 1
if (gqarr[mypoint-kp3+1,2] < 0.05) numsignificant5 <- numsignificant5 + 1
if (gqarr[mypoint-kp3+1,2] < 0.10) numsignificant10 <- numsignificant10 + 1
}
gqarr
}
bitmap(file='test0.png')
plot(x[,1], type='l', main='Actuals and Interpolation', ylab='value of Actuals and Interpolation (dots)', xlab='time or index')
points(x[,1]-mysum$resid)
grid()
dev.off()
bitmap(file='test1.png')
plot(mysum$resid, type='b', pch=19, main='Residuals', ylab='value of Residuals', xlab='time or index')
grid()
dev.off()
bitmap(file='test2.png')
hist(mysum$resid, main='Residual Histogram', xlab='values of Residuals')
grid()
dev.off()
bitmap(file='test3.png')
densityplot(~mysum$resid,col='black',main='Residual Density Plot', xlab='values of Residuals')
dev.off()
bitmap(file='test4.png')
qqnorm(mysum$resid, main='Residual Normal Q-Q Plot')
qqline(mysum$resid)
grid()
dev.off()
(myerror <- as.ts(mysum$resid))
bitmap(file='test5.png')
dum <- cbind(lag(myerror,k=1),myerror)
dum
dum1 <- dum[2:length(myerror),]
dum1
z <- as.data.frame(dum1)
z
plot(z,main=paste('Residual Lag plot, lowess, and regression line'), ylab='values of Residuals', xlab='lagged values of Residuals')
lines(lowess(z))
abline(lm(z))
grid()
dev.off()
bitmap(file='test6.png')
acf(mysum$resid, lag.max=length(mysum$resid)/2, main='Residual Autocorrelation Function')
grid()
dev.off()
bitmap(file='test7.png')
pacf(mysum$resid, lag.max=length(mysum$resid)/2, main='Residual Partial Autocorrelation Function')
grid()
dev.off()
bitmap(file='test8.png')
opar <- par(mfrow = c(2,2), oma = c(0, 0, 1.1, 0))
plot(mylm, las = 1, sub='Residual Diagnostics')
par(opar)
dev.off()
if (n > n25) {
bitmap(file='test9.png')
plot(kp3:nmkm3,gqarr[,2], main='Goldfeld-Quandt test',ylab='2-sided p-value',xlab='breakpoint')
grid()
dev.off()
}
load(file='createtable')
a<-table.start()
a<-table.row.start(a)
a<-table.element(a, 'Multiple Linear Regression - Estimated Regression Equation', 1, TRUE)
a<-table.row.end(a)
myeq <- colnames(x)[1]
myeq <- paste(myeq, '[t] = ', sep='')
for (i in 1:k){
if (mysum$coefficients[i,1] > 0) myeq <- paste(myeq, '+', '')
myeq <- paste(myeq, mysum$coefficients[i,1], sep=' ')
if (rownames(mysum$coefficients)[i] != '(Intercept)') {
myeq <- paste(myeq, rownames(mysum$coefficients)[i], sep='')
if (rownames(mysum$coefficients)[i] != 't') myeq <- paste(myeq, '[t]', sep='')
}
}
myeq <- paste(myeq, ' + e[t]')
a<-table.row.start(a)
a<-table.element(a, myeq)
a<-table.row.end(a)
a<-table.end(a)
table.save(a,file='mytable1.tab')
a<-table.start()
a<-table.row.start(a)
a<-table.element(a,hyperlink('ols1.htm','Multiple Linear Regression - Ordinary Least Squares',''), 6, TRUE)
a<-table.row.end(a)
a<-table.row.start(a)
a<-table.element(a,'Variable',header=TRUE)
a<-table.element(a,'Parameter',header=TRUE)
a<-table.element(a,'S.D.',header=TRUE)
a<-table.element(a,'T-STAT
H0: parameter = 0',header=TRUE)
a<-table.element(a,'2-tail p-value',header=TRUE)
a<-table.element(a,'1-tail p-value',header=TRUE)
a<-table.row.end(a)
for (i in 1:k){
a<-table.row.start(a)
a<-table.element(a,rownames(mysum$coefficients)[i],header=TRUE)
a<-table.element(a,mysum$coefficients[i,1])
a<-table.element(a, round(mysum$coefficients[i,2],6))
a<-table.element(a, round(mysum$coefficients[i,3],4))
a<-table.element(a, round(mysum$coefficients[i,4],6))
a<-table.element(a, round(mysum$coefficients[i,4]/2,6))
a<-table.row.end(a)
}
a<-table.end(a)
table.save(a,file='mytable2.tab')
a<-table.start()
a<-table.row.start(a)
a<-table.element(a, 'Multiple Linear Regression - Regression Statistics', 2, TRUE)
a<-table.row.end(a)
a<-table.row.start(a)
a<-table.element(a, 'Multiple R',1,TRUE)
a<-table.element(a, sqrt(mysum$r.squared))
a<-table.row.end(a)
a<-table.row.start(a)
a<-table.element(a, 'R-squared',1,TRUE)
a<-table.element(a, mysum$r.squared)
a<-table.row.end(a)
a<-table.row.start(a)
a<-table.element(a, 'Adjusted R-squared',1,TRUE)
a<-table.element(a, mysum$adj.r.squared)
a<-table.row.end(a)
a<-table.row.start(a)
a<-table.element(a, 'F-TEST (value)',1,TRUE)
a<-table.element(a, mysum$fstatistic[1])
a<-table.row.end(a)
a<-table.row.start(a)
a<-table.element(a, 'F-TEST (DF numerator)',1,TRUE)
a<-table.element(a, mysum$fstatistic[2])
a<-table.row.end(a)
a<-table.row.start(a)
a<-table.element(a, 'F-TEST (DF denominator)',1,TRUE)
a<-table.element(a, mysum$fstatistic[3])
a<-table.row.end(a)
a<-table.row.start(a)
a<-table.element(a, 'p-value',1,TRUE)
a<-table.element(a, 1-pf(mysum$fstatistic[1],mysum$fstatistic[2],mysum$fstatistic[3]))
a<-table.row.end(a)
a<-table.row.start(a)
a<-table.element(a, 'Multiple Linear Regression - Residual Statistics', 2, TRUE)
a<-table.row.end(a)
a<-table.row.start(a)
a<-table.element(a, 'Residual Standard Deviation',1,TRUE)
a<-table.element(a, mysum$sigma)
a<-table.row.end(a)
a<-table.row.start(a)
a<-table.element(a, 'Sum Squared Residuals',1,TRUE)
a<-table.element(a, sum(myerror*myerror))
a<-table.row.end(a)
a<-table.end(a)
table.save(a,file='mytable3.tab')
a<-table.start()
a<-table.row.start(a)
a<-table.element(a, 'Multiple Linear Regression - Actuals, Interpolation, and Residuals', 4, TRUE)
a<-table.row.end(a)
a<-table.row.start(a)
a<-table.element(a, 'Time or Index', 1, TRUE)
a<-table.element(a, 'Actuals', 1, TRUE)
a<-table.element(a, 'Interpolation
Forecast', 1, TRUE)
a<-table.element(a, 'Residuals
Prediction Error', 1, TRUE)
a<-table.row.end(a)
for (i in 1:n) {
a<-table.row.start(a)
a<-table.element(a,i, 1, TRUE)
a<-table.element(a,x[i])
a<-table.element(a,x[i]-mysum$resid[i])
a<-table.element(a,mysum$resid[i])
a<-table.row.end(a)
}
a<-table.end(a)
table.save(a,file='mytable4.tab')
if (n > n25) {
a<-table.start()
a<-table.row.start(a)
a<-table.element(a,'Goldfeld-Quandt test for Heteroskedasticity',4,TRUE)
a<-table.row.end(a)
a<-table.row.start(a)
a<-table.element(a,'p-values',header=TRUE)
a<-table.element(a,'Alternative Hypothesis',3,header=TRUE)
a<-table.row.end(a)
a<-table.row.start(a)
a<-table.element(a,'breakpoint index',header=TRUE)
a<-table.element(a,'greater',header=TRUE)
a<-table.element(a,'2-sided',header=TRUE)
a<-table.element(a,'less',header=TRUE)
a<-table.row.end(a)
for (mypoint in kp3:nmkm3) {
a<-table.row.start(a)
a<-table.element(a,mypoint,header=TRUE)
a<-table.element(a,gqarr[mypoint-kp3+1,1])
a<-table.element(a,gqarr[mypoint-kp3+1,2])
a<-table.element(a,gqarr[mypoint-kp3+1,3])
a<-table.row.end(a)
}
a<-table.end(a)
table.save(a,file='mytable5.tab')
a<-table.start()
a<-table.row.start(a)
a<-table.element(a,'Meta Analysis of Goldfeld-Quandt test for Heteroskedasticity',4,TRUE)
a<-table.row.end(a)
a<-table.row.start(a)
a<-table.element(a,'Description',header=TRUE)
a<-table.element(a,'# significant tests',header=TRUE)
a<-table.element(a,'% significant tests',header=TRUE)
a<-table.element(a,'OK/NOK',header=TRUE)
a<-table.row.end(a)
a<-table.row.start(a)
a<-table.element(a,'1% type I error level',header=TRUE)
a<-table.element(a,numsignificant1)
a<-table.element(a,numsignificant1/numgqtests)
if (numsignificant1/numgqtests < 0.01) dum <- 'OK' else dum <- 'NOK'
a<-table.element(a,dum)
a<-table.row.end(a)
a<-table.row.start(a)
a<-table.element(a,'5% type I error level',header=TRUE)
a<-table.element(a,numsignificant5)
a<-table.element(a,numsignificant5/numgqtests)
if (numsignificant5/numgqtests < 0.05) dum <- 'OK' else dum <- 'NOK'
a<-table.element(a,dum)
a<-table.row.end(a)
a<-table.row.start(a)
a<-table.element(a,'10% type I error level',header=TRUE)
a<-table.element(a,numsignificant10)
a<-table.element(a,numsignificant10/numgqtests)
if (numsignificant10/numgqtests < 0.1) dum <- 'OK' else dum <- 'NOK'
a<-table.element(a,dum)
a<-table.row.end(a)
a<-table.end(a)
table.save(a,file='mytable6.tab')
}