Free Statistics

of Irreproducible Research!

Author's title

Author*Unverified author*
R Software Modulerwasp_multipleregression.wasp
Title produced by softwareMultiple Regression
Date of computationWed, 19 Nov 2008 00:58:20 -0700
Cite this page as followsStatistical Computations at FreeStatistics.org, Office for Research Development and Education, URL https://freestatistics.org/blog/index.php?v=date/2008/Nov/19/t122708163969a8a7fc4hmya85.htm/, Retrieved Sun, 19 May 2024 10:10:00 +0000
Statistical Computations at FreeStatistics.org, Office for Research Development and Education, URL https://freestatistics.org/blog/index.php?pk=25008, Retrieved Sun, 19 May 2024 10:10:00 +0000
QR Codes:

Original text written by user:
IsPrivate?No (this computation is public)
User-defined keywordsjulie govaerts ws3
Estimated Impact220
Family? (F = Feedback message, R = changed R code, M = changed R Module, P = changed Parameters, D = changed Data)
F       [Multiple Regression] [multiple regressi...] [2008-11-19 07:58:20] [ff1af8c6f1c2f1c0e8def9bfc9355be9] [Current]
Feedback Forum
2008-11-28 13:01:30 [Julie Govaerts] [reply
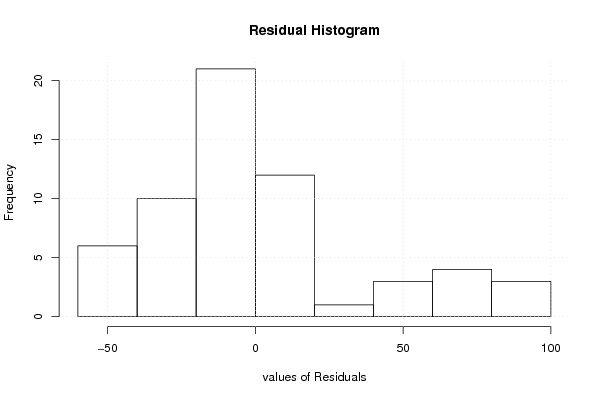
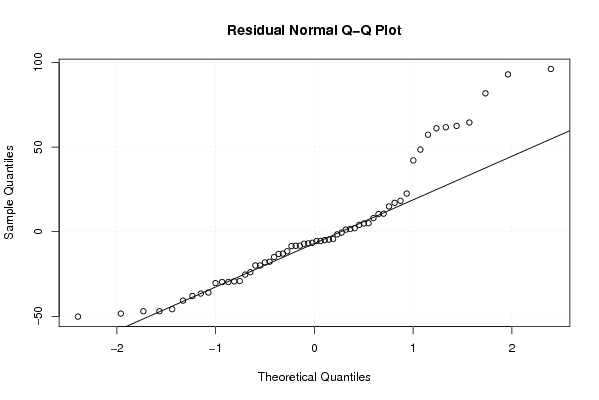
De “Residuals”- grafiek toont ons de fouten in de voorspellingen in de periodes. Normaal gezien zou het gemiddelde van deze fouten gelijk aan 0 moeten zijn en dus constant. Wanneer we dan de grafiek verder onderzoeken, merken we dat deze assumptie helemaal niet klopt. We kunnen duidelijk een golvend patroon ontdekken, hetwelk aangeeft dat we inderdaad de verkeerde assumpties hebben gehandhaafd en ons doet realiseren dat we belangrijke variabelen zijn vergeten op te nemen in het onderzoek. Dus kunnen we aannemen dat het mogelijk is dat er gegevens uit het verleden ontbreken.

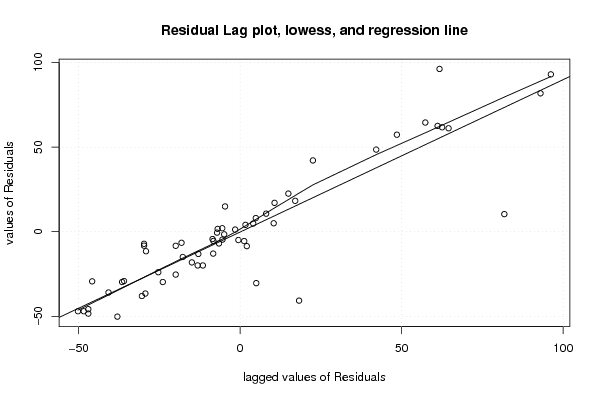
De Residual Lag plot grafiek heeft als doel de voorspellingsfouten van nu te vergelijken met deze van de vorige maand. De Y is de voorspellingsfout van de huidige periode en X is deze van één periode geleden DUS e(t) vergelijken met e (t-1) = 1 periode vertraagt. Hieruit kunnen we enig besluiten dat er een verband bestaat. Er valt een positieve correlatie waar te nemen, wat erop wijst dat er enige voorspelbaarheid is op basis van het verleden

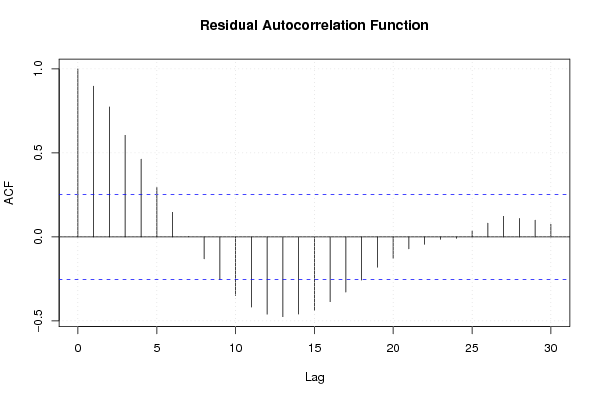
De Residual Autocorrelation Function wordt gekenmerkt door zijn blauwe stippellijnen en zijn verticale lijnen (dezen stellen de correlatie van de voorspellingsfouten voor). De stippellijnen duiden het betrouwbaarheidsinterval van 95% aan. Op het moment dat de verticale lijnen zodanig lang zijn dat ze de stippellijnen (en dus het betrouwbaarheidsinterval) passeren zijn de waarden ervan significant verschillend. Aldus zijn we in staat te concluderen dat de voorspellingsfouten niet toe te schrijven zijn aan toeval. In deze Residual Autocorrelation Function zien we dat dit daadwerkelijk het geval is in zowel het begin (aan de bovenkant) als bij de Lags van ongeveer 30 tot 50 (aan de onderkant), waaruit volgt dat het model nog niet goed is --> veel correlatiecoëfficiënten verschillen significant van 0
2008-11-30 10:55:24 [94a54c888ac7f7d6874c3108eb0e1808] [reply
de student geeft bij elke grafiek een duidelijke beschrijving en komt tot het juiste resultaat dat het model nog niet goed is.
2008-11-30 16:47:20 [Glenn Maras] [reply
De student zijn model gaat over de werkloosheid voor en na het rookverbod in restaurants. In de tabellen bespreekt ze duidelijk verschillende waarden. Alleen de pwaarde wordt niet besproken en hier zien we toch wel opvallende waarden. De pwaarden zijn steeds groter dan 5% en zelfs hoger dan 20%. Dit wijst erop dat het verwerpen van de nulhypothese niet significant is. Ook de F-test is maar 4.10 wat erop wijst dat het de kans groot is dat het aan toeval toe te wijzen is.
In de interpolation grafiek is er een duidelijke daling sinds de invoering van de wet. De residuals liggen zijn niet constant en niet 0 dus deze asumptie is niet voldaan. In de lag plot is er toch ook wel een duidelijk verband te zien. Dat mag ook niet het geval zijn dus die assumptie is ook niet voldaan.
2008-12-01 19:18:46 [Vincent Vanden Poel] [reply
Je hebt een interessante studie gedaan. Ook heb je grotendeels een juiste interpretatie gegeven en is ook het besluit van je model correct.

Wat je wel nog had kunnen onderzoeken is of er al dan niet sprake is van seizoenaliteit. In dit geval is dit duidelijk niet het geval (dit kunnen we weten door te kijken naar de 'actuals and interpolations'). We zien geen herhaalde pieken of dalingen om de 12 maanden.

Verder had je de t-variabele kunnen vermelden. Dit is de voorspellingsfout op lange termijn. Hiermee moet dus ook rekening gehouden worden met het beoordelen van het model.

Ook geeft je model geen foute p-value weer. Een waarde van bv. 1.7e-05 wijst er op dat dit getal zeer klein is.

Je geeft ook zeer beperkte uitleg bij de overige grafieken maar aan Q2 kan ik wel zien dat je deze goed kan interpreteren.
2008-12-01 20:42:14 [Julian De Ruyter] [reply
Q1: Je conclusie was correct en vrij volledig maar dit kon je er nog aan toevoegen.
We kijken hier enkel naar one-tailed p-waarden omdat we ervan uitgaan dat het dragen van een gordel geen negatieve effecten veroorzaakt.
We kunnen hieruit wel vaststellen dat alle 1-zijdige p-waarden kleiner zijn dan 0.05. Deze p-waarden zijn dus kleiner dan Type I error, wat impliceert dat het effect van het dragen van een gordel, niet door toeval ontstaat en dat de nulhypothese dus verworpen wordt. Het dragen van een gordel heeft dus zeer duidelijk een positief effect, doordat er een significant verschil is.

Het intercept van 2324 slachtoffers is niet helemaal correct, dit getal kan
nog afwijken naar boven of onder met ongeveer 44 personen (standaard
deviatie) = foutenmarge

Q2:
Zeer correct en volledig.
2008-12-01 20:44:13 [Julian De Ruyter] [reply
Hierboven is verkeerd gepost.

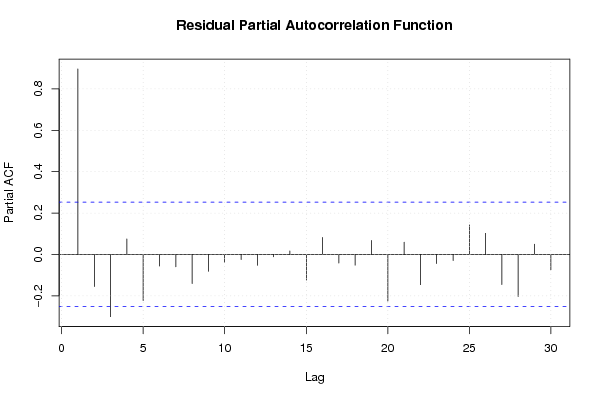
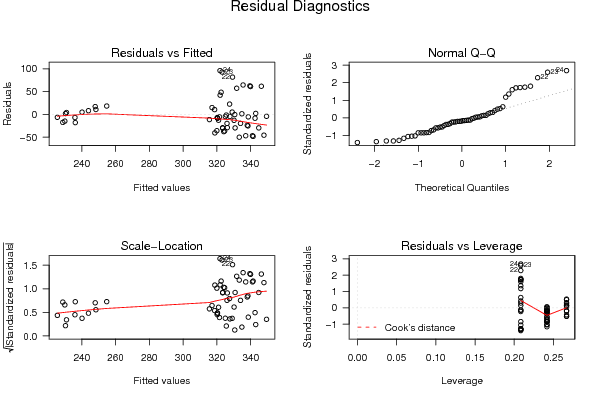
De student heeft het model goed uitgelegd en besproken zoals in Q2 en is tot de juiste conclusie gekomen dat het geen goed en bruikbaar model is.

Post a new message
Dataseries X:
345	0
334	0
345	0
333	0
336	0
324	0
320	0
330	0
313	0
301	0
288	0
294	0
302	0
294	0
293	0
290	0
283	0
286	0
293	0
334	0
329	0
411	0
416	0
418	0
408	0
402	0
401	0
400	0
389	0
371	0
364	0
350	0
332	0
323	0
316	0
312	0
315	0
314	0
313	0
314	0
317	0
308	0
312	0
306	0
304	0
297	0
284	0
278	0
273	1
265	1
259	1
252	1
245	1
235	1
232	1
229	1
219	1
218	1
215	1
211	1


Summary of computational transaction
Raw Inputview raw input (R code)
Raw Outputview raw output of R engine
Computing time5 seconds
R Server'Sir Ronald Aylmer Fisher' @ 193.190.124.24

\begin{tabular}{lllllllll}
\hline
Summary of computational transaction \tabularnewline
Raw Input & view raw input (R code)  \tabularnewline
Raw Output & view raw output of R engine  \tabularnewline
Computing time & 5 seconds \tabularnewline
R Server & 'Sir Ronald Aylmer Fisher' @ 193.190.124.24 \tabularnewline
\hline
\end{tabular}
%Source: https://freestatistics.org/blog/index.php?pk=25008&T=0

[TABLE]
[ROW][C]Summary of computational transaction[/C][/ROW]
[ROW][C]Raw Input[/C][C]view raw input (R code) [/C][/ROW]
[ROW][C]Raw Output[/C][C]view raw output of R engine [/C][/ROW]
[ROW][C]Computing time[/C][C]5 seconds[/C][/ROW]
[ROW][C]R Server[/C][C]'Sir Ronald Aylmer Fisher' @ 193.190.124.24[/C][/ROW]
[/TABLE]
Source: https://freestatistics.org/blog/index.php?pk=25008&T=0

Globally Unique Identifier (entire table): ba.freestatistics.org/blog/index.php?pk=25008&T=0

As an alternative you can also use a QR Code:  

The GUIDs for individual cells are displayed in the table below:

Summary of computational transaction
Raw Inputview raw input (R code)
Raw Outputview raw output of R engine
Computing time5 seconds
R Server'Sir Ronald Aylmer Fisher' @ 193.190.124.24


Multiple Linear Regression - Estimated Regression Equation
werkloosheid_tabakssector[t] = + 324.891666666667 -88.4583333333334verbod_of_niet[t] + 24.5944444444444M1[t] + 17.9222222222222M2[t] + 18.45M3[t] + 14.1777777777778M4[t] + 10.5055555555556M5[t] + 1.43333333333334M6[t] + 0.961111111111122M7[t] + 6.6888888888889M8[t] -3.58333333333332M9[t] + 7.14444444444445M10[t] + 1.07222222222223M11[t] -0.127777777777777t + e[t]

\begin{tabular}{lllllllll}
\hline
Multiple Linear Regression - Estimated Regression Equation \tabularnewline
werkloosheid_tabakssector[t] =  +  324.891666666667 -88.4583333333334verbod_of_niet[t] +  24.5944444444444M1[t] +  17.9222222222222M2[t] +  18.45M3[t] +  14.1777777777778M4[t] +  10.5055555555556M5[t] +  1.43333333333334M6[t] +  0.961111111111122M7[t] +  6.6888888888889M8[t] -3.58333333333332M9[t] +  7.14444444444445M10[t] +  1.07222222222223M11[t] -0.127777777777777t  + e[t] \tabularnewline
\hline
\end{tabular}
%Source: https://freestatistics.org/blog/index.php?pk=25008&T=1

[TABLE]
[ROW][C]Multiple Linear Regression - Estimated Regression Equation[/C][/ROW]
[ROW][C]werkloosheid_tabakssector[t] =  +  324.891666666667 -88.4583333333334verbod_of_niet[t] +  24.5944444444444M1[t] +  17.9222222222222M2[t] +  18.45M3[t] +  14.1777777777778M4[t] +  10.5055555555556M5[t] +  1.43333333333334M6[t] +  0.961111111111122M7[t] +  6.6888888888889M8[t] -3.58333333333332M9[t] +  7.14444444444445M10[t] +  1.07222222222223M11[t] -0.127777777777777t  + e[t][/C][/ROW]
[/TABLE]
Source: https://freestatistics.org/blog/index.php?pk=25008&T=1

Globally Unique Identifier (entire table): ba.freestatistics.org/blog/index.php?pk=25008&T=1

As an alternative you can also use a QR Code:  

The GUIDs for individual cells are displayed in the table below:

Multiple Linear Regression - Estimated Regression Equation
werkloosheid_tabakssector[t] = + 324.891666666667 -88.4583333333334verbod_of_niet[t] + 24.5944444444444M1[t] + 17.9222222222222M2[t] + 18.45M3[t] + 14.1777777777778M4[t] + 10.5055555555556M5[t] + 1.43333333333334M6[t] + 0.961111111111122M7[t] + 6.6888888888889M8[t] -3.58333333333332M9[t] + 7.14444444444445M10[t] + 1.07222222222223M11[t] -0.127777777777777t + e[t]


Multiple Linear Regression - Ordinary Least Squares
VariableParameterS.D.T-STATH0: parameter = 02-tail p-value1-tail p-value
(Intercept)324.89166666666722.37493214.520300
verbod_of_niet-88.458333333333418.392081-4.80961.7e-058e-06
M124.594444444444425.9271090.94860.3477810.173891
M217.922222222222225.850890.69330.4916120.245806
M318.4525.7817360.71560.4778410.238921
M414.177777777777825.7197030.55120.5841360.292068
M510.505555555555625.6648440.40930.6841930.342096
M61.4333333333333425.6172050.0560.9556220.477811
M70.96111111111112225.5768250.03760.9701870.485094
M86.688888888888925.543740.26190.7945980.397299
M9-3.5833333333333225.517977-0.14040.8889380.444469
M107.1444444444444525.4995590.28020.7805960.390298
M111.0722222222222325.4885020.04210.9666270.483314
t-0.1277777777777770.433506-0.29480.7695070.384754

\begin{tabular}{lllllllll}
\hline
Multiple Linear Regression - Ordinary Least Squares \tabularnewline
Variable & Parameter & S.D. & T-STATH0: parameter = 0 & 2-tail p-value & 1-tail p-value \tabularnewline
(Intercept) & 324.891666666667 & 22.374932 & 14.5203 & 0 & 0 \tabularnewline
verbod_of_niet & -88.4583333333334 & 18.392081 & -4.8096 & 1.7e-05 & 8e-06 \tabularnewline
M1 & 24.5944444444444 & 25.927109 & 0.9486 & 0.347781 & 0.173891 \tabularnewline
M2 & 17.9222222222222 & 25.85089 & 0.6933 & 0.491612 & 0.245806 \tabularnewline
M3 & 18.45 & 25.781736 & 0.7156 & 0.477841 & 0.238921 \tabularnewline
M4 & 14.1777777777778 & 25.719703 & 0.5512 & 0.584136 & 0.292068 \tabularnewline
M5 & 10.5055555555556 & 25.664844 & 0.4093 & 0.684193 & 0.342096 \tabularnewline
M6 & 1.43333333333334 & 25.617205 & 0.056 & 0.955622 & 0.477811 \tabularnewline
M7 & 0.961111111111122 & 25.576825 & 0.0376 & 0.970187 & 0.485094 \tabularnewline
M8 & 6.6888888888889 & 25.54374 & 0.2619 & 0.794598 & 0.397299 \tabularnewline
M9 & -3.58333333333332 & 25.517977 & -0.1404 & 0.888938 & 0.444469 \tabularnewline
M10 & 7.14444444444445 & 25.499559 & 0.2802 & 0.780596 & 0.390298 \tabularnewline
M11 & 1.07222222222223 & 25.488502 & 0.0421 & 0.966627 & 0.483314 \tabularnewline
t & -0.127777777777777 & 0.433506 & -0.2948 & 0.769507 & 0.384754 \tabularnewline
\hline
\end{tabular}
%Source: https://freestatistics.org/blog/index.php?pk=25008&T=2

[TABLE]
[ROW][C]Multiple Linear Regression - Ordinary Least Squares[/C][/ROW]
[ROW][C]Variable[/C][C]Parameter[/C][C]S.D.[/C][C]T-STATH0: parameter = 0[/C][C]2-tail p-value[/C][C]1-tail p-value[/C][/ROW]
[ROW][C](Intercept)[/C][C]324.891666666667[/C][C]22.374932[/C][C]14.5203[/C][C]0[/C][C]0[/C][/ROW]
[ROW][C]verbod_of_niet[/C][C]-88.4583333333334[/C][C]18.392081[/C][C]-4.8096[/C][C]1.7e-05[/C][C]8e-06[/C][/ROW]
[ROW][C]M1[/C][C]24.5944444444444[/C][C]25.927109[/C][C]0.9486[/C][C]0.347781[/C][C]0.173891[/C][/ROW]
[ROW][C]M2[/C][C]17.9222222222222[/C][C]25.85089[/C][C]0.6933[/C][C]0.491612[/C][C]0.245806[/C][/ROW]
[ROW][C]M3[/C][C]18.45[/C][C]25.781736[/C][C]0.7156[/C][C]0.477841[/C][C]0.238921[/C][/ROW]
[ROW][C]M4[/C][C]14.1777777777778[/C][C]25.719703[/C][C]0.5512[/C][C]0.584136[/C][C]0.292068[/C][/ROW]
[ROW][C]M5[/C][C]10.5055555555556[/C][C]25.664844[/C][C]0.4093[/C][C]0.684193[/C][C]0.342096[/C][/ROW]
[ROW][C]M6[/C][C]1.43333333333334[/C][C]25.617205[/C][C]0.056[/C][C]0.955622[/C][C]0.477811[/C][/ROW]
[ROW][C]M7[/C][C]0.961111111111122[/C][C]25.576825[/C][C]0.0376[/C][C]0.970187[/C][C]0.485094[/C][/ROW]
[ROW][C]M8[/C][C]6.6888888888889[/C][C]25.54374[/C][C]0.2619[/C][C]0.794598[/C][C]0.397299[/C][/ROW]
[ROW][C]M9[/C][C]-3.58333333333332[/C][C]25.517977[/C][C]-0.1404[/C][C]0.888938[/C][C]0.444469[/C][/ROW]
[ROW][C]M10[/C][C]7.14444444444445[/C][C]25.499559[/C][C]0.2802[/C][C]0.780596[/C][C]0.390298[/C][/ROW]
[ROW][C]M11[/C][C]1.07222222222223[/C][C]25.488502[/C][C]0.0421[/C][C]0.966627[/C][C]0.483314[/C][/ROW]
[ROW][C]t[/C][C]-0.127777777777777[/C][C]0.433506[/C][C]-0.2948[/C][C]0.769507[/C][C]0.384754[/C][/ROW]
[/TABLE]
Source: https://freestatistics.org/blog/index.php?pk=25008&T=2

Globally Unique Identifier (entire table): ba.freestatistics.org/blog/index.php?pk=25008&T=2

As an alternative you can also use a QR Code:  

The GUIDs for individual cells are displayed in the table below:

Multiple Linear Regression - Ordinary Least Squares
VariableParameterS.D.T-STATH0: parameter = 02-tail p-value1-tail p-value
(Intercept)324.89166666666722.37493214.520300
verbod_of_niet-88.458333333333418.392081-4.80961.7e-058e-06
M124.594444444444425.9271090.94860.3477810.173891
M217.922222222222225.850890.69330.4916120.245806
M318.4525.7817360.71560.4778410.238921
M414.177777777777825.7197030.55120.5841360.292068
M510.505555555555625.6648440.40930.6841930.342096
M61.4333333333333425.6172050.0560.9556220.477811
M70.96111111111112225.5768250.03760.9701870.485094
M86.688888888888925.543740.26190.7945980.397299
M9-3.5833333333333225.517977-0.14040.8889380.444469
M107.1444444444444525.4995590.28020.7805960.390298
M111.0722222222222325.4885020.04210.9666270.483314
t-0.1277777777777770.433506-0.29480.7695070.384754


Multiple Linear Regression - Regression Statistics
Multiple R0.732841412972618
R-squared0.537056536567703
Adjusted R-squared0.406224688206402
F-TEST (value)4.10493731682659
F-TEST (DF numerator)13
F-TEST (DF denominator)46
p-value0.000179735637534595
Multiple Linear Regression - Residual Statistics
Residual Standard Deviation40.2950306210781
Sum Squared Residuals74689.7166666667

\begin{tabular}{lllllllll}
\hline
Multiple Linear Regression - Regression Statistics \tabularnewline
Multiple R & 0.732841412972618 \tabularnewline
R-squared & 0.537056536567703 \tabularnewline
Adjusted R-squared & 0.406224688206402 \tabularnewline
F-TEST (value) & 4.10493731682659 \tabularnewline
F-TEST (DF numerator) & 13 \tabularnewline
F-TEST (DF denominator) & 46 \tabularnewline
p-value & 0.000179735637534595 \tabularnewline
Multiple Linear Regression - Residual Statistics \tabularnewline
Residual Standard Deviation & 40.2950306210781 \tabularnewline
Sum Squared Residuals & 74689.7166666667 \tabularnewline
\hline
\end{tabular}
%Source: https://freestatistics.org/blog/index.php?pk=25008&T=3

[TABLE]
[ROW][C]Multiple Linear Regression - Regression Statistics[/C][/ROW]
[ROW][C]Multiple R[/C][C]0.732841412972618[/C][/ROW]
[ROW][C]R-squared[/C][C]0.537056536567703[/C][/ROW]
[ROW][C]Adjusted R-squared[/C][C]0.406224688206402[/C][/ROW]
[ROW][C]F-TEST (value)[/C][C]4.10493731682659[/C][/ROW]
[ROW][C]F-TEST (DF numerator)[/C][C]13[/C][/ROW]
[ROW][C]F-TEST (DF denominator)[/C][C]46[/C][/ROW]
[ROW][C]p-value[/C][C]0.000179735637534595[/C][/ROW]
[ROW][C]Multiple Linear Regression - Residual Statistics[/C][/ROW]
[ROW][C]Residual Standard Deviation[/C][C]40.2950306210781[/C][/ROW]
[ROW][C]Sum Squared Residuals[/C][C]74689.7166666667[/C][/ROW]
[/TABLE]
Source: https://freestatistics.org/blog/index.php?pk=25008&T=3

Globally Unique Identifier (entire table): ba.freestatistics.org/blog/index.php?pk=25008&T=3

As an alternative you can also use a QR Code:  

The GUIDs for individual cells are displayed in the table below:

Multiple Linear Regression - Regression Statistics
Multiple R0.732841412972618
R-squared0.537056536567703
Adjusted R-squared0.406224688206402
F-TEST (value)4.10493731682659
F-TEST (DF numerator)13
F-TEST (DF denominator)46
p-value0.000179735637534595
Multiple Linear Regression - Residual Statistics
Residual Standard Deviation40.2950306210781
Sum Squared Residuals74689.7166666667


Multiple Linear Regression - Actuals, Interpolation, and Residuals
Time or IndexActualsInterpolationForecastResidualsPrediction Error
1345349.358333333333-4.35833333333349
2334342.558333333333-8.55833333333334
3345342.9583333333332.04166666666669
4333338.558333333333-5.55833333333332
5336334.7583333333331.24166666666668
6324325.558333333333-1.55833333333333
7320324.958333333333-4.95833333333333
8330330.558333333333-0.558333333333333
9313320.158333333333-7.15833333333332
10301330.758333333333-29.7583333333333
11288324.558333333333-36.5583333333333
12294323.358333333333-29.3583333333333
13302347.825-45.825
14294341.025-47.025
15293341.425-48.425
16290337.025-47.025
17283333.225-50.225
18286324.025-38.025
19293323.425-30.425
20334329.0254.975
21329318.62510.375
22411329.22581.775
23416323.02592.975
24418321.82596.175
25408346.29166666666761.7083333333334
26402339.49166666666762.5083333333333
27401339.89166666666761.1083333333333
28400335.49166666666764.5083333333333
29389331.69166666666757.3083333333333
30371322.49166666666748.5083333333333
31364321.89166666666742.1083333333333
32350327.49166666666722.5083333333333
33332317.09166666666714.9083333333333
34323327.691666666667-4.69166666666667
35316321.491666666667-5.49166666666666
36312320.291666666667-8.29166666666666
37315344.758333333333-29.7583333333333
38314337.958333333333-23.9583333333333
39313338.358333333333-25.3583333333333
40314333.958333333333-19.9583333333333
41317330.158333333333-13.1583333333333
42308320.958333333333-12.9583333333333
43312320.358333333333-8.35833333333335
44306325.958333333333-19.9583333333333
45304315.558333333333-11.5583333333333
46297326.158333333333-29.1583333333333
47284319.958333333333-35.9583333333333
48278318.758333333333-40.7583333333333
49273254.76666666666718.2333333333334
50265247.96666666666717.0333333333333
51259248.36666666666710.6333333333333
52252243.9666666666678.03333333333334
53245240.1666666666674.83333333333333
54235230.9666666666674.03333333333333
55232230.3666666666671.63333333333333
56229235.966666666667-6.96666666666668
57219225.566666666667-6.56666666666667
58218236.166666666667-18.1666666666667
59215229.966666666667-14.9666666666667
60211228.766666666667-17.7666666666667

\begin{tabular}{lllllllll}
\hline
Multiple Linear Regression - Actuals, Interpolation, and Residuals \tabularnewline
Time or Index & Actuals & InterpolationForecast & ResidualsPrediction Error \tabularnewline
1 & 345 & 349.358333333333 & -4.35833333333349 \tabularnewline
2 & 334 & 342.558333333333 & -8.55833333333334 \tabularnewline
3 & 345 & 342.958333333333 & 2.04166666666669 \tabularnewline
4 & 333 & 338.558333333333 & -5.55833333333332 \tabularnewline
5 & 336 & 334.758333333333 & 1.24166666666668 \tabularnewline
6 & 324 & 325.558333333333 & -1.55833333333333 \tabularnewline
7 & 320 & 324.958333333333 & -4.95833333333333 \tabularnewline
8 & 330 & 330.558333333333 & -0.558333333333333 \tabularnewline
9 & 313 & 320.158333333333 & -7.15833333333332 \tabularnewline
10 & 301 & 330.758333333333 & -29.7583333333333 \tabularnewline
11 & 288 & 324.558333333333 & -36.5583333333333 \tabularnewline
12 & 294 & 323.358333333333 & -29.3583333333333 \tabularnewline
13 & 302 & 347.825 & -45.825 \tabularnewline
14 & 294 & 341.025 & -47.025 \tabularnewline
15 & 293 & 341.425 & -48.425 \tabularnewline
16 & 290 & 337.025 & -47.025 \tabularnewline
17 & 283 & 333.225 & -50.225 \tabularnewline
18 & 286 & 324.025 & -38.025 \tabularnewline
19 & 293 & 323.425 & -30.425 \tabularnewline
20 & 334 & 329.025 & 4.975 \tabularnewline
21 & 329 & 318.625 & 10.375 \tabularnewline
22 & 411 & 329.225 & 81.775 \tabularnewline
23 & 416 & 323.025 & 92.975 \tabularnewline
24 & 418 & 321.825 & 96.175 \tabularnewline
25 & 408 & 346.291666666667 & 61.7083333333334 \tabularnewline
26 & 402 & 339.491666666667 & 62.5083333333333 \tabularnewline
27 & 401 & 339.891666666667 & 61.1083333333333 \tabularnewline
28 & 400 & 335.491666666667 & 64.5083333333333 \tabularnewline
29 & 389 & 331.691666666667 & 57.3083333333333 \tabularnewline
30 & 371 & 322.491666666667 & 48.5083333333333 \tabularnewline
31 & 364 & 321.891666666667 & 42.1083333333333 \tabularnewline
32 & 350 & 327.491666666667 & 22.5083333333333 \tabularnewline
33 & 332 & 317.091666666667 & 14.9083333333333 \tabularnewline
34 & 323 & 327.691666666667 & -4.69166666666667 \tabularnewline
35 & 316 & 321.491666666667 & -5.49166666666666 \tabularnewline
36 & 312 & 320.291666666667 & -8.29166666666666 \tabularnewline
37 & 315 & 344.758333333333 & -29.7583333333333 \tabularnewline
38 & 314 & 337.958333333333 & -23.9583333333333 \tabularnewline
39 & 313 & 338.358333333333 & -25.3583333333333 \tabularnewline
40 & 314 & 333.958333333333 & -19.9583333333333 \tabularnewline
41 & 317 & 330.158333333333 & -13.1583333333333 \tabularnewline
42 & 308 & 320.958333333333 & -12.9583333333333 \tabularnewline
43 & 312 & 320.358333333333 & -8.35833333333335 \tabularnewline
44 & 306 & 325.958333333333 & -19.9583333333333 \tabularnewline
45 & 304 & 315.558333333333 & -11.5583333333333 \tabularnewline
46 & 297 & 326.158333333333 & -29.1583333333333 \tabularnewline
47 & 284 & 319.958333333333 & -35.9583333333333 \tabularnewline
48 & 278 & 318.758333333333 & -40.7583333333333 \tabularnewline
49 & 273 & 254.766666666667 & 18.2333333333334 \tabularnewline
50 & 265 & 247.966666666667 & 17.0333333333333 \tabularnewline
51 & 259 & 248.366666666667 & 10.6333333333333 \tabularnewline
52 & 252 & 243.966666666667 & 8.03333333333334 \tabularnewline
53 & 245 & 240.166666666667 & 4.83333333333333 \tabularnewline
54 & 235 & 230.966666666667 & 4.03333333333333 \tabularnewline
55 & 232 & 230.366666666667 & 1.63333333333333 \tabularnewline
56 & 229 & 235.966666666667 & -6.96666666666668 \tabularnewline
57 & 219 & 225.566666666667 & -6.56666666666667 \tabularnewline
58 & 218 & 236.166666666667 & -18.1666666666667 \tabularnewline
59 & 215 & 229.966666666667 & -14.9666666666667 \tabularnewline
60 & 211 & 228.766666666667 & -17.7666666666667 \tabularnewline
\hline
\end{tabular}
%Source: https://freestatistics.org/blog/index.php?pk=25008&T=4

[TABLE]
[ROW][C]Multiple Linear Regression - Actuals, Interpolation, and Residuals[/C][/ROW]
[ROW][C]Time or Index[/C][C]Actuals[/C][C]InterpolationForecast[/C][C]ResidualsPrediction Error[/C][/ROW]
[ROW][C]1[/C][C]345[/C][C]349.358333333333[/C][C]-4.35833333333349[/C][/ROW]
[ROW][C]2[/C][C]334[/C][C]342.558333333333[/C][C]-8.55833333333334[/C][/ROW]
[ROW][C]3[/C][C]345[/C][C]342.958333333333[/C][C]2.04166666666669[/C][/ROW]
[ROW][C]4[/C][C]333[/C][C]338.558333333333[/C][C]-5.55833333333332[/C][/ROW]
[ROW][C]5[/C][C]336[/C][C]334.758333333333[/C][C]1.24166666666668[/C][/ROW]
[ROW][C]6[/C][C]324[/C][C]325.558333333333[/C][C]-1.55833333333333[/C][/ROW]
[ROW][C]7[/C][C]320[/C][C]324.958333333333[/C][C]-4.95833333333333[/C][/ROW]
[ROW][C]8[/C][C]330[/C][C]330.558333333333[/C][C]-0.558333333333333[/C][/ROW]
[ROW][C]9[/C][C]313[/C][C]320.158333333333[/C][C]-7.15833333333332[/C][/ROW]
[ROW][C]10[/C][C]301[/C][C]330.758333333333[/C][C]-29.7583333333333[/C][/ROW]
[ROW][C]11[/C][C]288[/C][C]324.558333333333[/C][C]-36.5583333333333[/C][/ROW]
[ROW][C]12[/C][C]294[/C][C]323.358333333333[/C][C]-29.3583333333333[/C][/ROW]
[ROW][C]13[/C][C]302[/C][C]347.825[/C][C]-45.825[/C][/ROW]
[ROW][C]14[/C][C]294[/C][C]341.025[/C][C]-47.025[/C][/ROW]
[ROW][C]15[/C][C]293[/C][C]341.425[/C][C]-48.425[/C][/ROW]
[ROW][C]16[/C][C]290[/C][C]337.025[/C][C]-47.025[/C][/ROW]
[ROW][C]17[/C][C]283[/C][C]333.225[/C][C]-50.225[/C][/ROW]
[ROW][C]18[/C][C]286[/C][C]324.025[/C][C]-38.025[/C][/ROW]
[ROW][C]19[/C][C]293[/C][C]323.425[/C][C]-30.425[/C][/ROW]
[ROW][C]20[/C][C]334[/C][C]329.025[/C][C]4.975[/C][/ROW]
[ROW][C]21[/C][C]329[/C][C]318.625[/C][C]10.375[/C][/ROW]
[ROW][C]22[/C][C]411[/C][C]329.225[/C][C]81.775[/C][/ROW]
[ROW][C]23[/C][C]416[/C][C]323.025[/C][C]92.975[/C][/ROW]
[ROW][C]24[/C][C]418[/C][C]321.825[/C][C]96.175[/C][/ROW]
[ROW][C]25[/C][C]408[/C][C]346.291666666667[/C][C]61.7083333333334[/C][/ROW]
[ROW][C]26[/C][C]402[/C][C]339.491666666667[/C][C]62.5083333333333[/C][/ROW]
[ROW][C]27[/C][C]401[/C][C]339.891666666667[/C][C]61.1083333333333[/C][/ROW]
[ROW][C]28[/C][C]400[/C][C]335.491666666667[/C][C]64.5083333333333[/C][/ROW]
[ROW][C]29[/C][C]389[/C][C]331.691666666667[/C][C]57.3083333333333[/C][/ROW]
[ROW][C]30[/C][C]371[/C][C]322.491666666667[/C][C]48.5083333333333[/C][/ROW]
[ROW][C]31[/C][C]364[/C][C]321.891666666667[/C][C]42.1083333333333[/C][/ROW]
[ROW][C]32[/C][C]350[/C][C]327.491666666667[/C][C]22.5083333333333[/C][/ROW]
[ROW][C]33[/C][C]332[/C][C]317.091666666667[/C][C]14.9083333333333[/C][/ROW]
[ROW][C]34[/C][C]323[/C][C]327.691666666667[/C][C]-4.69166666666667[/C][/ROW]
[ROW][C]35[/C][C]316[/C][C]321.491666666667[/C][C]-5.49166666666666[/C][/ROW]
[ROW][C]36[/C][C]312[/C][C]320.291666666667[/C][C]-8.29166666666666[/C][/ROW]
[ROW][C]37[/C][C]315[/C][C]344.758333333333[/C][C]-29.7583333333333[/C][/ROW]
[ROW][C]38[/C][C]314[/C][C]337.958333333333[/C][C]-23.9583333333333[/C][/ROW]
[ROW][C]39[/C][C]313[/C][C]338.358333333333[/C][C]-25.3583333333333[/C][/ROW]
[ROW][C]40[/C][C]314[/C][C]333.958333333333[/C][C]-19.9583333333333[/C][/ROW]
[ROW][C]41[/C][C]317[/C][C]330.158333333333[/C][C]-13.1583333333333[/C][/ROW]
[ROW][C]42[/C][C]308[/C][C]320.958333333333[/C][C]-12.9583333333333[/C][/ROW]
[ROW][C]43[/C][C]312[/C][C]320.358333333333[/C][C]-8.35833333333335[/C][/ROW]
[ROW][C]44[/C][C]306[/C][C]325.958333333333[/C][C]-19.9583333333333[/C][/ROW]
[ROW][C]45[/C][C]304[/C][C]315.558333333333[/C][C]-11.5583333333333[/C][/ROW]
[ROW][C]46[/C][C]297[/C][C]326.158333333333[/C][C]-29.1583333333333[/C][/ROW]
[ROW][C]47[/C][C]284[/C][C]319.958333333333[/C][C]-35.9583333333333[/C][/ROW]
[ROW][C]48[/C][C]278[/C][C]318.758333333333[/C][C]-40.7583333333333[/C][/ROW]
[ROW][C]49[/C][C]273[/C][C]254.766666666667[/C][C]18.2333333333334[/C][/ROW]
[ROW][C]50[/C][C]265[/C][C]247.966666666667[/C][C]17.0333333333333[/C][/ROW]
[ROW][C]51[/C][C]259[/C][C]248.366666666667[/C][C]10.6333333333333[/C][/ROW]
[ROW][C]52[/C][C]252[/C][C]243.966666666667[/C][C]8.03333333333334[/C][/ROW]
[ROW][C]53[/C][C]245[/C][C]240.166666666667[/C][C]4.83333333333333[/C][/ROW]
[ROW][C]54[/C][C]235[/C][C]230.966666666667[/C][C]4.03333333333333[/C][/ROW]
[ROW][C]55[/C][C]232[/C][C]230.366666666667[/C][C]1.63333333333333[/C][/ROW]
[ROW][C]56[/C][C]229[/C][C]235.966666666667[/C][C]-6.96666666666668[/C][/ROW]
[ROW][C]57[/C][C]219[/C][C]225.566666666667[/C][C]-6.56666666666667[/C][/ROW]
[ROW][C]58[/C][C]218[/C][C]236.166666666667[/C][C]-18.1666666666667[/C][/ROW]
[ROW][C]59[/C][C]215[/C][C]229.966666666667[/C][C]-14.9666666666667[/C][/ROW]
[ROW][C]60[/C][C]211[/C][C]228.766666666667[/C][C]-17.7666666666667[/C][/ROW]
[/TABLE]
Source: https://freestatistics.org/blog/index.php?pk=25008&T=4

Globally Unique Identifier (entire table): ba.freestatistics.org/blog/index.php?pk=25008&T=4

As an alternative you can also use a QR Code:  

The GUIDs for individual cells are displayed in the table below:

Multiple Linear Regression - Actuals, Interpolation, and Residuals
Time or IndexActualsInterpolationForecastResidualsPrediction Error
1345349.358333333333-4.35833333333349
2334342.558333333333-8.55833333333334
3345342.9583333333332.04166666666669
4333338.558333333333-5.55833333333332
5336334.7583333333331.24166666666668
6324325.558333333333-1.55833333333333
7320324.958333333333-4.95833333333333
8330330.558333333333-0.558333333333333
9313320.158333333333-7.15833333333332
10301330.758333333333-29.7583333333333
11288324.558333333333-36.5583333333333
12294323.358333333333-29.3583333333333
13302347.825-45.825
14294341.025-47.025
15293341.425-48.425
16290337.025-47.025
17283333.225-50.225
18286324.025-38.025
19293323.425-30.425
20334329.0254.975
21329318.62510.375
22411329.22581.775
23416323.02592.975
24418321.82596.175
25408346.29166666666761.7083333333334
26402339.49166666666762.5083333333333
27401339.89166666666761.1083333333333
28400335.49166666666764.5083333333333
29389331.69166666666757.3083333333333
30371322.49166666666748.5083333333333
31364321.89166666666742.1083333333333
32350327.49166666666722.5083333333333
33332317.09166666666714.9083333333333
34323327.691666666667-4.69166666666667
35316321.491666666667-5.49166666666666
36312320.291666666667-8.29166666666666
37315344.758333333333-29.7583333333333
38314337.958333333333-23.9583333333333
39313338.358333333333-25.3583333333333
40314333.958333333333-19.9583333333333
41317330.158333333333-13.1583333333333
42308320.958333333333-12.9583333333333
43312320.358333333333-8.35833333333335
44306325.958333333333-19.9583333333333
45304315.558333333333-11.5583333333333
46297326.158333333333-29.1583333333333
47284319.958333333333-35.9583333333333
48278318.758333333333-40.7583333333333
49273254.76666666666718.2333333333334
50265247.96666666666717.0333333333333
51259248.36666666666710.6333333333333
52252243.9666666666678.03333333333334
53245240.1666666666674.83333333333333
54235230.9666666666674.03333333333333
55232230.3666666666671.63333333333333
56229235.966666666667-6.96666666666668
57219225.566666666667-6.56666666666667
58218236.166666666667-18.1666666666667
59215229.966666666667-14.9666666666667
60211228.766666666667-17.7666666666667


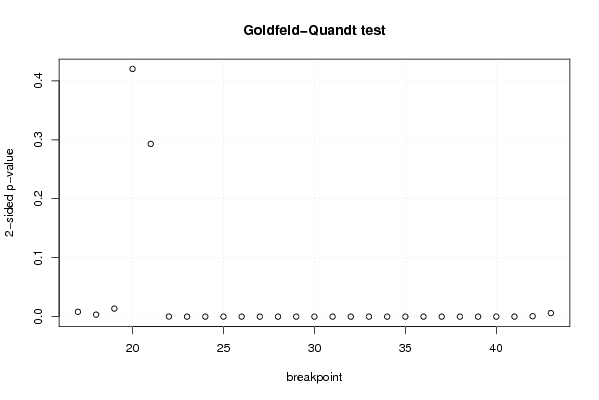
Goldfeld-Quandt test for Heteroskedasticity
p-valuesAlternative Hypothesis
breakpoint indexgreater2-sidedless
170.004094172310481420.008188344620962840.995905827689519
180.001715942393331710.003431884786663420.998284057606668
190.006809566331336750.01361913266267350.993190433668663
200.2100321604110050.4200643208220090.789967839588996
210.8535193188956820.2929613622086350.146480681104318
220.9998944507176050.0002110985647896790.000105549282394839
230.9999982890185773.42196284584564e-061.71098142292282e-06
240.9999998531422622.93715476297507e-071.46857738148753e-07
250.9999998784323812.43135237625979e-071.21567618812989e-07
260.9999998752019262.49596148204764e-071.24798074102382e-07
270.9999998976912472.04617505917158e-071.02308752958579e-07
280.9999999664912076.70175854142186e-083.35087927071093e-08
290.9999999829369243.41261519689676e-081.70630759844838e-08
300.9999999858799482.82401049241727e-081.41200524620864e-08
310.9999999827267823.45464367075137e-081.72732183537569e-08
320.9999999607660787.84678441361228e-083.92339220680614e-08
330.9999998204997753.59000449869678e-071.79500224934839e-07
340.9999994558838161.08823236732711e-065.44116183663555e-07
350.9999981545762463.69084750893643e-061.84542375446822e-06
360.999993598685251.28026294987087e-056.40131474935434e-06
370.9999967052715126.58945697698832e-063.29472848849416e-06
380.9999974234173675.15316526572385e-062.57658263286193e-06
390.9999980337721683.9324556649692e-061.9662278324846e-06
400.9999958189665168.36206696861876e-064.18103348430938e-06
410.999960609850677.8780298658932e-053.9390149329466e-05
420.9996325623183220.0007348753633568910.000367437681678445
430.9969701030413250.006059793917350090.00302989695867504

\begin{tabular}{lllllllll}
\hline
Goldfeld-Quandt test for Heteroskedasticity \tabularnewline
p-values & Alternative Hypothesis \tabularnewline
breakpoint index & greater & 2-sided & less \tabularnewline
17 & 0.00409417231048142 & 0.00818834462096284 & 0.995905827689519 \tabularnewline
18 & 0.00171594239333171 & 0.00343188478666342 & 0.998284057606668 \tabularnewline
19 & 0.00680956633133675 & 0.0136191326626735 & 0.993190433668663 \tabularnewline
20 & 0.210032160411005 & 0.420064320822009 & 0.789967839588996 \tabularnewline
21 & 0.853519318895682 & 0.292961362208635 & 0.146480681104318 \tabularnewline
22 & 0.999894450717605 & 0.000211098564789679 & 0.000105549282394839 \tabularnewline
23 & 0.999998289018577 & 3.42196284584564e-06 & 1.71098142292282e-06 \tabularnewline
24 & 0.999999853142262 & 2.93715476297507e-07 & 1.46857738148753e-07 \tabularnewline
25 & 0.999999878432381 & 2.43135237625979e-07 & 1.21567618812989e-07 \tabularnewline
26 & 0.999999875201926 & 2.49596148204764e-07 & 1.24798074102382e-07 \tabularnewline
27 & 0.999999897691247 & 2.04617505917158e-07 & 1.02308752958579e-07 \tabularnewline
28 & 0.999999966491207 & 6.70175854142186e-08 & 3.35087927071093e-08 \tabularnewline
29 & 0.999999982936924 & 3.41261519689676e-08 & 1.70630759844838e-08 \tabularnewline
30 & 0.999999985879948 & 2.82401049241727e-08 & 1.41200524620864e-08 \tabularnewline
31 & 0.999999982726782 & 3.45464367075137e-08 & 1.72732183537569e-08 \tabularnewline
32 & 0.999999960766078 & 7.84678441361228e-08 & 3.92339220680614e-08 \tabularnewline
33 & 0.999999820499775 & 3.59000449869678e-07 & 1.79500224934839e-07 \tabularnewline
34 & 0.999999455883816 & 1.08823236732711e-06 & 5.44116183663555e-07 \tabularnewline
35 & 0.999998154576246 & 3.69084750893643e-06 & 1.84542375446822e-06 \tabularnewline
36 & 0.99999359868525 & 1.28026294987087e-05 & 6.40131474935434e-06 \tabularnewline
37 & 0.999996705271512 & 6.58945697698832e-06 & 3.29472848849416e-06 \tabularnewline
38 & 0.999997423417367 & 5.15316526572385e-06 & 2.57658263286193e-06 \tabularnewline
39 & 0.999998033772168 & 3.9324556649692e-06 & 1.9662278324846e-06 \tabularnewline
40 & 0.999995818966516 & 8.36206696861876e-06 & 4.18103348430938e-06 \tabularnewline
41 & 0.99996060985067 & 7.8780298658932e-05 & 3.9390149329466e-05 \tabularnewline
42 & 0.999632562318322 & 0.000734875363356891 & 0.000367437681678445 \tabularnewline
43 & 0.996970103041325 & 0.00605979391735009 & 0.00302989695867504 \tabularnewline
\hline
\end{tabular}
%Source: https://freestatistics.org/blog/index.php?pk=25008&T=5

[TABLE]
[ROW][C]Goldfeld-Quandt test for Heteroskedasticity[/C][/ROW]
[ROW][C]p-values[/C][C]Alternative Hypothesis[/C][/ROW]
[ROW][C]breakpoint index[/C][C]greater[/C][C]2-sided[/C][C]less[/C][/ROW]
[ROW][C]17[/C][C]0.00409417231048142[/C][C]0.00818834462096284[/C][C]0.995905827689519[/C][/ROW]
[ROW][C]18[/C][C]0.00171594239333171[/C][C]0.00343188478666342[/C][C]0.998284057606668[/C][/ROW]
[ROW][C]19[/C][C]0.00680956633133675[/C][C]0.0136191326626735[/C][C]0.993190433668663[/C][/ROW]
[ROW][C]20[/C][C]0.210032160411005[/C][C]0.420064320822009[/C][C]0.789967839588996[/C][/ROW]
[ROW][C]21[/C][C]0.853519318895682[/C][C]0.292961362208635[/C][C]0.146480681104318[/C][/ROW]
[ROW][C]22[/C][C]0.999894450717605[/C][C]0.000211098564789679[/C][C]0.000105549282394839[/C][/ROW]
[ROW][C]23[/C][C]0.999998289018577[/C][C]3.42196284584564e-06[/C][C]1.71098142292282e-06[/C][/ROW]
[ROW][C]24[/C][C]0.999999853142262[/C][C]2.93715476297507e-07[/C][C]1.46857738148753e-07[/C][/ROW]
[ROW][C]25[/C][C]0.999999878432381[/C][C]2.43135237625979e-07[/C][C]1.21567618812989e-07[/C][/ROW]
[ROW][C]26[/C][C]0.999999875201926[/C][C]2.49596148204764e-07[/C][C]1.24798074102382e-07[/C][/ROW]
[ROW][C]27[/C][C]0.999999897691247[/C][C]2.04617505917158e-07[/C][C]1.02308752958579e-07[/C][/ROW]
[ROW][C]28[/C][C]0.999999966491207[/C][C]6.70175854142186e-08[/C][C]3.35087927071093e-08[/C][/ROW]
[ROW][C]29[/C][C]0.999999982936924[/C][C]3.41261519689676e-08[/C][C]1.70630759844838e-08[/C][/ROW]
[ROW][C]30[/C][C]0.999999985879948[/C][C]2.82401049241727e-08[/C][C]1.41200524620864e-08[/C][/ROW]
[ROW][C]31[/C][C]0.999999982726782[/C][C]3.45464367075137e-08[/C][C]1.72732183537569e-08[/C][/ROW]
[ROW][C]32[/C][C]0.999999960766078[/C][C]7.84678441361228e-08[/C][C]3.92339220680614e-08[/C][/ROW]
[ROW][C]33[/C][C]0.999999820499775[/C][C]3.59000449869678e-07[/C][C]1.79500224934839e-07[/C][/ROW]
[ROW][C]34[/C][C]0.999999455883816[/C][C]1.08823236732711e-06[/C][C]5.44116183663555e-07[/C][/ROW]
[ROW][C]35[/C][C]0.999998154576246[/C][C]3.69084750893643e-06[/C][C]1.84542375446822e-06[/C][/ROW]
[ROW][C]36[/C][C]0.99999359868525[/C][C]1.28026294987087e-05[/C][C]6.40131474935434e-06[/C][/ROW]
[ROW][C]37[/C][C]0.999996705271512[/C][C]6.58945697698832e-06[/C][C]3.29472848849416e-06[/C][/ROW]
[ROW][C]38[/C][C]0.999997423417367[/C][C]5.15316526572385e-06[/C][C]2.57658263286193e-06[/C][/ROW]
[ROW][C]39[/C][C]0.999998033772168[/C][C]3.9324556649692e-06[/C][C]1.9662278324846e-06[/C][/ROW]
[ROW][C]40[/C][C]0.999995818966516[/C][C]8.36206696861876e-06[/C][C]4.18103348430938e-06[/C][/ROW]
[ROW][C]41[/C][C]0.99996060985067[/C][C]7.8780298658932e-05[/C][C]3.9390149329466e-05[/C][/ROW]
[ROW][C]42[/C][C]0.999632562318322[/C][C]0.000734875363356891[/C][C]0.000367437681678445[/C][/ROW]
[ROW][C]43[/C][C]0.996970103041325[/C][C]0.00605979391735009[/C][C]0.00302989695867504[/C][/ROW]
[/TABLE]
Source: https://freestatistics.org/blog/index.php?pk=25008&T=5

Globally Unique Identifier (entire table): ba.freestatistics.org/blog/index.php?pk=25008&T=5

As an alternative you can also use a QR Code:  

The GUIDs for individual cells are displayed in the table below:

Goldfeld-Quandt test for Heteroskedasticity
p-valuesAlternative Hypothesis
breakpoint indexgreater2-sidedless
170.004094172310481420.008188344620962840.995905827689519
180.001715942393331710.003431884786663420.998284057606668
190.006809566331336750.01361913266267350.993190433668663
200.2100321604110050.4200643208220090.789967839588996
210.8535193188956820.2929613622086350.146480681104318
220.9998944507176050.0002110985647896790.000105549282394839
230.9999982890185773.42196284584564e-061.71098142292282e-06
240.9999998531422622.93715476297507e-071.46857738148753e-07
250.9999998784323812.43135237625979e-071.21567618812989e-07
260.9999998752019262.49596148204764e-071.24798074102382e-07
270.9999998976912472.04617505917158e-071.02308752958579e-07
280.9999999664912076.70175854142186e-083.35087927071093e-08
290.9999999829369243.41261519689676e-081.70630759844838e-08
300.9999999858799482.82401049241727e-081.41200524620864e-08
310.9999999827267823.45464367075137e-081.72732183537569e-08
320.9999999607660787.84678441361228e-083.92339220680614e-08
330.9999998204997753.59000449869678e-071.79500224934839e-07
340.9999994558838161.08823236732711e-065.44116183663555e-07
350.9999981545762463.69084750893643e-061.84542375446822e-06
360.999993598685251.28026294987087e-056.40131474935434e-06
370.9999967052715126.58945697698832e-063.29472848849416e-06
380.9999974234173675.15316526572385e-062.57658263286193e-06
390.9999980337721683.9324556649692e-061.9662278324846e-06
400.9999958189665168.36206696861876e-064.18103348430938e-06
410.999960609850677.8780298658932e-053.9390149329466e-05
420.9996325623183220.0007348753633568910.000367437681678445
430.9969701030413250.006059793917350090.00302989695867504


Meta Analysis of Goldfeld-Quandt test for Heteroskedasticity
Description# significant tests% significant testsOK/NOK
1% type I error level240.888888888888889NOK
5% type I error level250.925925925925926NOK
10% type I error level250.925925925925926NOK

\begin{tabular}{lllllllll}
\hline
Meta Analysis of Goldfeld-Quandt test for Heteroskedasticity \tabularnewline
Description & # significant tests & % significant tests & OK/NOK \tabularnewline
1% type I error level & 24 & 0.888888888888889 & NOK \tabularnewline
5% type I error level & 25 & 0.925925925925926 & NOK \tabularnewline
10% type I error level & 25 & 0.925925925925926 & NOK \tabularnewline
\hline
\end{tabular}
%Source: https://freestatistics.org/blog/index.php?pk=25008&T=6

[TABLE]
[ROW][C]Meta Analysis of Goldfeld-Quandt test for Heteroskedasticity[/C][/ROW]
[ROW][C]Description[/C][C]# significant tests[/C][C]% significant tests[/C][C]OK/NOK[/C][/ROW]
[ROW][C]1% type I error level[/C][C]24[/C][C]0.888888888888889[/C][C]NOK[/C][/ROW]
[ROW][C]5% type I error level[/C][C]25[/C][C]0.925925925925926[/C][C]NOK[/C][/ROW]
[ROW][C]10% type I error level[/C][C]25[/C][C]0.925925925925926[/C][C]NOK[/C][/ROW]
[/TABLE]
Source: https://freestatistics.org/blog/index.php?pk=25008&T=6

Globally Unique Identifier (entire table): ba.freestatistics.org/blog/index.php?pk=25008&T=6

As an alternative you can also use a QR Code:  

The GUIDs for individual cells are displayed in the table below:

Meta Analysis of Goldfeld-Quandt test for Heteroskedasticity
Description# significant tests% significant testsOK/NOK
1% type I error level240.888888888888889NOK
5% type I error level250.925925925925926NOK
10% type I error level250.925925925925926NOK


Parameters (Session):
par1 = 1 ; par2 = Include Monthly Dummies ; par3 = Linear Trend ;
Parameters (R input):
par1 = 1 ; par2 = Include Monthly Dummies ; par3 = Linear Trend ;
R code (references can be found in the software module):
library(lattice)
library(lmtest)
n25 <- 25 #minimum number of obs. for Goldfeld-Quandt test
par1 <- as.numeric(par1)
x <- t(y)
k <- length(x[1,])
n <- length(x[,1])
x1 <- cbind(x[,par1], x[,1:k!=par1])
mycolnames <- c(colnames(x)[par1], colnames(x)[1:k!=par1])
colnames(x1) <- mycolnames #colnames(x)[par1]
x <- x1
if (par3 == 'First Differences'){
x2 <- array(0, dim=c(n-1,k), dimnames=list(1:(n-1), paste('(1-B)',colnames(x),sep='')))
for (i in 1:n-1) {
for (j in 1:k) {
x2[i,j] <- x[i+1,j] - x[i,j]
}
}
x <- x2
}
if (par2 == 'Include Monthly Dummies'){
x2 <- array(0, dim=c(n,11), dimnames=list(1:n, paste('M', seq(1:11), sep ='')))
for (i in 1:11){
x2[seq(i,n,12),i] <- 1
}
x <- cbind(x, x2)
}
if (par2 == 'Include Quarterly Dummies'){
x2 <- array(0, dim=c(n,3), dimnames=list(1:n, paste('Q', seq(1:3), sep ='')))
for (i in 1:3){
x2[seq(i,n,4),i] <- 1
}
x <- cbind(x, x2)
}
k <- length(x[1,])
if (par3 == 'Linear Trend'){
x <- cbind(x, c(1:n))
colnames(x)[k+1] <- 't'
}
x
k <- length(x[1,])
df <- as.data.frame(x)
(mylm <- lm(df))
(mysum <- summary(mylm))
if (n > n25) {
kp3 <- k + 3
nmkm3 <- n - k - 3
gqarr <- array(NA, dim=c(nmkm3-kp3+1,3))
numgqtests <- 0
numsignificant1 <- 0
numsignificant5 <- 0
numsignificant10 <- 0
for (mypoint in kp3:nmkm3) {
j <- 0
numgqtests <- numgqtests + 1
for (myalt in c('greater', 'two.sided', 'less')) {
j <- j + 1
gqarr[mypoint-kp3+1,j] <- gqtest(mylm, point=mypoint, alternative=myalt)$p.value
}
if (gqarr[mypoint-kp3+1,2] < 0.01) numsignificant1 <- numsignificant1 + 1
if (gqarr[mypoint-kp3+1,2] < 0.05) numsignificant5 <- numsignificant5 + 1
if (gqarr[mypoint-kp3+1,2] < 0.10) numsignificant10 <- numsignificant10 + 1
}
gqarr
}
bitmap(file='test0.png')
plot(x[,1], type='l', main='Actuals and Interpolation', ylab='value of Actuals and Interpolation (dots)', xlab='time or index')
points(x[,1]-mysum$resid)
grid()
dev.off()
bitmap(file='test1.png')
plot(mysum$resid, type='b', pch=19, main='Residuals', ylab='value of Residuals', xlab='time or index')
grid()
dev.off()
bitmap(file='test2.png')
hist(mysum$resid, main='Residual Histogram', xlab='values of Residuals')
grid()
dev.off()
bitmap(file='test3.png')
densityplot(~mysum$resid,col='black',main='Residual Density Plot', xlab='values of Residuals')
dev.off()
bitmap(file='test4.png')
qqnorm(mysum$resid, main='Residual Normal Q-Q Plot')
qqline(mysum$resid)
grid()
dev.off()
(myerror <- as.ts(mysum$resid))
bitmap(file='test5.png')
dum <- cbind(lag(myerror,k=1),myerror)
dum
dum1 <- dum[2:length(myerror),]
dum1
z <- as.data.frame(dum1)
z
plot(z,main=paste('Residual Lag plot, lowess, and regression line'), ylab='values of Residuals', xlab='lagged values of Residuals')
lines(lowess(z))
abline(lm(z))
grid()
dev.off()
bitmap(file='test6.png')
acf(mysum$resid, lag.max=length(mysum$resid)/2, main='Residual Autocorrelation Function')
grid()
dev.off()
bitmap(file='test7.png')
pacf(mysum$resid, lag.max=length(mysum$resid)/2, main='Residual Partial Autocorrelation Function')
grid()
dev.off()
bitmap(file='test8.png')
opar <- par(mfrow = c(2,2), oma = c(0, 0, 1.1, 0))
plot(mylm, las = 1, sub='Residual Diagnostics')
par(opar)
dev.off()
if (n > n25) {
bitmap(file='test9.png')
plot(kp3:nmkm3,gqarr[,2], main='Goldfeld-Quandt test',ylab='2-sided p-value',xlab='breakpoint')
grid()
dev.off()
}
load(file='createtable')
a<-table.start()
a<-table.row.start(a)
a<-table.element(a, 'Multiple Linear Regression - Estimated Regression Equation', 1, TRUE)
a<-table.row.end(a)
myeq <- colnames(x)[1]
myeq <- paste(myeq, '[t] = ', sep='')
for (i in 1:k){
if (mysum$coefficients[i,1] > 0) myeq <- paste(myeq, '+', '')
myeq <- paste(myeq, mysum$coefficients[i,1], sep=' ')
if (rownames(mysum$coefficients)[i] != '(Intercept)') {
myeq <- paste(myeq, rownames(mysum$coefficients)[i], sep='')
if (rownames(mysum$coefficients)[i] != 't') myeq <- paste(myeq, '[t]', sep='')
}
}
myeq <- paste(myeq, ' + e[t]')
a<-table.row.start(a)
a<-table.element(a, myeq)
a<-table.row.end(a)
a<-table.end(a)
table.save(a,file='mytable1.tab')
a<-table.start()
a<-table.row.start(a)
a<-table.element(a,hyperlink('ols1.htm','Multiple Linear Regression - Ordinary Least Squares',''), 6, TRUE)
a<-table.row.end(a)
a<-table.row.start(a)
a<-table.element(a,'Variable',header=TRUE)
a<-table.element(a,'Parameter',header=TRUE)
a<-table.element(a,'S.D.',header=TRUE)
a<-table.element(a,'T-STAT
H0: parameter = 0',header=TRUE)
a<-table.element(a,'2-tail p-value',header=TRUE)
a<-table.element(a,'1-tail p-value',header=TRUE)
a<-table.row.end(a)
for (i in 1:k){
a<-table.row.start(a)
a<-table.element(a,rownames(mysum$coefficients)[i],header=TRUE)
a<-table.element(a,mysum$coefficients[i,1])
a<-table.element(a, round(mysum$coefficients[i,2],6))
a<-table.element(a, round(mysum$coefficients[i,3],4))
a<-table.element(a, round(mysum$coefficients[i,4],6))
a<-table.element(a, round(mysum$coefficients[i,4]/2,6))
a<-table.row.end(a)
}
a<-table.end(a)
table.save(a,file='mytable2.tab')
a<-table.start()
a<-table.row.start(a)
a<-table.element(a, 'Multiple Linear Regression - Regression Statistics', 2, TRUE)
a<-table.row.end(a)
a<-table.row.start(a)
a<-table.element(a, 'Multiple R',1,TRUE)
a<-table.element(a, sqrt(mysum$r.squared))
a<-table.row.end(a)
a<-table.row.start(a)
a<-table.element(a, 'R-squared',1,TRUE)
a<-table.element(a, mysum$r.squared)
a<-table.row.end(a)
a<-table.row.start(a)
a<-table.element(a, 'Adjusted R-squared',1,TRUE)
a<-table.element(a, mysum$adj.r.squared)
a<-table.row.end(a)
a<-table.row.start(a)
a<-table.element(a, 'F-TEST (value)',1,TRUE)
a<-table.element(a, mysum$fstatistic[1])
a<-table.row.end(a)
a<-table.row.start(a)
a<-table.element(a, 'F-TEST (DF numerator)',1,TRUE)
a<-table.element(a, mysum$fstatistic[2])
a<-table.row.end(a)
a<-table.row.start(a)
a<-table.element(a, 'F-TEST (DF denominator)',1,TRUE)
a<-table.element(a, mysum$fstatistic[3])
a<-table.row.end(a)
a<-table.row.start(a)
a<-table.element(a, 'p-value',1,TRUE)
a<-table.element(a, 1-pf(mysum$fstatistic[1],mysum$fstatistic[2],mysum$fstatistic[3]))
a<-table.row.end(a)
a<-table.row.start(a)
a<-table.element(a, 'Multiple Linear Regression - Residual Statistics', 2, TRUE)
a<-table.row.end(a)
a<-table.row.start(a)
a<-table.element(a, 'Residual Standard Deviation',1,TRUE)
a<-table.element(a, mysum$sigma)
a<-table.row.end(a)
a<-table.row.start(a)
a<-table.element(a, 'Sum Squared Residuals',1,TRUE)
a<-table.element(a, sum(myerror*myerror))
a<-table.row.end(a)
a<-table.end(a)
table.save(a,file='mytable3.tab')
a<-table.start()
a<-table.row.start(a)
a<-table.element(a, 'Multiple Linear Regression - Actuals, Interpolation, and Residuals', 4, TRUE)
a<-table.row.end(a)
a<-table.row.start(a)
a<-table.element(a, 'Time or Index', 1, TRUE)
a<-table.element(a, 'Actuals', 1, TRUE)
a<-table.element(a, 'Interpolation
Forecast', 1, TRUE)
a<-table.element(a, 'Residuals
Prediction Error', 1, TRUE)
a<-table.row.end(a)
for (i in 1:n) {
a<-table.row.start(a)
a<-table.element(a,i, 1, TRUE)
a<-table.element(a,x[i])
a<-table.element(a,x[i]-mysum$resid[i])
a<-table.element(a,mysum$resid[i])
a<-table.row.end(a)
}
a<-table.end(a)
table.save(a,file='mytable4.tab')
if (n > n25) {
a<-table.start()
a<-table.row.start(a)
a<-table.element(a,'Goldfeld-Quandt test for Heteroskedasticity',4,TRUE)
a<-table.row.end(a)
a<-table.row.start(a)
a<-table.element(a,'p-values',header=TRUE)
a<-table.element(a,'Alternative Hypothesis',3,header=TRUE)
a<-table.row.end(a)
a<-table.row.start(a)
a<-table.element(a,'breakpoint index',header=TRUE)
a<-table.element(a,'greater',header=TRUE)
a<-table.element(a,'2-sided',header=TRUE)
a<-table.element(a,'less',header=TRUE)
a<-table.row.end(a)
for (mypoint in kp3:nmkm3) {
a<-table.row.start(a)
a<-table.element(a,mypoint,header=TRUE)
a<-table.element(a,gqarr[mypoint-kp3+1,1])
a<-table.element(a,gqarr[mypoint-kp3+1,2])
a<-table.element(a,gqarr[mypoint-kp3+1,3])
a<-table.row.end(a)
}
a<-table.end(a)
table.save(a,file='mytable5.tab')
a<-table.start()
a<-table.row.start(a)
a<-table.element(a,'Meta Analysis of Goldfeld-Quandt test for Heteroskedasticity',4,TRUE)
a<-table.row.end(a)
a<-table.row.start(a)
a<-table.element(a,'Description',header=TRUE)
a<-table.element(a,'# significant tests',header=TRUE)
a<-table.element(a,'% significant tests',header=TRUE)
a<-table.element(a,'OK/NOK',header=TRUE)
a<-table.row.end(a)
a<-table.row.start(a)
a<-table.element(a,'1% type I error level',header=TRUE)
a<-table.element(a,numsignificant1)
a<-table.element(a,numsignificant1/numgqtests)
if (numsignificant1/numgqtests < 0.01) dum <- 'OK' else dum <- 'NOK'
a<-table.element(a,dum)
a<-table.row.end(a)
a<-table.row.start(a)
a<-table.element(a,'5% type I error level',header=TRUE)
a<-table.element(a,numsignificant5)
a<-table.element(a,numsignificant5/numgqtests)
if (numsignificant5/numgqtests < 0.05) dum <- 'OK' else dum <- 'NOK'
a<-table.element(a,dum)
a<-table.row.end(a)
a<-table.row.start(a)
a<-table.element(a,'10% type I error level',header=TRUE)
a<-table.element(a,numsignificant10)
a<-table.element(a,numsignificant10/numgqtests)
if (numsignificant10/numgqtests < 0.1) dum <- 'OK' else dum <- 'NOK'
a<-table.element(a,dum)
a<-table.row.end(a)
a<-table.end(a)
table.save(a,file='mytable6.tab')
}