Free Statistics

of Irreproducible Research!

Author's title

Author*Unverified author*
R Software Modulerwasp_correlation.wasp
Title produced by softwarePearson Correlation
Date of computationTue, 18 Nov 2008 09:24:30 -0700
Cite this page as followsStatistical Computations at FreeStatistics.org, Office for Research Development and Education, URL https://freestatistics.org/blog/index.php?v=date/2008/Nov/18/t1227025587d7yp8otnotbtguh.htm/, Retrieved Sun, 19 May 2024 11:29:43 +0000
Statistical Computations at FreeStatistics.org, Office for Research Development and Education, URL https://freestatistics.org/blog/index.php?pk=25002, Retrieved Sun, 19 May 2024 11:29:43 +0000
QR Codes:

Original text written by user:
IsPrivate?No (this computation is public)
User-defined keywords
Estimated Impact260
Family? (F = Feedback message, R = changed R code, M = changed R Module, P = changed Parameters, D = changed Data)
-       [Pearson Correlation] [correlation reer ...] [2008-11-18 16:24:30] [d41d8cd98f00b204e9800998ecf8427e] [Current]
Feedback Forum

Post a new message
Dataseries X:
0,02382682
-0,007095218
0,019865657
0,018077354
-0,007157605
-0,010813808
0,052838122
0,041932907
0,001916443
-0,000255037
0,024362245
0,004856182
0,017967782
-0,037614121
-0,009992411
0,031812955
-0,022040614
-0,001139529
0,058309038
0,046233082
-0,010532341
-0,00613213
0,003026775
0,009052925
0,026455026
-0,005939041
0,020065382
0,010166869
-0,013674653
-0,009427684
0,020938305
0,031914894
-0,000425125
-0,01456672
0,009602935
0,00288554
0,045289855
-0,013864818
0,014576657
-0,00794783
-0,027629417
0,002323862
0,037727895
0,026200873
-0,005640772
0,004876592
0,041497474
0,014929631
0,000749555
-0,014418126
-0,000854944
0,002471953
-0,005311077
-0,012204424
0,032432432
0,001402393
-0,044160209
-0,017386208
-0,011829026
-0,017603863
0,037272169
0,000691017
-0,004143238
0,000198118
-0,020897296
-0,004147279
0,003859827
0,018314277
-0,012321145
-0,015191147
-0,00745735
-0,004837382
0,044161754
-0,028328051
-0,000713558
0,022034071
-0,033935523
0,001963013
0,027222108
0,031017868
0,008178366
-0,001448576
-0,004352031
-0,00922778
0,020490196
-0,000192141
0,015662535
-0,000283822
-0,012870256
0,003642987
-0,005253606
0,008450163
0,007903257
-0,004062352
0,006260672
-0,004996229
0,030885836
-0,032441871
-0,00712386
-0,014636946
-0,035339806
-0,022544283
0,025329489
0,019582245
0,006205063
-0,023492561
-0,004410585
-0,026983488
0,024213576
-0,020913316
0,000515943
-0,022174092
-0,022782407
0,004425256
0,02503761
0,003249817
-0,015673981
0,002547771
-0,01313003
-0,022532189
0,010976948
-0,00184582
0,009354944
0,019937493
-0,025359256
-0,003577624
0,025786095
0,011030972
Dataseries Y:
0,325840112
0,29586968
0,121024249
-0,053300865
0,027099578
0,020403428
0,269306646
-0,15842617
-0,062018537
0,036054676
0,500711847
0,029011979
-0,622913138
0,592451849
0,018024058
0,095618291
-0,038252166
0,184756317
-0,045462993
-0,026757644
0,007846402
-0,029217557
0,049882878
0,202561664
-0,011286773
0,034759944
0,106182329
0,126553375
0,143064766
-0,092362403
0,122431929
0,072550347
0,106567454
-0,274141685
0,03320131
-0,398753192
0,314859445
0,546688096
0,0460655
-0,20166972
-0,005637383
0,054842105
0,059142354
-0,043530206
-0,145563481
-0,152698423
0,170514356
-0,169831662
-0,020516053
0,332758001
0,169547382
-0,08287685
0,087148684
0,054088556
-0,014376675
0,136874574
0,020401008
-0,13953234
0,063971176
0,026880564
-0,185412277
0,41245847
0,249155842
-0,131254328
-0,012853995
0,10886906
-0,014108743
0,0428781
-0,02175728
0,005136565
0,363536838
-0,346079229
-0,147004606
0,512135486
0,17892429
-0,05719931
0,173443597
-0,022882819
0,010644374
-0,002576382
-0,094013953
0,263744682
0,062210196
-0,227049944
-0,107507276
0,363226262
0,161242888
-0,05869671
0,094678314
0,007794807
-0,087871957
0,031992678
-0,061883988
0,041349343
0,007885977
-0,092203686
-0,142371152
0,500799467
0,022181007
-0,045785219
0,127100845
-0,020807809
0,086341602
0,024550066
-0,051398378
-0,048295101
0,048708306
0,041384633
0,060931105
-0,11265315
0,304040003
-0,022165492
0,080680662
0,03795778
0,045739827
-0,026142522
-0,109899025
0,171900961
0,064470412
-0,062513401
-0,198032081
0,277406752
0,126926248
0,026235458
-0,024012536
0,125518172
-0,088492219
-0,093536239


Summary of computational transaction
Raw Inputview raw input (R code)
Raw Outputview raw output of R engine
Computing time1 seconds
R Server'George Udny Yule' @ 72.249.76.132

\begin{tabular}{lllllllll}
\hline
Summary of computational transaction \tabularnewline
Raw Input & view raw input (R code)  \tabularnewline
Raw Output & view raw output of R engine  \tabularnewline
Computing time & 1 seconds \tabularnewline
R Server & 'George Udny Yule' @ 72.249.76.132 \tabularnewline
\hline
\end{tabular}
%Source: https://freestatistics.org/blog/index.php?pk=25002&T=0

[TABLE]
[ROW][C]Summary of computational transaction[/C][/ROW]
[ROW][C]Raw Input[/C][C]view raw input (R code) [/C][/ROW]
[ROW][C]Raw Output[/C][C]view raw output of R engine [/C][/ROW]
[ROW][C]Computing time[/C][C]1 seconds[/C][/ROW]
[ROW][C]R Server[/C][C]'George Udny Yule' @ 72.249.76.132[/C][/ROW]
[/TABLE]
Source: https://freestatistics.org/blog/index.php?pk=25002&T=0

Globally Unique Identifier (entire table): ba.freestatistics.org/blog/index.php?pk=25002&T=0

As an alternative you can also use a QR Code:  

The GUIDs for individual cells are displayed in the table below:

Summary of computational transaction
Raw Inputview raw input (R code)
Raw Outputview raw output of R engine
Computing time1 seconds
R Server'George Udny Yule' @ 72.249.76.132


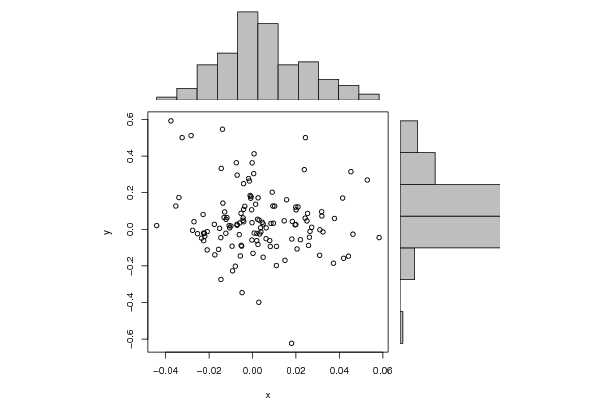
Pearson Product Moment Correlation - Ungrouped Data
StatisticVariable XVariable Y
Mean0.0027477362343750.0419074317265625
Biased Variance0.0004043446464418430.032281838895477
Biased Standard Deviation0.02010832281523850.179671474907613
Covariance-0.000447493462861388
Correlation-0.122892524314167
Determination0.0151025725323080
T-Test-1.39000139497365
p-value (2 sided)0.166979264484822
p-value (1 sided)0.0834896322424112
Degrees of Freedom126
Number of Observations128

\begin{tabular}{lllllllll}
\hline
Pearson Product Moment Correlation - Ungrouped Data \tabularnewline
Statistic & Variable X & Variable Y \tabularnewline
Mean & 0.002747736234375 & 0.0419074317265625 \tabularnewline
Biased Variance & 0.000404344646441843 & 0.032281838895477 \tabularnewline
Biased Standard Deviation & 0.0201083228152385 & 0.179671474907613 \tabularnewline
Covariance & -0.000447493462861388 \tabularnewline
Correlation & -0.122892524314167 \tabularnewline
Determination & 0.0151025725323080 \tabularnewline
T-Test & -1.39000139497365 \tabularnewline
p-value (2 sided) & 0.166979264484822 \tabularnewline
p-value (1 sided) & 0.0834896322424112 \tabularnewline
Degrees of Freedom & 126 \tabularnewline
Number of Observations & 128 \tabularnewline
\hline
\end{tabular}
%Source: https://freestatistics.org/blog/index.php?pk=25002&T=1

[TABLE]
[ROW][C]Pearson Product Moment Correlation - Ungrouped Data[/C][/ROW]
[ROW][C]Statistic[/C][C]Variable X[/C][C]Variable Y[/C][/ROW]
[ROW][C]Mean[/C][C]0.002747736234375[/C][C]0.0419074317265625[/C][/ROW]
[ROW][C]Biased Variance[/C][C]0.000404344646441843[/C][C]0.032281838895477[/C][/ROW]
[ROW][C]Biased Standard Deviation[/C][C]0.0201083228152385[/C][C]0.179671474907613[/C][/ROW]
[ROW][C]Covariance[/C][C]-0.000447493462861388[/C][/ROW]
[ROW][C]Correlation[/C][C]-0.122892524314167[/C][/ROW]
[ROW][C]Determination[/C][C]0.0151025725323080[/C][/ROW]
[ROW][C]T-Test[/C][C]-1.39000139497365[/C][/ROW]
[ROW][C]p-value (2 sided)[/C][C]0.166979264484822[/C][/ROW]
[ROW][C]p-value (1 sided)[/C][C]0.0834896322424112[/C][/ROW]
[ROW][C]Degrees of Freedom[/C][C]126[/C][/ROW]
[ROW][C]Number of Observations[/C][C]128[/C][/ROW]
[/TABLE]
Source: https://freestatistics.org/blog/index.php?pk=25002&T=1

Globally Unique Identifier (entire table): ba.freestatistics.org/blog/index.php?pk=25002&T=1

As an alternative you can also use a QR Code:  

The GUIDs for individual cells are displayed in the table below:

Pearson Product Moment Correlation - Ungrouped Data
StatisticVariable XVariable Y
Mean0.0027477362343750.0419074317265625
Biased Variance0.0004043446464418430.032281838895477
Biased Standard Deviation0.02010832281523850.179671474907613
Covariance-0.000447493462861388
Correlation-0.122892524314167
Determination0.0151025725323080
T-Test-1.39000139497365
p-value (2 sided)0.166979264484822
p-value (1 sided)0.0834896322424112
Degrees of Freedom126
Number of Observations128


Parameters (Session):
Parameters (R input):
R code (references can be found in the software module):
bitmap(file='test1.png')
histx <- hist(x, plot=FALSE)
histy <- hist(y, plot=FALSE)
maxcounts <- max(c(histx$counts, histx$counts))
xrange <- c(min(x),max(x))
yrange <- c(min(y),max(y))
nf <- layout(matrix(c(2,0,1,3),2,2,byrow=TRUE), c(3,1), c(1,3), TRUE)
par(mar=c(4,4,1,1))
plot(x, y, xlim=xrange, ylim=yrange, xlab=xlab, ylab=ylab)
par(mar=c(0,4,1,1))
barplot(histx$counts, axes=FALSE, ylim=c(0, maxcounts), space=0)
par(mar=c(4,0,1,1))
barplot(histy$counts, axes=FALSE, xlim=c(0, maxcounts), space=0, horiz=TRUE)
dev.off()
lx = length(x)
makebiased = (lx-1)/lx
varx = var(x)*makebiased
vary = var(y)*makebiased
corxy <- cor.test(x,y,method='pearson')
cxy <- as.matrix(corxy$estimate)[1,1]
load(file='createtable')
a<-table.start()
a<-table.row.start(a)
a<-table.element(a,'Pearson Product Moment Correlation - Ungrouped Data',3,TRUE)
a<-table.row.end(a)
a<-table.row.start(a)
a<-table.element(a,'Statistic',1,TRUE)
a<-table.element(a,'Variable X',1,TRUE)
a<-table.element(a,'Variable Y',1,TRUE)
a<-table.row.end(a)
a<-table.row.start(a)
a<-table.element(a,hyperlink('arithmetic_mean.htm','Mean',''),header=TRUE)
a<-table.element(a,mean(x))
a<-table.element(a,mean(y))
a<-table.row.end(a)
a<-table.row.start(a)
a<-table.element(a,hyperlink('biased.htm','Biased Variance',''),header=TRUE)
a<-table.element(a,varx)
a<-table.element(a,vary)
a<-table.row.end(a)
a<-table.row.start(a)
a<-table.element(a,hyperlink('biased1.htm','Biased Standard Deviation',''),header=TRUE)
a<-table.element(a,sqrt(varx))
a<-table.element(a,sqrt(vary))
a<-table.row.end(a)
a<-table.row.start(a)
a<-table.element(a,hyperlink('covariance.htm','Covariance',''),header=TRUE)
a<-table.element(a,cov(x,y),2)
a<-table.row.end(a)
a<-table.row.start(a)
a<-table.element(a,hyperlink('pearson_correlation.htm','Correlation',''),header=TRUE)
a<-table.element(a,cxy,2)
a<-table.row.end(a)
a<-table.row.start(a)
a<-table.element(a,hyperlink('coeff_of_determination.htm','Determination',''),header=TRUE)
a<-table.element(a,cxy*cxy,2)
a<-table.row.end(a)
a<-table.row.start(a)
a<-table.element(a,hyperlink('ttest_statistic.htm','T-Test',''),header=TRUE)
a<-table.element(a,as.matrix(corxy$statistic)[1,1],2)
a<-table.row.end(a)
a<-table.row.start(a)
a<-table.element(a,'p-value (2 sided)',header=TRUE)
a<-table.element(a,(p2 <- as.matrix(corxy$p.value)[1,1]),2)
a<-table.row.end(a)
a<-table.row.start(a)
a<-table.element(a,'p-value (1 sided)',header=TRUE)
a<-table.element(a,p2/2,2)
a<-table.row.end(a)
a<-table.row.start(a)
a<-table.element(a,'Degrees of Freedom',header=TRUE)
a<-table.element(a,lx-2,2)
a<-table.row.end(a)
a<-table.row.start(a)
a<-table.element(a,'Number of Observations',header=TRUE)
a<-table.element(a,lx,2)
a<-table.row.end(a)
a<-table.end(a)
table.save(a,file='mytable.tab')