Free Statistics

of Irreproducible Research!

Author's title

Author*The author of this computation has been verified*
R Software Modulerwasp_multipleregression.wasp
Title produced by softwareMultiple Regression
Date of computationSun, 16 Nov 2008 05:01:18 -0700
Cite this page as followsStatistical Computations at FreeStatistics.org, Office for Research Development and Education, URL https://freestatistics.org/blog/index.php?v=date/2008/Nov/16/t1226837097x2svnjr9oxjlxv1.htm/, Retrieved Sun, 19 May 2024 12:34:29 +0000
Statistical Computations at FreeStatistics.org, Office for Research Development and Education, URL https://freestatistics.org/blog/index.php?pk=24951, Retrieved Sun, 19 May 2024 12:34:29 +0000
QR Codes:

Original text written by user:
IsPrivate?No (this computation is public)
User-defined keywords
Estimated Impact307
Family? (F = Feedback message, R = changed R code, M = changed R Module, P = changed Parameters, D = changed Data)
F       [Multiple Regression] [Taak 6 - Q3 (2)] [2008-11-16 12:01:18] [b23db733701c4d62df5e228d507c1c6a] [Current]
F    D    [Multiple Regression] [taak 6 Q 3, 2] [2008-11-19 14:20:40] [e1a46c1dcfccb0cb690f79a1a409b517]
-   P     [Multiple Regression] [Taak 6 - Q3 (2) v...] [2008-11-28 07:48:47] [46c5a5fbda57fdfa1d4ef48658f82a0c]
Feedback Forum
2008-11-28 07:57:20 [Ken Van den Heuvel] [reply
Als ik een lineaire trend had ingevoegd dan had ik het volgende bekomen:

http://www.freestatistics.org/blog/index.php?v=date/2008/Nov/28/t1227858626lnwnkt9y2sffnze.htm

Ik benadruk echter dat het invoeren van de dummy-variabele effectief 74775 minder werklozen teweegbrengt. De beleidswijzigingen hebben dus sowieso een positief effect op de werkloosheid, zelfs als zorgt mogelijke seizoenaliteit ervoor dat in bepaalde maanden dit getal afgezwakt.

Tevens had ik moeten nagaan of de mean van de residu's significant afwijkt van 0. Als ik deze echter wil kopiëren uit de tabel krijg ik deze om 1 of andere reden niet geplakt in excel of een calculator. Bijgevolg verwijs ik naar mijn verbetering van vraag 2 (T-test en testing mean with unknown variance) om de correcte methoden hiertoe aan te duiden.

Post a new message
Dataseries X:
565464	0
547344	0
554788	0
562325	0
560854	0
555332	0
543599	0
536662	0
542722	0
593530	0
610763	0
612613	0
611324	0
594167	0
595454	0
590865	0
589379	0
584428	0
573100	0
567456	0
569028	0
620735	0
628884	0
628232	0
612117	0
595404	0
597141	0
593408	0
590072	0
579799	0
574205	0
572775	0
572942	0
619567	0
625809	0
619916	0
587625	0
565742	0
557274	0
560576	1
548854	1
531673	1
525919	1
511038	1
498662	1
555362	1
564591	1
541657	1
527070	1
509846	1
514258	1
516922	1
507561	1
492622	1
490243	1
469357	1
477580	1
528379	1
533590	1
517945	1


Summary of computational transaction
Raw Inputview raw input (R code)
Raw Outputview raw output of R engine
Computing time5 seconds
R Server'Gwilym Jenkins' @ 72.249.127.135

\begin{tabular}{lllllllll}
\hline
Summary of computational transaction \tabularnewline
Raw Input & view raw input (R code)  \tabularnewline
Raw Output & view raw output of R engine  \tabularnewline
Computing time & 5 seconds \tabularnewline
R Server & 'Gwilym Jenkins' @ 72.249.127.135 \tabularnewline
\hline
\end{tabular}
%Source: https://freestatistics.org/blog/index.php?pk=24951&T=0

[TABLE]
[ROW][C]Summary of computational transaction[/C][/ROW]
[ROW][C]Raw Input[/C][C]view raw input (R code) [/C][/ROW]
[ROW][C]Raw Output[/C][C]view raw output of R engine [/C][/ROW]
[ROW][C]Computing time[/C][C]5 seconds[/C][/ROW]
[ROW][C]R Server[/C][C]'Gwilym Jenkins' @ 72.249.127.135[/C][/ROW]
[/TABLE]
Source: https://freestatistics.org/blog/index.php?pk=24951&T=0

Globally Unique Identifier (entire table): ba.freestatistics.org/blog/index.php?pk=24951&T=0

As an alternative you can also use a QR Code:  

The GUIDs for individual cells are displayed in the table below:

Summary of computational transaction
Raw Inputview raw input (R code)
Raw Outputview raw output of R engine
Computing time5 seconds
R Server'Gwilym Jenkins' @ 72.249.127.135


Multiple Linear Regression - Estimated Regression Equation
werkloosheid[t] = + 610130.509090909 -65144.7727272727dummy_factor[t] -16381.5545454547M1[t] -34600.9545454545M2[t] -33318.5545454545M3[t] -19253.4000000001M4[t] -24728.6000000001M5[t] -35301.8M6[t] -42659.4M7[t] -52615.0000000001M8[t] -51885.8M9[t] -558.000000000017M10[t] + 8654.79999999998M11[t] + e[t]

\begin{tabular}{lllllllll}
\hline
Multiple Linear Regression - Estimated Regression Equation \tabularnewline
werkloosheid[t] =  +  610130.509090909 -65144.7727272727dummy_factor[t] -16381.5545454547M1[t] -34600.9545454545M2[t] -33318.5545454545M3[t] -19253.4000000001M4[t] -24728.6000000001M5[t] -35301.8M6[t] -42659.4M7[t] -52615.0000000001M8[t] -51885.8M9[t] -558.000000000017M10[t] +  8654.79999999998M11[t]  + e[t] \tabularnewline
\hline
\end{tabular}
%Source: https://freestatistics.org/blog/index.php?pk=24951&T=1

[TABLE]
[ROW][C]Multiple Linear Regression - Estimated Regression Equation[/C][/ROW]
[ROW][C]werkloosheid[t] =  +  610130.509090909 -65144.7727272727dummy_factor[t] -16381.5545454547M1[t] -34600.9545454545M2[t] -33318.5545454545M3[t] -19253.4000000001M4[t] -24728.6000000001M5[t] -35301.8M6[t] -42659.4M7[t] -52615.0000000001M8[t] -51885.8M9[t] -558.000000000017M10[t] +  8654.79999999998M11[t]  + e[t][/C][/ROW]
[/TABLE]
Source: https://freestatistics.org/blog/index.php?pk=24951&T=1

Globally Unique Identifier (entire table): ba.freestatistics.org/blog/index.php?pk=24951&T=1

As an alternative you can also use a QR Code:  

The GUIDs for individual cells are displayed in the table below:

Multiple Linear Regression - Estimated Regression Equation
werkloosheid[t] = + 610130.509090909 -65144.7727272727dummy_factor[t] -16381.5545454547M1[t] -34600.9545454545M2[t] -33318.5545454545M3[t] -19253.4000000001M4[t] -24728.6000000001M5[t] -35301.8M6[t] -42659.4M7[t] -52615.0000000001M8[t] -51885.8M9[t] -558.000000000017M10[t] + 8654.79999999998M11[t] + e[t]


Multiple Linear Regression - Ordinary Least Squares
VariableParameterS.D.T-STATH0: parameter = 02-tail p-value1-tail p-value
(Intercept)610130.5090909098594.14216570.993800
dummy_factor-65144.77272727275135.982294-12.68400
M1-16381.554545454711846.207458-1.38290.1732450.086623
M2-34600.954545454511846.207458-2.92080.0053480.002674
M3-33318.554545454511846.207458-2.81260.007150.003575
M4-19253.400000000111801.588816-1.63140.1094840.054742
M5-24728.600000000111801.588816-2.09540.0415530.020776
M6-35301.811801.588816-2.99130.0044140.002207
M7-42659.411801.588816-3.61470.0007310.000365
M8-52615.000000000111801.588816-4.45835.1e-052.6e-05
M9-51885.811801.588816-4.39656.3e-053.1e-05
M10-558.00000000001711801.588816-0.04730.9624890.481244
M118654.7999999999811801.5888160.73340.4669820.233491

\begin{tabular}{lllllllll}
\hline
Multiple Linear Regression - Ordinary Least Squares \tabularnewline
Variable & Parameter & S.D. & T-STATH0: parameter = 0 & 2-tail p-value & 1-tail p-value \tabularnewline
(Intercept) & 610130.509090909 & 8594.142165 & 70.9938 & 0 & 0 \tabularnewline
dummy_factor & -65144.7727272727 & 5135.982294 & -12.684 & 0 & 0 \tabularnewline
M1 & -16381.5545454547 & 11846.207458 & -1.3829 & 0.173245 & 0.086623 \tabularnewline
M2 & -34600.9545454545 & 11846.207458 & -2.9208 & 0.005348 & 0.002674 \tabularnewline
M3 & -33318.5545454545 & 11846.207458 & -2.8126 & 0.00715 & 0.003575 \tabularnewline
M4 & -19253.4000000001 & 11801.588816 & -1.6314 & 0.109484 & 0.054742 \tabularnewline
M5 & -24728.6000000001 & 11801.588816 & -2.0954 & 0.041553 & 0.020776 \tabularnewline
M6 & -35301.8 & 11801.588816 & -2.9913 & 0.004414 & 0.002207 \tabularnewline
M7 & -42659.4 & 11801.588816 & -3.6147 & 0.000731 & 0.000365 \tabularnewline
M8 & -52615.0000000001 & 11801.588816 & -4.4583 & 5.1e-05 & 2.6e-05 \tabularnewline
M9 & -51885.8 & 11801.588816 & -4.3965 & 6.3e-05 & 3.1e-05 \tabularnewline
M10 & -558.000000000017 & 11801.588816 & -0.0473 & 0.962489 & 0.481244 \tabularnewline
M11 & 8654.79999999998 & 11801.588816 & 0.7334 & 0.466982 & 0.233491 \tabularnewline
\hline
\end{tabular}
%Source: https://freestatistics.org/blog/index.php?pk=24951&T=2

[TABLE]
[ROW][C]Multiple Linear Regression - Ordinary Least Squares[/C][/ROW]
[ROW][C]Variable[/C][C]Parameter[/C][C]S.D.[/C][C]T-STATH0: parameter = 0[/C][C]2-tail p-value[/C][C]1-tail p-value[/C][/ROW]
[ROW][C](Intercept)[/C][C]610130.509090909[/C][C]8594.142165[/C][C]70.9938[/C][C]0[/C][C]0[/C][/ROW]
[ROW][C]dummy_factor[/C][C]-65144.7727272727[/C][C]5135.982294[/C][C]-12.684[/C][C]0[/C][C]0[/C][/ROW]
[ROW][C]M1[/C][C]-16381.5545454547[/C][C]11846.207458[/C][C]-1.3829[/C][C]0.173245[/C][C]0.086623[/C][/ROW]
[ROW][C]M2[/C][C]-34600.9545454545[/C][C]11846.207458[/C][C]-2.9208[/C][C]0.005348[/C][C]0.002674[/C][/ROW]
[ROW][C]M3[/C][C]-33318.5545454545[/C][C]11846.207458[/C][C]-2.8126[/C][C]0.00715[/C][C]0.003575[/C][/ROW]
[ROW][C]M4[/C][C]-19253.4000000001[/C][C]11801.588816[/C][C]-1.6314[/C][C]0.109484[/C][C]0.054742[/C][/ROW]
[ROW][C]M5[/C][C]-24728.6000000001[/C][C]11801.588816[/C][C]-2.0954[/C][C]0.041553[/C][C]0.020776[/C][/ROW]
[ROW][C]M6[/C][C]-35301.8[/C][C]11801.588816[/C][C]-2.9913[/C][C]0.004414[/C][C]0.002207[/C][/ROW]
[ROW][C]M7[/C][C]-42659.4[/C][C]11801.588816[/C][C]-3.6147[/C][C]0.000731[/C][C]0.000365[/C][/ROW]
[ROW][C]M8[/C][C]-52615.0000000001[/C][C]11801.588816[/C][C]-4.4583[/C][C]5.1e-05[/C][C]2.6e-05[/C][/ROW]
[ROW][C]M9[/C][C]-51885.8[/C][C]11801.588816[/C][C]-4.3965[/C][C]6.3e-05[/C][C]3.1e-05[/C][/ROW]
[ROW][C]M10[/C][C]-558.000000000017[/C][C]11801.588816[/C][C]-0.0473[/C][C]0.962489[/C][C]0.481244[/C][/ROW]
[ROW][C]M11[/C][C]8654.79999999998[/C][C]11801.588816[/C][C]0.7334[/C][C]0.466982[/C][C]0.233491[/C][/ROW]
[/TABLE]
Source: https://freestatistics.org/blog/index.php?pk=24951&T=2

Globally Unique Identifier (entire table): ba.freestatistics.org/blog/index.php?pk=24951&T=2

As an alternative you can also use a QR Code:  

The GUIDs for individual cells are displayed in the table below:

Multiple Linear Regression - Ordinary Least Squares
VariableParameterS.D.T-STATH0: parameter = 02-tail p-value1-tail p-value
(Intercept)610130.5090909098594.14216570.993800
dummy_factor-65144.77272727275135.982294-12.68400
M1-16381.554545454711846.207458-1.38290.1732450.086623
M2-34600.954545454511846.207458-2.92080.0053480.002674
M3-33318.554545454511846.207458-2.81260.007150.003575
M4-19253.400000000111801.588816-1.63140.1094840.054742
M5-24728.600000000111801.588816-2.09540.0415530.020776
M6-35301.811801.588816-2.99130.0044140.002207
M7-42659.411801.588816-3.61470.0007310.000365
M8-52615.000000000111801.588816-4.45835.1e-052.6e-05
M9-51885.811801.588816-4.39656.3e-053.1e-05
M10-558.00000000001711801.588816-0.04730.9624890.481244
M118654.7999999999811801.5888160.73340.4669820.233491


Multiple Linear Regression - Regression Statistics
Multiple R0.910591205177868
R-squared0.829176342947282
Adjusted R-squared0.785561792210418
F-TEST (value)19.0114612884557
F-TEST (DF numerator)12
F-TEST (DF denominator)47
p-value4.08562073062058e-14
Multiple Linear Regression - Residual Statistics
Residual Standard Deviation18659.950333175
Sum Squared Residuals16365106082.5182

\begin{tabular}{lllllllll}
\hline
Multiple Linear Regression - Regression Statistics \tabularnewline
Multiple R & 0.910591205177868 \tabularnewline
R-squared & 0.829176342947282 \tabularnewline
Adjusted R-squared & 0.785561792210418 \tabularnewline
F-TEST (value) & 19.0114612884557 \tabularnewline
F-TEST (DF numerator) & 12 \tabularnewline
F-TEST (DF denominator) & 47 \tabularnewline
p-value & 4.08562073062058e-14 \tabularnewline
Multiple Linear Regression - Residual Statistics \tabularnewline
Residual Standard Deviation & 18659.950333175 \tabularnewline
Sum Squared Residuals & 16365106082.5182 \tabularnewline
\hline
\end{tabular}
%Source: https://freestatistics.org/blog/index.php?pk=24951&T=3

[TABLE]
[ROW][C]Multiple Linear Regression - Regression Statistics[/C][/ROW]
[ROW][C]Multiple R[/C][C]0.910591205177868[/C][/ROW]
[ROW][C]R-squared[/C][C]0.829176342947282[/C][/ROW]
[ROW][C]Adjusted R-squared[/C][C]0.785561792210418[/C][/ROW]
[ROW][C]F-TEST (value)[/C][C]19.0114612884557[/C][/ROW]
[ROW][C]F-TEST (DF numerator)[/C][C]12[/C][/ROW]
[ROW][C]F-TEST (DF denominator)[/C][C]47[/C][/ROW]
[ROW][C]p-value[/C][C]4.08562073062058e-14[/C][/ROW]
[ROW][C]Multiple Linear Regression - Residual Statistics[/C][/ROW]
[ROW][C]Residual Standard Deviation[/C][C]18659.950333175[/C][/ROW]
[ROW][C]Sum Squared Residuals[/C][C]16365106082.5182[/C][/ROW]
[/TABLE]
Source: https://freestatistics.org/blog/index.php?pk=24951&T=3

Globally Unique Identifier (entire table): ba.freestatistics.org/blog/index.php?pk=24951&T=3

As an alternative you can also use a QR Code:  

The GUIDs for individual cells are displayed in the table below:

Multiple Linear Regression - Regression Statistics
Multiple R0.910591205177868
R-squared0.829176342947282
Adjusted R-squared0.785561792210418
F-TEST (value)19.0114612884557
F-TEST (DF numerator)12
F-TEST (DF denominator)47
p-value4.08562073062058e-14
Multiple Linear Regression - Residual Statistics
Residual Standard Deviation18659.950333175
Sum Squared Residuals16365106082.5182


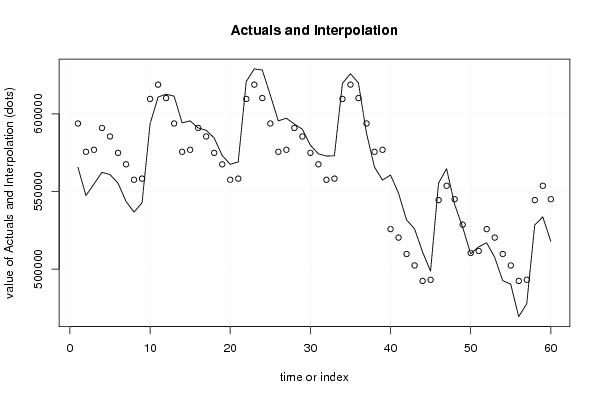
Multiple Linear Regression - Actuals, Interpolation, and Residuals
Time or IndexActualsInterpolationForecastResidualsPrediction Error
1565464593748.954545455-28284.9545454549
2547344575529.554545454-28185.5545454545
3554788576811.954545454-22023.9545454545
4562325590877.109090909-28552.1090909091
5560854585401.909090909-24547.9090909092
6555332574828.709090909-19496.7090909091
7543599567471.109090909-23872.1090909090
8536662557515.509090909-20853.5090909091
9542722558244.709090909-15522.7090909091
10593530609572.509090909-16042.5090909091
11610763618785.309090909-8022.3090909091
12612613610130.5090909092482.49090909090
13611324593748.95454545417575.0454545455
14594167575529.55454545518637.4454545455
15595454576811.95454545518642.0454545454
16590865590877.109090909-12.1090909090858
17589379585401.9090909093977.09090909092
18584428574828.7090909099599.2909090909
19573100567471.1090909095628.89090909091
20567456557515.5090909099940.4909090909
21569028558244.70909090910783.2909090909
22620735609572.50909090911162.4909090909
23628884618785.30909090910098.6909090909
24628232610130.50909090918101.4909090909
25612117593748.95454545418368.0454545456
26595404575529.55454545519874.4454545455
27597141576811.95454545520329.0454545454
28593408590877.1090909092530.89090909092
29590072585401.9090909094670.09090909092
30579799574828.7090909094970.29090909091
31574205567471.1090909096733.89090909091
32572775557515.50909090915259.4909090909
33572942558244.70909090914697.2909090909
34619567609572.5090909099994.49090909092
35625809618785.3090909097023.69090909091
36619916610130.5090909099785.4909090909
37587625593748.954545454-6123.95454545446
38565742575529.554545455-9787.55454545456
39557274576811.954545455-19537.9545454546
40560576525732.33636363634843.6636363636
41548854520257.13636363628596.8636363636
42531673509683.93636363621989.0636363636
43525919502326.33636363623592.6636363636
44511038492370.73636363618667.2636363636
45498662493099.9363636365562.06363636363
46555362544427.73636363610934.2636363636
47564591553640.53636363610950.4636363636
48541657544985.736363636-3328.73636363639
49527070528604.181818182-1534.18181818173
50509846510384.781818182-538.781818181832
51514258511667.1818181822590.81818181817
52516922525732.336363636-8810.33636363637
53507561520257.136363636-12696.1363636364
54492622509683.936363636-17061.9363636364
55490243502326.336363636-12083.3363636364
56469357492370.736363636-23013.7363636364
57477580493099.936363636-15519.9363636364
58528379544427.736363636-16048.7363636364
59533590553640.536363636-20050.5363636364
60517945544985.736363636-27040.7363636364

\begin{tabular}{lllllllll}
\hline
Multiple Linear Regression - Actuals, Interpolation, and Residuals \tabularnewline
Time or Index & Actuals & InterpolationForecast & ResidualsPrediction Error \tabularnewline
1 & 565464 & 593748.954545455 & -28284.9545454549 \tabularnewline
2 & 547344 & 575529.554545454 & -28185.5545454545 \tabularnewline
3 & 554788 & 576811.954545454 & -22023.9545454545 \tabularnewline
4 & 562325 & 590877.109090909 & -28552.1090909091 \tabularnewline
5 & 560854 & 585401.909090909 & -24547.9090909092 \tabularnewline
6 & 555332 & 574828.709090909 & -19496.7090909091 \tabularnewline
7 & 543599 & 567471.109090909 & -23872.1090909090 \tabularnewline
8 & 536662 & 557515.509090909 & -20853.5090909091 \tabularnewline
9 & 542722 & 558244.709090909 & -15522.7090909091 \tabularnewline
10 & 593530 & 609572.509090909 & -16042.5090909091 \tabularnewline
11 & 610763 & 618785.309090909 & -8022.3090909091 \tabularnewline
12 & 612613 & 610130.509090909 & 2482.49090909090 \tabularnewline
13 & 611324 & 593748.954545454 & 17575.0454545455 \tabularnewline
14 & 594167 & 575529.554545455 & 18637.4454545455 \tabularnewline
15 & 595454 & 576811.954545455 & 18642.0454545454 \tabularnewline
16 & 590865 & 590877.109090909 & -12.1090909090858 \tabularnewline
17 & 589379 & 585401.909090909 & 3977.09090909092 \tabularnewline
18 & 584428 & 574828.709090909 & 9599.2909090909 \tabularnewline
19 & 573100 & 567471.109090909 & 5628.89090909091 \tabularnewline
20 & 567456 & 557515.509090909 & 9940.4909090909 \tabularnewline
21 & 569028 & 558244.709090909 & 10783.2909090909 \tabularnewline
22 & 620735 & 609572.509090909 & 11162.4909090909 \tabularnewline
23 & 628884 & 618785.309090909 & 10098.6909090909 \tabularnewline
24 & 628232 & 610130.509090909 & 18101.4909090909 \tabularnewline
25 & 612117 & 593748.954545454 & 18368.0454545456 \tabularnewline
26 & 595404 & 575529.554545455 & 19874.4454545455 \tabularnewline
27 & 597141 & 576811.954545455 & 20329.0454545454 \tabularnewline
28 & 593408 & 590877.109090909 & 2530.89090909092 \tabularnewline
29 & 590072 & 585401.909090909 & 4670.09090909092 \tabularnewline
30 & 579799 & 574828.709090909 & 4970.29090909091 \tabularnewline
31 & 574205 & 567471.109090909 & 6733.89090909091 \tabularnewline
32 & 572775 & 557515.509090909 & 15259.4909090909 \tabularnewline
33 & 572942 & 558244.709090909 & 14697.2909090909 \tabularnewline
34 & 619567 & 609572.509090909 & 9994.49090909092 \tabularnewline
35 & 625809 & 618785.309090909 & 7023.69090909091 \tabularnewline
36 & 619916 & 610130.509090909 & 9785.4909090909 \tabularnewline
37 & 587625 & 593748.954545454 & -6123.95454545446 \tabularnewline
38 & 565742 & 575529.554545455 & -9787.55454545456 \tabularnewline
39 & 557274 & 576811.954545455 & -19537.9545454546 \tabularnewline
40 & 560576 & 525732.336363636 & 34843.6636363636 \tabularnewline
41 & 548854 & 520257.136363636 & 28596.8636363636 \tabularnewline
42 & 531673 & 509683.936363636 & 21989.0636363636 \tabularnewline
43 & 525919 & 502326.336363636 & 23592.6636363636 \tabularnewline
44 & 511038 & 492370.736363636 & 18667.2636363636 \tabularnewline
45 & 498662 & 493099.936363636 & 5562.06363636363 \tabularnewline
46 & 555362 & 544427.736363636 & 10934.2636363636 \tabularnewline
47 & 564591 & 553640.536363636 & 10950.4636363636 \tabularnewline
48 & 541657 & 544985.736363636 & -3328.73636363639 \tabularnewline
49 & 527070 & 528604.181818182 & -1534.18181818173 \tabularnewline
50 & 509846 & 510384.781818182 & -538.781818181832 \tabularnewline
51 & 514258 & 511667.181818182 & 2590.81818181817 \tabularnewline
52 & 516922 & 525732.336363636 & -8810.33636363637 \tabularnewline
53 & 507561 & 520257.136363636 & -12696.1363636364 \tabularnewline
54 & 492622 & 509683.936363636 & -17061.9363636364 \tabularnewline
55 & 490243 & 502326.336363636 & -12083.3363636364 \tabularnewline
56 & 469357 & 492370.736363636 & -23013.7363636364 \tabularnewline
57 & 477580 & 493099.936363636 & -15519.9363636364 \tabularnewline
58 & 528379 & 544427.736363636 & -16048.7363636364 \tabularnewline
59 & 533590 & 553640.536363636 & -20050.5363636364 \tabularnewline
60 & 517945 & 544985.736363636 & -27040.7363636364 \tabularnewline
\hline
\end{tabular}
%Source: https://freestatistics.org/blog/index.php?pk=24951&T=4

[TABLE]
[ROW][C]Multiple Linear Regression - Actuals, Interpolation, and Residuals[/C][/ROW]
[ROW][C]Time or Index[/C][C]Actuals[/C][C]InterpolationForecast[/C][C]ResidualsPrediction Error[/C][/ROW]
[ROW][C]1[/C][C]565464[/C][C]593748.954545455[/C][C]-28284.9545454549[/C][/ROW]
[ROW][C]2[/C][C]547344[/C][C]575529.554545454[/C][C]-28185.5545454545[/C][/ROW]
[ROW][C]3[/C][C]554788[/C][C]576811.954545454[/C][C]-22023.9545454545[/C][/ROW]
[ROW][C]4[/C][C]562325[/C][C]590877.109090909[/C][C]-28552.1090909091[/C][/ROW]
[ROW][C]5[/C][C]560854[/C][C]585401.909090909[/C][C]-24547.9090909092[/C][/ROW]
[ROW][C]6[/C][C]555332[/C][C]574828.709090909[/C][C]-19496.7090909091[/C][/ROW]
[ROW][C]7[/C][C]543599[/C][C]567471.109090909[/C][C]-23872.1090909090[/C][/ROW]
[ROW][C]8[/C][C]536662[/C][C]557515.509090909[/C][C]-20853.5090909091[/C][/ROW]
[ROW][C]9[/C][C]542722[/C][C]558244.709090909[/C][C]-15522.7090909091[/C][/ROW]
[ROW][C]10[/C][C]593530[/C][C]609572.509090909[/C][C]-16042.5090909091[/C][/ROW]
[ROW][C]11[/C][C]610763[/C][C]618785.309090909[/C][C]-8022.3090909091[/C][/ROW]
[ROW][C]12[/C][C]612613[/C][C]610130.509090909[/C][C]2482.49090909090[/C][/ROW]
[ROW][C]13[/C][C]611324[/C][C]593748.954545454[/C][C]17575.0454545455[/C][/ROW]
[ROW][C]14[/C][C]594167[/C][C]575529.554545455[/C][C]18637.4454545455[/C][/ROW]
[ROW][C]15[/C][C]595454[/C][C]576811.954545455[/C][C]18642.0454545454[/C][/ROW]
[ROW][C]16[/C][C]590865[/C][C]590877.109090909[/C][C]-12.1090909090858[/C][/ROW]
[ROW][C]17[/C][C]589379[/C][C]585401.909090909[/C][C]3977.09090909092[/C][/ROW]
[ROW][C]18[/C][C]584428[/C][C]574828.709090909[/C][C]9599.2909090909[/C][/ROW]
[ROW][C]19[/C][C]573100[/C][C]567471.109090909[/C][C]5628.89090909091[/C][/ROW]
[ROW][C]20[/C][C]567456[/C][C]557515.509090909[/C][C]9940.4909090909[/C][/ROW]
[ROW][C]21[/C][C]569028[/C][C]558244.709090909[/C][C]10783.2909090909[/C][/ROW]
[ROW][C]22[/C][C]620735[/C][C]609572.509090909[/C][C]11162.4909090909[/C][/ROW]
[ROW][C]23[/C][C]628884[/C][C]618785.309090909[/C][C]10098.6909090909[/C][/ROW]
[ROW][C]24[/C][C]628232[/C][C]610130.509090909[/C][C]18101.4909090909[/C][/ROW]
[ROW][C]25[/C][C]612117[/C][C]593748.954545454[/C][C]18368.0454545456[/C][/ROW]
[ROW][C]26[/C][C]595404[/C][C]575529.554545455[/C][C]19874.4454545455[/C][/ROW]
[ROW][C]27[/C][C]597141[/C][C]576811.954545455[/C][C]20329.0454545454[/C][/ROW]
[ROW][C]28[/C][C]593408[/C][C]590877.109090909[/C][C]2530.89090909092[/C][/ROW]
[ROW][C]29[/C][C]590072[/C][C]585401.909090909[/C][C]4670.09090909092[/C][/ROW]
[ROW][C]30[/C][C]579799[/C][C]574828.709090909[/C][C]4970.29090909091[/C][/ROW]
[ROW][C]31[/C][C]574205[/C][C]567471.109090909[/C][C]6733.89090909091[/C][/ROW]
[ROW][C]32[/C][C]572775[/C][C]557515.509090909[/C][C]15259.4909090909[/C][/ROW]
[ROW][C]33[/C][C]572942[/C][C]558244.709090909[/C][C]14697.2909090909[/C][/ROW]
[ROW][C]34[/C][C]619567[/C][C]609572.509090909[/C][C]9994.49090909092[/C][/ROW]
[ROW][C]35[/C][C]625809[/C][C]618785.309090909[/C][C]7023.69090909091[/C][/ROW]
[ROW][C]36[/C][C]619916[/C][C]610130.509090909[/C][C]9785.4909090909[/C][/ROW]
[ROW][C]37[/C][C]587625[/C][C]593748.954545454[/C][C]-6123.95454545446[/C][/ROW]
[ROW][C]38[/C][C]565742[/C][C]575529.554545455[/C][C]-9787.55454545456[/C][/ROW]
[ROW][C]39[/C][C]557274[/C][C]576811.954545455[/C][C]-19537.9545454546[/C][/ROW]
[ROW][C]40[/C][C]560576[/C][C]525732.336363636[/C][C]34843.6636363636[/C][/ROW]
[ROW][C]41[/C][C]548854[/C][C]520257.136363636[/C][C]28596.8636363636[/C][/ROW]
[ROW][C]42[/C][C]531673[/C][C]509683.936363636[/C][C]21989.0636363636[/C][/ROW]
[ROW][C]43[/C][C]525919[/C][C]502326.336363636[/C][C]23592.6636363636[/C][/ROW]
[ROW][C]44[/C][C]511038[/C][C]492370.736363636[/C][C]18667.2636363636[/C][/ROW]
[ROW][C]45[/C][C]498662[/C][C]493099.936363636[/C][C]5562.06363636363[/C][/ROW]
[ROW][C]46[/C][C]555362[/C][C]544427.736363636[/C][C]10934.2636363636[/C][/ROW]
[ROW][C]47[/C][C]564591[/C][C]553640.536363636[/C][C]10950.4636363636[/C][/ROW]
[ROW][C]48[/C][C]541657[/C][C]544985.736363636[/C][C]-3328.73636363639[/C][/ROW]
[ROW][C]49[/C][C]527070[/C][C]528604.181818182[/C][C]-1534.18181818173[/C][/ROW]
[ROW][C]50[/C][C]509846[/C][C]510384.781818182[/C][C]-538.781818181832[/C][/ROW]
[ROW][C]51[/C][C]514258[/C][C]511667.181818182[/C][C]2590.81818181817[/C][/ROW]
[ROW][C]52[/C][C]516922[/C][C]525732.336363636[/C][C]-8810.33636363637[/C][/ROW]
[ROW][C]53[/C][C]507561[/C][C]520257.136363636[/C][C]-12696.1363636364[/C][/ROW]
[ROW][C]54[/C][C]492622[/C][C]509683.936363636[/C][C]-17061.9363636364[/C][/ROW]
[ROW][C]55[/C][C]490243[/C][C]502326.336363636[/C][C]-12083.3363636364[/C][/ROW]
[ROW][C]56[/C][C]469357[/C][C]492370.736363636[/C][C]-23013.7363636364[/C][/ROW]
[ROW][C]57[/C][C]477580[/C][C]493099.936363636[/C][C]-15519.9363636364[/C][/ROW]
[ROW][C]58[/C][C]528379[/C][C]544427.736363636[/C][C]-16048.7363636364[/C][/ROW]
[ROW][C]59[/C][C]533590[/C][C]553640.536363636[/C][C]-20050.5363636364[/C][/ROW]
[ROW][C]60[/C][C]517945[/C][C]544985.736363636[/C][C]-27040.7363636364[/C][/ROW]
[/TABLE]
Source: https://freestatistics.org/blog/index.php?pk=24951&T=4

Globally Unique Identifier (entire table): ba.freestatistics.org/blog/index.php?pk=24951&T=4

As an alternative you can also use a QR Code:  

The GUIDs for individual cells are displayed in the table below:

Multiple Linear Regression - Actuals, Interpolation, and Residuals
Time or IndexActualsInterpolationForecastResidualsPrediction Error
1565464593748.954545455-28284.9545454549
2547344575529.554545454-28185.5545454545
3554788576811.954545454-22023.9545454545
4562325590877.109090909-28552.1090909091
5560854585401.909090909-24547.9090909092
6555332574828.709090909-19496.7090909091
7543599567471.109090909-23872.1090909090
8536662557515.509090909-20853.5090909091
9542722558244.709090909-15522.7090909091
10593530609572.509090909-16042.5090909091
11610763618785.309090909-8022.3090909091
12612613610130.5090909092482.49090909090
13611324593748.95454545417575.0454545455
14594167575529.55454545518637.4454545455
15595454576811.95454545518642.0454545454
16590865590877.109090909-12.1090909090858
17589379585401.9090909093977.09090909092
18584428574828.7090909099599.2909090909
19573100567471.1090909095628.89090909091
20567456557515.5090909099940.4909090909
21569028558244.70909090910783.2909090909
22620735609572.50909090911162.4909090909
23628884618785.30909090910098.6909090909
24628232610130.50909090918101.4909090909
25612117593748.95454545418368.0454545456
26595404575529.55454545519874.4454545455
27597141576811.95454545520329.0454545454
28593408590877.1090909092530.89090909092
29590072585401.9090909094670.09090909092
30579799574828.7090909094970.29090909091
31574205567471.1090909096733.89090909091
32572775557515.50909090915259.4909090909
33572942558244.70909090914697.2909090909
34619567609572.5090909099994.49090909092
35625809618785.3090909097023.69090909091
36619916610130.5090909099785.4909090909
37587625593748.954545454-6123.95454545446
38565742575529.554545455-9787.55454545456
39557274576811.954545455-19537.9545454546
40560576525732.33636363634843.6636363636
41548854520257.13636363628596.8636363636
42531673509683.93636363621989.0636363636
43525919502326.33636363623592.6636363636
44511038492370.73636363618667.2636363636
45498662493099.9363636365562.06363636363
46555362544427.73636363610934.2636363636
47564591553640.53636363610950.4636363636
48541657544985.736363636-3328.73636363639
49527070528604.181818182-1534.18181818173
50509846510384.781818182-538.781818181832
51514258511667.1818181822590.81818181817
52516922525732.336363636-8810.33636363637
53507561520257.136363636-12696.1363636364
54492622509683.936363636-17061.9363636364
55490243502326.336363636-12083.3363636364
56469357492370.736363636-23013.7363636364
57477580493099.936363636-15519.9363636364
58528379544427.736363636-16048.7363636364
59533590553640.536363636-20050.5363636364
60517945544985.736363636-27040.7363636364


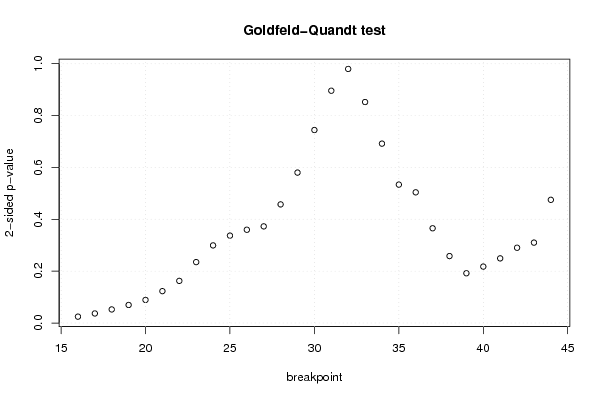
Goldfeld-Quandt test for Heteroskedasticity
p-valuesAlternative Hypothesis
breakpoint indexgreater2-sidedless
160.9877431918115890.02451361637682260.0122568081884113
170.9815783838503570.03684323229928690.0184216161496434
180.9738427697330710.05231446053385720.0261572302669286
190.9652033309174450.06959333816510890.0347966690825544
200.955448992887460.08910201422508210.0445510071125411
210.938536694125260.1229266117494820.061463305874741
220.9187621007688760.1624757984622480.0812378992311238
230.8825289528694280.2349420942611440.117471047130572
240.8503393782018540.2993212435962920.149660621798146
250.8314600505708760.3370798988582470.168539949429124
260.820157433403410.359685133193180.17984256659659
270.8136482600024110.3727034799951780.186351739997589
280.7712267556865730.4575464886268540.228773244313427
290.7099403518551960.5801192962896080.290059648144804
300.6278995432088660.7442009135822680.372100456791134
310.5520588471135610.8958823057728780.447941152886439
320.4899327816772330.9798655633544670.510067218322767
330.4261458988286480.8522917976572960.573854101171352
340.3459046784700730.6918093569401450.654095321529927
350.2668743192264260.5337486384528530.733125680773574
360.2520434602316830.5040869204633670.747956539768317
370.1826965859170480.3653931718340960.817303414082952
380.1290761085881140.2581522171762290.870923891411886
390.09594183003780870.1918836600756170.904058169962191
400.1087980093565440.2175960187130880.891201990643456
410.1246682622517430.2493365245034870.875331737748257
420.1451357215402370.2902714430804740.854864278459763
430.1550464982466920.3100929964933830.844953501753308
440.2375647272735980.4751294545471960.762435272726402

\begin{tabular}{lllllllll}
\hline
Goldfeld-Quandt test for Heteroskedasticity \tabularnewline
p-values & Alternative Hypothesis \tabularnewline
breakpoint index & greater & 2-sided & less \tabularnewline
16 & 0.987743191811589 & 0.0245136163768226 & 0.0122568081884113 \tabularnewline
17 & 0.981578383850357 & 0.0368432322992869 & 0.0184216161496434 \tabularnewline
18 & 0.973842769733071 & 0.0523144605338572 & 0.0261572302669286 \tabularnewline
19 & 0.965203330917445 & 0.0695933381651089 & 0.0347966690825544 \tabularnewline
20 & 0.95544899288746 & 0.0891020142250821 & 0.0445510071125411 \tabularnewline
21 & 0.93853669412526 & 0.122926611749482 & 0.061463305874741 \tabularnewline
22 & 0.918762100768876 & 0.162475798462248 & 0.0812378992311238 \tabularnewline
23 & 0.882528952869428 & 0.234942094261144 & 0.117471047130572 \tabularnewline
24 & 0.850339378201854 & 0.299321243596292 & 0.149660621798146 \tabularnewline
25 & 0.831460050570876 & 0.337079898858247 & 0.168539949429124 \tabularnewline
26 & 0.82015743340341 & 0.35968513319318 & 0.17984256659659 \tabularnewline
27 & 0.813648260002411 & 0.372703479995178 & 0.186351739997589 \tabularnewline
28 & 0.771226755686573 & 0.457546488626854 & 0.228773244313427 \tabularnewline
29 & 0.709940351855196 & 0.580119296289608 & 0.290059648144804 \tabularnewline
30 & 0.627899543208866 & 0.744200913582268 & 0.372100456791134 \tabularnewline
31 & 0.552058847113561 & 0.895882305772878 & 0.447941152886439 \tabularnewline
32 & 0.489932781677233 & 0.979865563354467 & 0.510067218322767 \tabularnewline
33 & 0.426145898828648 & 0.852291797657296 & 0.573854101171352 \tabularnewline
34 & 0.345904678470073 & 0.691809356940145 & 0.654095321529927 \tabularnewline
35 & 0.266874319226426 & 0.533748638452853 & 0.733125680773574 \tabularnewline
36 & 0.252043460231683 & 0.504086920463367 & 0.747956539768317 \tabularnewline
37 & 0.182696585917048 & 0.365393171834096 & 0.817303414082952 \tabularnewline
38 & 0.129076108588114 & 0.258152217176229 & 0.870923891411886 \tabularnewline
39 & 0.0959418300378087 & 0.191883660075617 & 0.904058169962191 \tabularnewline
40 & 0.108798009356544 & 0.217596018713088 & 0.891201990643456 \tabularnewline
41 & 0.124668262251743 & 0.249336524503487 & 0.875331737748257 \tabularnewline
42 & 0.145135721540237 & 0.290271443080474 & 0.854864278459763 \tabularnewline
43 & 0.155046498246692 & 0.310092996493383 & 0.844953501753308 \tabularnewline
44 & 0.237564727273598 & 0.475129454547196 & 0.762435272726402 \tabularnewline
\hline
\end{tabular}
%Source: https://freestatistics.org/blog/index.php?pk=24951&T=5

[TABLE]
[ROW][C]Goldfeld-Quandt test for Heteroskedasticity[/C][/ROW]
[ROW][C]p-values[/C][C]Alternative Hypothesis[/C][/ROW]
[ROW][C]breakpoint index[/C][C]greater[/C][C]2-sided[/C][C]less[/C][/ROW]
[ROW][C]16[/C][C]0.987743191811589[/C][C]0.0245136163768226[/C][C]0.0122568081884113[/C][/ROW]
[ROW][C]17[/C][C]0.981578383850357[/C][C]0.0368432322992869[/C][C]0.0184216161496434[/C][/ROW]
[ROW][C]18[/C][C]0.973842769733071[/C][C]0.0523144605338572[/C][C]0.0261572302669286[/C][/ROW]
[ROW][C]19[/C][C]0.965203330917445[/C][C]0.0695933381651089[/C][C]0.0347966690825544[/C][/ROW]
[ROW][C]20[/C][C]0.95544899288746[/C][C]0.0891020142250821[/C][C]0.0445510071125411[/C][/ROW]
[ROW][C]21[/C][C]0.93853669412526[/C][C]0.122926611749482[/C][C]0.061463305874741[/C][/ROW]
[ROW][C]22[/C][C]0.918762100768876[/C][C]0.162475798462248[/C][C]0.0812378992311238[/C][/ROW]
[ROW][C]23[/C][C]0.882528952869428[/C][C]0.234942094261144[/C][C]0.117471047130572[/C][/ROW]
[ROW][C]24[/C][C]0.850339378201854[/C][C]0.299321243596292[/C][C]0.149660621798146[/C][/ROW]
[ROW][C]25[/C][C]0.831460050570876[/C][C]0.337079898858247[/C][C]0.168539949429124[/C][/ROW]
[ROW][C]26[/C][C]0.82015743340341[/C][C]0.35968513319318[/C][C]0.17984256659659[/C][/ROW]
[ROW][C]27[/C][C]0.813648260002411[/C][C]0.372703479995178[/C][C]0.186351739997589[/C][/ROW]
[ROW][C]28[/C][C]0.771226755686573[/C][C]0.457546488626854[/C][C]0.228773244313427[/C][/ROW]
[ROW][C]29[/C][C]0.709940351855196[/C][C]0.580119296289608[/C][C]0.290059648144804[/C][/ROW]
[ROW][C]30[/C][C]0.627899543208866[/C][C]0.744200913582268[/C][C]0.372100456791134[/C][/ROW]
[ROW][C]31[/C][C]0.552058847113561[/C][C]0.895882305772878[/C][C]0.447941152886439[/C][/ROW]
[ROW][C]32[/C][C]0.489932781677233[/C][C]0.979865563354467[/C][C]0.510067218322767[/C][/ROW]
[ROW][C]33[/C][C]0.426145898828648[/C][C]0.852291797657296[/C][C]0.573854101171352[/C][/ROW]
[ROW][C]34[/C][C]0.345904678470073[/C][C]0.691809356940145[/C][C]0.654095321529927[/C][/ROW]
[ROW][C]35[/C][C]0.266874319226426[/C][C]0.533748638452853[/C][C]0.733125680773574[/C][/ROW]
[ROW][C]36[/C][C]0.252043460231683[/C][C]0.504086920463367[/C][C]0.747956539768317[/C][/ROW]
[ROW][C]37[/C][C]0.182696585917048[/C][C]0.365393171834096[/C][C]0.817303414082952[/C][/ROW]
[ROW][C]38[/C][C]0.129076108588114[/C][C]0.258152217176229[/C][C]0.870923891411886[/C][/ROW]
[ROW][C]39[/C][C]0.0959418300378087[/C][C]0.191883660075617[/C][C]0.904058169962191[/C][/ROW]
[ROW][C]40[/C][C]0.108798009356544[/C][C]0.217596018713088[/C][C]0.891201990643456[/C][/ROW]
[ROW][C]41[/C][C]0.124668262251743[/C][C]0.249336524503487[/C][C]0.875331737748257[/C][/ROW]
[ROW][C]42[/C][C]0.145135721540237[/C][C]0.290271443080474[/C][C]0.854864278459763[/C][/ROW]
[ROW][C]43[/C][C]0.155046498246692[/C][C]0.310092996493383[/C][C]0.844953501753308[/C][/ROW]
[ROW][C]44[/C][C]0.237564727273598[/C][C]0.475129454547196[/C][C]0.762435272726402[/C][/ROW]
[/TABLE]
Source: https://freestatistics.org/blog/index.php?pk=24951&T=5

Globally Unique Identifier (entire table): ba.freestatistics.org/blog/index.php?pk=24951&T=5

As an alternative you can also use a QR Code:  

The GUIDs for individual cells are displayed in the table below:

Goldfeld-Quandt test for Heteroskedasticity
p-valuesAlternative Hypothesis
breakpoint indexgreater2-sidedless
160.9877431918115890.02451361637682260.0122568081884113
170.9815783838503570.03684323229928690.0184216161496434
180.9738427697330710.05231446053385720.0261572302669286
190.9652033309174450.06959333816510890.0347966690825544
200.955448992887460.08910201422508210.0445510071125411
210.938536694125260.1229266117494820.061463305874741
220.9187621007688760.1624757984622480.0812378992311238
230.8825289528694280.2349420942611440.117471047130572
240.8503393782018540.2993212435962920.149660621798146
250.8314600505708760.3370798988582470.168539949429124
260.820157433403410.359685133193180.17984256659659
270.8136482600024110.3727034799951780.186351739997589
280.7712267556865730.4575464886268540.228773244313427
290.7099403518551960.5801192962896080.290059648144804
300.6278995432088660.7442009135822680.372100456791134
310.5520588471135610.8958823057728780.447941152886439
320.4899327816772330.9798655633544670.510067218322767
330.4261458988286480.8522917976572960.573854101171352
340.3459046784700730.6918093569401450.654095321529927
350.2668743192264260.5337486384528530.733125680773574
360.2520434602316830.5040869204633670.747956539768317
370.1826965859170480.3653931718340960.817303414082952
380.1290761085881140.2581522171762290.870923891411886
390.09594183003780870.1918836600756170.904058169962191
400.1087980093565440.2175960187130880.891201990643456
410.1246682622517430.2493365245034870.875331737748257
420.1451357215402370.2902714430804740.854864278459763
430.1550464982466920.3100929964933830.844953501753308
440.2375647272735980.4751294545471960.762435272726402


Meta Analysis of Goldfeld-Quandt test for Heteroskedasticity
Description# significant tests% significant testsOK/NOK
1% type I error level00OK
5% type I error level20.0689655172413793NOK
10% type I error level50.172413793103448NOK

\begin{tabular}{lllllllll}
\hline
Meta Analysis of Goldfeld-Quandt test for Heteroskedasticity \tabularnewline
Description & # significant tests & % significant tests & OK/NOK \tabularnewline
1% type I error level & 0 & 0 & OK \tabularnewline
5% type I error level & 2 & 0.0689655172413793 & NOK \tabularnewline
10% type I error level & 5 & 0.172413793103448 & NOK \tabularnewline
\hline
\end{tabular}
%Source: https://freestatistics.org/blog/index.php?pk=24951&T=6

[TABLE]
[ROW][C]Meta Analysis of Goldfeld-Quandt test for Heteroskedasticity[/C][/ROW]
[ROW][C]Description[/C][C]# significant tests[/C][C]% significant tests[/C][C]OK/NOK[/C][/ROW]
[ROW][C]1% type I error level[/C][C]0[/C][C]0[/C][C]OK[/C][/ROW]
[ROW][C]5% type I error level[/C][C]2[/C][C]0.0689655172413793[/C][C]NOK[/C][/ROW]
[ROW][C]10% type I error level[/C][C]5[/C][C]0.172413793103448[/C][C]NOK[/C][/ROW]
[/TABLE]
Source: https://freestatistics.org/blog/index.php?pk=24951&T=6

Globally Unique Identifier (entire table): ba.freestatistics.org/blog/index.php?pk=24951&T=6

As an alternative you can also use a QR Code:  

The GUIDs for individual cells are displayed in the table below:

Meta Analysis of Goldfeld-Quandt test for Heteroskedasticity
Description# significant tests% significant testsOK/NOK
1% type I error level00OK
5% type I error level20.0689655172413793NOK
10% type I error level50.172413793103448NOK


Parameters (Session):
par1 = 1 ; par2 = Include Monthly Dummies ; par3 = No Linear Trend ;
Parameters (R input):
par1 = 1 ; par2 = Include Monthly Dummies ; par3 = No Linear Trend ;
R code (references can be found in the software module):
library(lattice)
library(lmtest)
n25 <- 25 #minimum number of obs. for Goldfeld-Quandt test
par1 <- as.numeric(par1)
x <- t(y)
k <- length(x[1,])
n <- length(x[,1])
x1 <- cbind(x[,par1], x[,1:k!=par1])
mycolnames <- c(colnames(x)[par1], colnames(x)[1:k!=par1])
colnames(x1) <- mycolnames #colnames(x)[par1]
x <- x1
if (par3 == 'First Differences'){
x2 <- array(0, dim=c(n-1,k), dimnames=list(1:(n-1), paste('(1-B)',colnames(x),sep='')))
for (i in 1:n-1) {
for (j in 1:k) {
x2[i,j] <- x[i+1,j] - x[i,j]
}
}
x <- x2
}
if (par2 == 'Include Monthly Dummies'){
x2 <- array(0, dim=c(n,11), dimnames=list(1:n, paste('M', seq(1:11), sep ='')))
for (i in 1:11){
x2[seq(i,n,12),i] <- 1
}
x <- cbind(x, x2)
}
if (par2 == 'Include Quarterly Dummies'){
x2 <- array(0, dim=c(n,3), dimnames=list(1:n, paste('Q', seq(1:3), sep ='')))
for (i in 1:3){
x2[seq(i,n,4),i] <- 1
}
x <- cbind(x, x2)
}
k <- length(x[1,])
if (par3 == 'Linear Trend'){
x <- cbind(x, c(1:n))
colnames(x)[k+1] <- 't'
}
x
k <- length(x[1,])
df <- as.data.frame(x)
(mylm <- lm(df))
(mysum <- summary(mylm))
if (n > n25) {
kp3 <- k + 3
nmkm3 <- n - k - 3
gqarr <- array(NA, dim=c(nmkm3-kp3+1,3))
numgqtests <- 0
numsignificant1 <- 0
numsignificant5 <- 0
numsignificant10 <- 0
for (mypoint in kp3:nmkm3) {
j <- 0
numgqtests <- numgqtests + 1
for (myalt in c('greater', 'two.sided', 'less')) {
j <- j + 1
gqarr[mypoint-kp3+1,j] <- gqtest(mylm, point=mypoint, alternative=myalt)$p.value
}
if (gqarr[mypoint-kp3+1,2] < 0.01) numsignificant1 <- numsignificant1 + 1
if (gqarr[mypoint-kp3+1,2] < 0.05) numsignificant5 <- numsignificant5 + 1
if (gqarr[mypoint-kp3+1,2] < 0.10) numsignificant10 <- numsignificant10 + 1
}
gqarr
}
bitmap(file='test0.png')
plot(x[,1], type='l', main='Actuals and Interpolation', ylab='value of Actuals and Interpolation (dots)', xlab='time or index')
points(x[,1]-mysum$resid)
grid()
dev.off()
bitmap(file='test1.png')
plot(mysum$resid, type='b', pch=19, main='Residuals', ylab='value of Residuals', xlab='time or index')
grid()
dev.off()
bitmap(file='test2.png')
hist(mysum$resid, main='Residual Histogram', xlab='values of Residuals')
grid()
dev.off()
bitmap(file='test3.png')
densityplot(~mysum$resid,col='black',main='Residual Density Plot', xlab='values of Residuals')
dev.off()
bitmap(file='test4.png')
qqnorm(mysum$resid, main='Residual Normal Q-Q Plot')
qqline(mysum$resid)
grid()
dev.off()
(myerror <- as.ts(mysum$resid))
bitmap(file='test5.png')
dum <- cbind(lag(myerror,k=1),myerror)
dum
dum1 <- dum[2:length(myerror),]
dum1
z <- as.data.frame(dum1)
z
plot(z,main=paste('Residual Lag plot, lowess, and regression line'), ylab='values of Residuals', xlab='lagged values of Residuals')
lines(lowess(z))
abline(lm(z))
grid()
dev.off()
bitmap(file='test6.png')
acf(mysum$resid, lag.max=length(mysum$resid)/2, main='Residual Autocorrelation Function')
grid()
dev.off()
bitmap(file='test7.png')
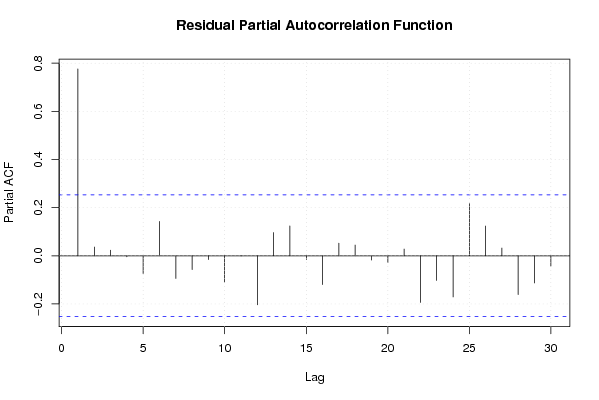
pacf(mysum$resid, lag.max=length(mysum$resid)/2, main='Residual Partial Autocorrelation Function')
grid()
dev.off()
bitmap(file='test8.png')
opar <- par(mfrow = c(2,2), oma = c(0, 0, 1.1, 0))
plot(mylm, las = 1, sub='Residual Diagnostics')
par(opar)
dev.off()
if (n > n25) {
bitmap(file='test9.png')
plot(kp3:nmkm3,gqarr[,2], main='Goldfeld-Quandt test',ylab='2-sided p-value',xlab='breakpoint')
grid()
dev.off()
}
load(file='createtable')
a<-table.start()
a<-table.row.start(a)
a<-table.element(a, 'Multiple Linear Regression - Estimated Regression Equation', 1, TRUE)
a<-table.row.end(a)
myeq <- colnames(x)[1]
myeq <- paste(myeq, '[t] = ', sep='')
for (i in 1:k){
if (mysum$coefficients[i,1] > 0) myeq <- paste(myeq, '+', '')
myeq <- paste(myeq, mysum$coefficients[i,1], sep=' ')
if (rownames(mysum$coefficients)[i] != '(Intercept)') {
myeq <- paste(myeq, rownames(mysum$coefficients)[i], sep='')
if (rownames(mysum$coefficients)[i] != 't') myeq <- paste(myeq, '[t]', sep='')
}
}
myeq <- paste(myeq, ' + e[t]')
a<-table.row.start(a)
a<-table.element(a, myeq)
a<-table.row.end(a)
a<-table.end(a)
table.save(a,file='mytable1.tab')
a<-table.start()
a<-table.row.start(a)
a<-table.element(a,hyperlink('ols1.htm','Multiple Linear Regression - Ordinary Least Squares',''), 6, TRUE)
a<-table.row.end(a)
a<-table.row.start(a)
a<-table.element(a,'Variable',header=TRUE)
a<-table.element(a,'Parameter',header=TRUE)
a<-table.element(a,'S.D.',header=TRUE)
a<-table.element(a,'T-STAT
H0: parameter = 0',header=TRUE)
a<-table.element(a,'2-tail p-value',header=TRUE)
a<-table.element(a,'1-tail p-value',header=TRUE)
a<-table.row.end(a)
for (i in 1:k){
a<-table.row.start(a)
a<-table.element(a,rownames(mysum$coefficients)[i],header=TRUE)
a<-table.element(a,mysum$coefficients[i,1])
a<-table.element(a, round(mysum$coefficients[i,2],6))
a<-table.element(a, round(mysum$coefficients[i,3],4))
a<-table.element(a, round(mysum$coefficients[i,4],6))
a<-table.element(a, round(mysum$coefficients[i,4]/2,6))
a<-table.row.end(a)
}
a<-table.end(a)
table.save(a,file='mytable2.tab')
a<-table.start()
a<-table.row.start(a)
a<-table.element(a, 'Multiple Linear Regression - Regression Statistics', 2, TRUE)
a<-table.row.end(a)
a<-table.row.start(a)
a<-table.element(a, 'Multiple R',1,TRUE)
a<-table.element(a, sqrt(mysum$r.squared))
a<-table.row.end(a)
a<-table.row.start(a)
a<-table.element(a, 'R-squared',1,TRUE)
a<-table.element(a, mysum$r.squared)
a<-table.row.end(a)
a<-table.row.start(a)
a<-table.element(a, 'Adjusted R-squared',1,TRUE)
a<-table.element(a, mysum$adj.r.squared)
a<-table.row.end(a)
a<-table.row.start(a)
a<-table.element(a, 'F-TEST (value)',1,TRUE)
a<-table.element(a, mysum$fstatistic[1])
a<-table.row.end(a)
a<-table.row.start(a)
a<-table.element(a, 'F-TEST (DF numerator)',1,TRUE)
a<-table.element(a, mysum$fstatistic[2])
a<-table.row.end(a)
a<-table.row.start(a)
a<-table.element(a, 'F-TEST (DF denominator)',1,TRUE)
a<-table.element(a, mysum$fstatistic[3])
a<-table.row.end(a)
a<-table.row.start(a)
a<-table.element(a, 'p-value',1,TRUE)
a<-table.element(a, 1-pf(mysum$fstatistic[1],mysum$fstatistic[2],mysum$fstatistic[3]))
a<-table.row.end(a)
a<-table.row.start(a)
a<-table.element(a, 'Multiple Linear Regression - Residual Statistics', 2, TRUE)
a<-table.row.end(a)
a<-table.row.start(a)
a<-table.element(a, 'Residual Standard Deviation',1,TRUE)
a<-table.element(a, mysum$sigma)
a<-table.row.end(a)
a<-table.row.start(a)
a<-table.element(a, 'Sum Squared Residuals',1,TRUE)
a<-table.element(a, sum(myerror*myerror))
a<-table.row.end(a)
a<-table.end(a)
table.save(a,file='mytable3.tab')
a<-table.start()
a<-table.row.start(a)
a<-table.element(a, 'Multiple Linear Regression - Actuals, Interpolation, and Residuals', 4, TRUE)
a<-table.row.end(a)
a<-table.row.start(a)
a<-table.element(a, 'Time or Index', 1, TRUE)
a<-table.element(a, 'Actuals', 1, TRUE)
a<-table.element(a, 'Interpolation
Forecast', 1, TRUE)
a<-table.element(a, 'Residuals
Prediction Error', 1, TRUE)
a<-table.row.end(a)
for (i in 1:n) {
a<-table.row.start(a)
a<-table.element(a,i, 1, TRUE)
a<-table.element(a,x[i])
a<-table.element(a,x[i]-mysum$resid[i])
a<-table.element(a,mysum$resid[i])
a<-table.row.end(a)
}
a<-table.end(a)
table.save(a,file='mytable4.tab')
if (n > n25) {
a<-table.start()
a<-table.row.start(a)
a<-table.element(a,'Goldfeld-Quandt test for Heteroskedasticity',4,TRUE)
a<-table.row.end(a)
a<-table.row.start(a)
a<-table.element(a,'p-values',header=TRUE)
a<-table.element(a,'Alternative Hypothesis',3,header=TRUE)
a<-table.row.end(a)
a<-table.row.start(a)
a<-table.element(a,'breakpoint index',header=TRUE)
a<-table.element(a,'greater',header=TRUE)
a<-table.element(a,'2-sided',header=TRUE)
a<-table.element(a,'less',header=TRUE)
a<-table.row.end(a)
for (mypoint in kp3:nmkm3) {
a<-table.row.start(a)
a<-table.element(a,mypoint,header=TRUE)
a<-table.element(a,gqarr[mypoint-kp3+1,1])
a<-table.element(a,gqarr[mypoint-kp3+1,2])
a<-table.element(a,gqarr[mypoint-kp3+1,3])
a<-table.row.end(a)
}
a<-table.end(a)
table.save(a,file='mytable5.tab')
a<-table.start()
a<-table.row.start(a)
a<-table.element(a,'Meta Analysis of Goldfeld-Quandt test for Heteroskedasticity',4,TRUE)
a<-table.row.end(a)
a<-table.row.start(a)
a<-table.element(a,'Description',header=TRUE)
a<-table.element(a,'# significant tests',header=TRUE)
a<-table.element(a,'% significant tests',header=TRUE)
a<-table.element(a,'OK/NOK',header=TRUE)
a<-table.row.end(a)
a<-table.row.start(a)
a<-table.element(a,'1% type I error level',header=TRUE)
a<-table.element(a,numsignificant1)
a<-table.element(a,numsignificant1/numgqtests)
if (numsignificant1/numgqtests < 0.01) dum <- 'OK' else dum <- 'NOK'
a<-table.element(a,dum)
a<-table.row.end(a)
a<-table.row.start(a)
a<-table.element(a,'5% type I error level',header=TRUE)
a<-table.element(a,numsignificant5)
a<-table.element(a,numsignificant5/numgqtests)
if (numsignificant5/numgqtests < 0.05) dum <- 'OK' else dum <- 'NOK'
a<-table.element(a,dum)
a<-table.row.end(a)
a<-table.row.start(a)
a<-table.element(a,'10% type I error level',header=TRUE)
a<-table.element(a,numsignificant10)
a<-table.element(a,numsignificant10/numgqtests)
if (numsignificant10/numgqtests < 0.1) dum <- 'OK' else dum <- 'NOK'
a<-table.element(a,dum)
a<-table.row.end(a)
a<-table.end(a)
table.save(a,file='mytable6.tab')
}