Free Statistics

of Irreproducible Research!

Author's title

Author*Unverified author*
R Software Modulerwasp_fitdistrnorm.wasp
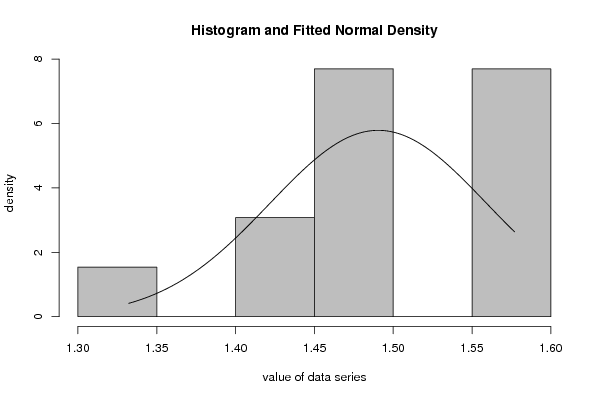
Title produced by softwareMaximum-likelihood Fitting - Normal Distribution
Date of computationThu, 13 Nov 2008 17:29:18 -0700
Cite this page as followsStatistical Computations at FreeStatistics.org, Office for Research Development and Education, URL https://freestatistics.org/blog/index.php?v=date/2008/Nov/14/t1226622588ukyc7r2nqtm6q6q.htm/, Retrieved Sun, 19 May 2024 08:53:54 +0000
Statistical Computations at FreeStatistics.org, Office for Research Development and Education, URL https://freestatistics.org/blog/index.php?pk=24894, Retrieved Sun, 19 May 2024 08:53:54 +0000
QR Codes:

Original text written by user:
IsPrivate?No (this computation is public)
User-defined keywords
Estimated Impact220
Family? (F = Feedback message, R = changed R code, M = changed R Module, P = changed Parameters, D = changed Data)
-     [Bivariate Kernel Density Estimation] [] [2008-11-13 23:07:55] [108c99fc7c328084b08f3800f7874943]
F RMPD  [Box-Cox Linearity Plot] [] [2008-11-14 00:14:50] [108c99fc7c328084b08f3800f7874943]
F RMPD      [Maximum-likelihood Fitting - Normal Distribution] [] [2008-11-14 00:29:18] [8fe13e00c5696af38d958e9734b9d18e] [Current]
Feedback Forum
2008-11-15 18:45:16 [Hundra Smet] [reply
juiste grafiek, weinig metingen.
de waarde van de data (= staafdiagram) ligt niet op de normaalverdeling.
de benadering is dus niet correct.
2008-11-22 13:52:08 [Sandra Hofmans] [reply
Ik zou meer waarden in hebben gegeven. Hier hebben we maar weinig gegevens om conclusies te trekken. Hetgeen wat je momenteel bekomt, doet inderdaad niet denken aan een normaalverdeling.
2008-11-22 15:26:13 [c00776cbed2786c9c4960950021bd861] [reply
Zoals de andere studenten reeds hebben vermeld, zijn er heel weinig metingen gebruikt.
Maar wat we zien is helemaal geen normaalverdeling. dit is vooral bij de laatste 2 staven, zij steken veel uit boven de normaalverdeling.
2008-11-24 10:41:21 [Yannick Van Schil] [reply
Ik ga akkoord met de andere studenten, weinig metingen, moeilijk een conclusie te trekken

Post a new message
Dataseries X:
1,3322
1,4369
1,4975
1,577
1,5553
1,5557
1,575
1,5527
1,4748
1,4718
1,457
1,4684
1,4227


Summary of computational transaction
Raw Inputview raw input (R code)
Raw Outputview raw output of R engine
Computing time3 seconds
R Server'Herman Ole Andreas Wold' @ 193.190.124.10:1001

\begin{tabular}{lllllllll}
\hline
Summary of computational transaction \tabularnewline
Raw Input & view raw input (R code)  \tabularnewline
Raw Output & view raw output of R engine  \tabularnewline
Computing time & 3 seconds \tabularnewline
R Server & 'Herman Ole Andreas Wold' @ 193.190.124.10:1001 \tabularnewline
\hline
\end{tabular}
%Source: https://freestatistics.org/blog/index.php?pk=24894&T=0

[TABLE]
[ROW][C]Summary of computational transaction[/C][/ROW]
[ROW][C]Raw Input[/C][C]view raw input (R code) [/C][/ROW]
[ROW][C]Raw Output[/C][C]view raw output of R engine [/C][/ROW]
[ROW][C]Computing time[/C][C]3 seconds[/C][/ROW]
[ROW][C]R Server[/C][C]'Herman Ole Andreas Wold' @ 193.190.124.10:1001[/C][/ROW]
[/TABLE]
Source: https://freestatistics.org/blog/index.php?pk=24894&T=0

Globally Unique Identifier (entire table): ba.freestatistics.org/blog/index.php?pk=24894&T=0

As an alternative you can also use a QR Code:  

The GUIDs for individual cells are displayed in the table below:

Summary of computational transaction
Raw Inputview raw input (R code)
Raw Outputview raw output of R engine
Computing time3 seconds
R Server'Herman Ole Andreas Wold' @ 193.190.124.10:1001


ParameterEstimated ValueStandard Deviation
mean1.490538461538460.0191113106274995
standard deviation0.06890681040876910.0135137373420674

\begin{tabular}{lllllllll}
\hline
Parameter & Estimated Value & Standard Deviation \tabularnewline
mean & 1.49053846153846 & 0.0191113106274995 \tabularnewline
standard deviation & 0.0689068104087691 & 0.0135137373420674 \tabularnewline
\hline
\end{tabular}
%Source: https://freestatistics.org/blog/index.php?pk=24894&T=1

[TABLE]
[ROW][C]Parameter[/C][C]Estimated Value[/C][C]Standard Deviation[/C][/ROW]
[ROW][C]mean[/C][C]1.49053846153846[/C][C]0.0191113106274995[/C][/ROW]
[ROW][C]standard deviation[/C][C]0.0689068104087691[/C][C]0.0135137373420674[/C][/ROW]
[/TABLE]
Source: https://freestatistics.org/blog/index.php?pk=24894&T=1

Globally Unique Identifier (entire table): ba.freestatistics.org/blog/index.php?pk=24894&T=1

As an alternative you can also use a QR Code:  

The GUIDs for individual cells are displayed in the table below:

ParameterEstimated ValueStandard Deviation
mean1.490538461538460.0191113106274995
standard deviation0.06890681040876910.0135137373420674


Parameters (Session):
par1 = 8 ; par2 = 0 ;
Parameters (R input):
par1 = 8 ; par2 = 0 ;
R code (references can be found in the software module):
library(MASS)
par1 <- as.numeric(par1)
if (par2 == '0') par2 = 'Sturges' else par2 <- as.numeric(par2)
x <- as.ts(x) #otherwise the fitdistr function does not work properly
r <- fitdistr(x,'normal')
r
bitmap(file='test1.png')
myhist<-hist(x,col=par1,breaks=par2,main=main,ylab=ylab,xlab=xlab,freq=F)
curve(1/(r$estimate[2]*sqrt(2*pi))*exp(-1/2*((x-r$estimate[1])/r$estimate[2])^2),min(x),max(x),add=T)
dev.off()
load(file='createtable')
a<-table.start()
a<-table.row.start(a)
a<-table.element(a,'Parameter',1,TRUE)
a<-table.element(a,'Estimated Value',1,TRUE)
a<-table.element(a,'Standard Deviation',1,TRUE)
a<-table.row.end(a)
a<-table.row.start(a)
a<-table.element(a,'mean',header=TRUE)
a<-table.element(a,r$estimate[1])
a<-table.element(a,r$sd[1])
a<-table.row.end(a)
a<-table.row.start(a)
a<-table.element(a,'standard deviation',header=TRUE)
a<-table.element(a,r$estimate[2])
a<-table.element(a,r$sd[2])
a<-table.row.end(a)
a<-table.end(a)
table.save(a,file='mytable.tab')