Free Statistics

of Irreproducible Research!

Author's title

Author*Unverified author*
R Software Modulerwasp_boxcoxlin.wasp
Title produced by softwareBox-Cox Linearity Plot
Date of computationThu, 13 Nov 2008 17:14:50 -0700
Cite this page as followsStatistical Computations at FreeStatistics.org, Office for Research Development and Education, URL https://freestatistics.org/blog/index.php?v=date/2008/Nov/14/t1226621720gawb97kie7jsztv.htm/, Retrieved Sun, 19 May 2024 12:41:08 +0000
Statistical Computations at FreeStatistics.org, Office for Research Development and Education, URL https://freestatistics.org/blog/index.php?pk=24893, Retrieved Sun, 19 May 2024 12:41:08 +0000
QR Codes:

Original text written by user:
IsPrivate?No (this computation is public)
User-defined keywords
Estimated Impact230
Family? (F = Feedback message, R = changed R code, M = changed R Module, P = changed Parameters, D = changed Data)
-     [Bivariate Kernel Density Estimation] [] [2008-11-13 23:07:55] [108c99fc7c328084b08f3800f7874943]
F RMPD    [Box-Cox Linearity Plot] [] [2008-11-14 00:14:50] [8fe13e00c5696af38d958e9734b9d18e] [Current]
F RMPD      [Maximum-likelihood Fitting - Normal Distribution] [] [2008-11-14 00:29:18] [108c99fc7c328084b08f3800f7874943]
Feedback Forum
2008-11-15 18:40:12 [Hundra Smet] [reply
(?ik denk dat het hier niet klopt om bij een box cox linearity plot datums in de Y data te zetten.?) + er werden slechts weinig metingen in de X data gezet.

door middel van de box cox transformation zoeken we uit of de data te transformeren zijn tot een lineair verband.

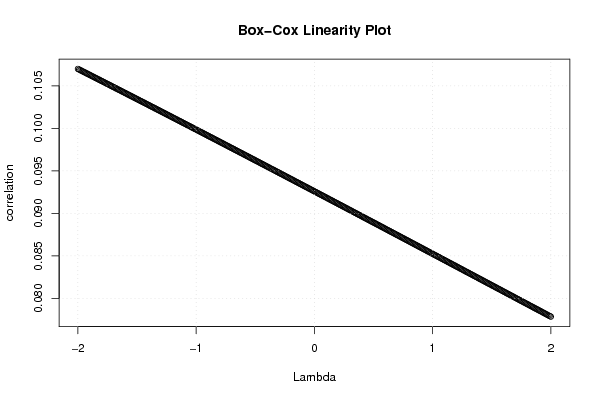
in de box cox linearity plot van de student zien we een negatieve rechte die bij de lambda waarde -2 een maximum bereikt. gevolg hiervan is dat -2 de beste transformatie is.

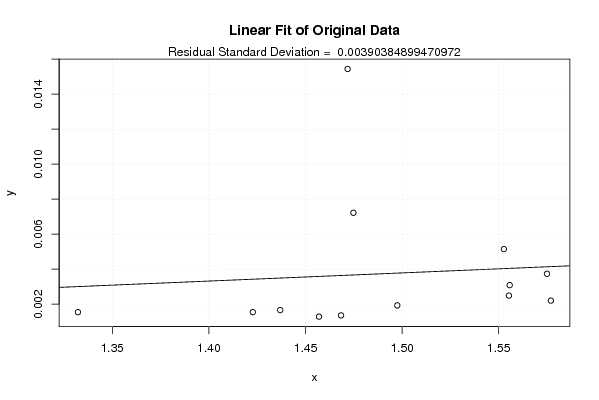
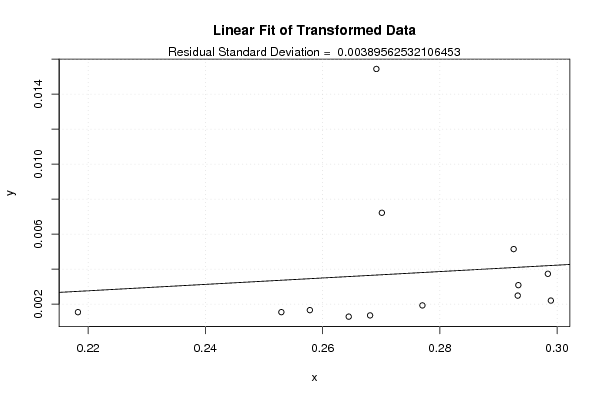
we zien dat bij de transformatie van de student er geen verschil is tussen de lineair fit van de originele data en die van de getransformeerde.
  2008-11-22 13:49:35 [Sandra Hofmans] [reply
IN de grafieken zie je inderdaad geen grote verschillen, maar wel als we de tabellen met elkaar vergelijken.
2008-11-15 18:42:48 [Hundra Smet] [reply
voor Q4 is ook deze link gegeven, dit klopt absoluut niet.
hier moet je een box cox normality plot maken voor Yt. dit lukt bij de student dus niet.
hieronder voeg ik toch een stukje theorie toe:
Theorie: The Box-Cox normality plot is a plot of these correlation coefficients
for various values of the parameter. The value of corresponding
to the maximum correlation on the plot is then the optimal choice for lambda.
2008-11-22 15:23:09 [c00776cbed2786c9c4960950021bd861] [reply
De box-cox linearity plot is een plot van de correlatie tussen Y en getransformeerde x-waarden voor verschillende waarden van lambda (dit werd ook door de student vermeld).
Voor lambda = -2 vinden we de hoogste correlatie, voor lambda = 2, de laagste correlatie.
Aan de linear fit kunnen zien dat de transformatie niet voor veel verbetering heeft gezorgd (de punten liggen nog hetzelfde).
Ook de residual standard deviation is ongeveer hetzelfde gebleven (0.00390 --> 0.00389)wat ook wijst op geen goede transformatie.
2008-11-24 10:38:33 [Yannick Van Schil] [reply
De box-cox linearity plot geeft de correlatie tussen Y en getransformeerde x-waarden weer voor verschillende waarden van lambda. De linear fit geeft weer of de transformatie nuttig was of niet ( of ze dus voor verbetering zorgt) Hier was dit niet het geval.

Post a new message
Dataseries X:
1.3322
1.4369
1.4975
1.577
1.5553
1.5557
1.575
1.5527
1.4748
1.4718
1.457
1.4684
1.4227
Dataseries Y:
31/10/2008
30/09/2008
31/08/2008
31/07/2008
30/06/2008
31/05/2008
30/04/2008
31/03/2008
29/02/2008
31/01/2008
31/12/2007
30/11/2007
31/10/2007


Summary of computational transaction
Raw Inputview raw input (R code)
Raw Outputview raw output of R engine
Computing time3 seconds
R Server'Sir Ronald Aylmer Fisher' @ 193.190.124.24

\begin{tabular}{lllllllll}
\hline
Summary of computational transaction \tabularnewline
Raw Input & view raw input (R code)  \tabularnewline
Raw Output & view raw output of R engine  \tabularnewline
Computing time & 3 seconds \tabularnewline
R Server & 'Sir Ronald Aylmer Fisher' @ 193.190.124.24 \tabularnewline
\hline
\end{tabular}
%Source: https://freestatistics.org/blog/index.php?pk=24893&T=0

[TABLE]
[ROW][C]Summary of computational transaction[/C][/ROW]
[ROW][C]Raw Input[/C][C]view raw input (R code) [/C][/ROW]
[ROW][C]Raw Output[/C][C]view raw output of R engine [/C][/ROW]
[ROW][C]Computing time[/C][C]3 seconds[/C][/ROW]
[ROW][C]R Server[/C][C]'Sir Ronald Aylmer Fisher' @ 193.190.124.24[/C][/ROW]
[/TABLE]
Source: https://freestatistics.org/blog/index.php?pk=24893&T=0

Globally Unique Identifier (entire table): ba.freestatistics.org/blog/index.php?pk=24893&T=0

As an alternative you can also use a QR Code:  

The GUIDs for individual cells are displayed in the table below:

Summary of computational transaction
Raw Inputview raw input (R code)
Raw Outputview raw output of R engine
Computing time3 seconds
R Server'Sir Ronald Aylmer Fisher' @ 193.190.124.24


Box-Cox Linearity Plot
# observations x13
maximum correlation0.106984301630248
optimal lambda(x)-2
Residual SD (orginial)0.00390384899470972
Residual SD (transformed)0.00389562532106453

\begin{tabular}{lllllllll}
\hline
Box-Cox Linearity Plot \tabularnewline
# observations x & 13 \tabularnewline
maximum correlation & 0.106984301630248 \tabularnewline
optimal lambda(x) & -2 \tabularnewline
Residual SD (orginial) & 0.00390384899470972 \tabularnewline
Residual SD (transformed) & 0.00389562532106453 \tabularnewline
\hline
\end{tabular}
%Source: https://freestatistics.org/blog/index.php?pk=24893&T=1

[TABLE]
[ROW][C]Box-Cox Linearity Plot[/C][/ROW]
[ROW][C]# observations x[/C][C]13[/C][/ROW]
[ROW][C]maximum correlation[/C][C]0.106984301630248[/C][/ROW]
[ROW][C]optimal lambda(x)[/C][C]-2[/C][/ROW]
[ROW][C]Residual SD (orginial)[/C][C]0.00390384899470972[/C][/ROW]
[ROW][C]Residual SD (transformed)[/C][C]0.00389562532106453[/C][/ROW]
[/TABLE]
Source: https://freestatistics.org/blog/index.php?pk=24893&T=1

Globally Unique Identifier (entire table): ba.freestatistics.org/blog/index.php?pk=24893&T=1

As an alternative you can also use a QR Code:  

The GUIDs for individual cells are displayed in the table below:

Box-Cox Linearity Plot
# observations x13
maximum correlation0.106984301630248
optimal lambda(x)-2
Residual SD (orginial)0.00390384899470972
Residual SD (transformed)0.00389562532106453


Parameters (Session):
Parameters (R input):
R code (references can be found in the software module):
n <- length(x)
c <- array(NA,dim=c(401))
l <- array(NA,dim=c(401))
mx <- 0
mxli <- -999
for (i in 1:401)
{
l[i] <- (i-201)/100
if (l[i] != 0)
{
x1 <- (x^l[i] - 1) / l[i]
} else {
x1 <- log(x)
}
c[i] <- cor(x1,y)
if (mx < abs(c[i]))
{
mx <- abs(c[i])
mxli <- l[i]
}
}
c
mx
mxli
if (mxli != 0)
{
x1 <- (x^mxli - 1) / mxli
} else {
x1 <- log(x)
}
r<-lm(y~x)
se <- sqrt(var(r$residuals))
r1 <- lm(y~x1)
se1 <- sqrt(var(r1$residuals))
bitmap(file='test1.png')
plot(l,c,main='Box-Cox Linearity Plot',xlab='Lambda',ylab='correlation')
grid()
dev.off()
bitmap(file='test2.png')
plot(x,y,main='Linear Fit of Original Data',xlab='x',ylab='y')
abline(r)
grid()
mtext(paste('Residual Standard Deviation = ',se))
dev.off()
bitmap(file='test3.png')
plot(x1,y,main='Linear Fit of Transformed Data',xlab='x',ylab='y')
abline(r1)
grid()
mtext(paste('Residual Standard Deviation = ',se1))
dev.off()
load(file='createtable')
a<-table.start()
a<-table.row.start(a)
a<-table.element(a,'Box-Cox Linearity Plot',2,TRUE)
a<-table.row.end(a)
a<-table.row.start(a)
a<-table.element(a,'# observations x',header=TRUE)
a<-table.element(a,n)
a<-table.row.end(a)
a<-table.row.start(a)
a<-table.element(a,'maximum correlation',header=TRUE)
a<-table.element(a,mx)
a<-table.row.end(a)
a<-table.row.start(a)
a<-table.element(a,'optimal lambda(x)',header=TRUE)
a<-table.element(a,mxli)
a<-table.row.end(a)
a<-table.row.start(a)
a<-table.element(a,'Residual SD (orginial)',header=TRUE)
a<-table.element(a,se)
a<-table.row.end(a)
a<-table.row.start(a)
a<-table.element(a,'Residual SD (transformed)',header=TRUE)
a<-table.element(a,se1)
a<-table.row.end(a)
a<-table.end(a)
table.save(a,file='mytable.tab')