Free Statistics

of Irreproducible Research!

Author's title

Author*Unverified author*
R Software Modulerwasp_hierarchicalclustering.wasp
Title produced by softwareHierarchical Clustering
Date of computationThu, 13 Nov 2008 16:55:13 -0700
Cite this page as followsStatistical Computations at FreeStatistics.org, Office for Research Development and Education, URL https://freestatistics.org/blog/index.php?v=date/2008/Nov/14/t12266205781dlztgomkwnwhpd.htm/, Retrieved Sun, 19 May 2024 10:10:31 +0000
Statistical Computations at FreeStatistics.org, Office for Research Development and Education, URL https://freestatistics.org/blog/index.php?pk=24892, Retrieved Sun, 19 May 2024 10:10:31 +0000
QR Codes:

Original text written by user:
IsPrivate?No (this computation is public)
User-defined keywords
Estimated Impact225
Family? (F = Feedback message, R = changed R code, M = changed R Module, P = changed Parameters, D = changed Data)
-     [Bivariate Kernel Density Estimation] [] [2008-11-13 23:07:55] [108c99fc7c328084b08f3800f7874943]
F RMPD    [Hierarchical Clustering] [] [2008-11-13 23:55:13] [8fe13e00c5696af38d958e9734b9d18e] [Current]
Feedback Forum
2008-11-15 18:32:01 [Hundra Smet] [reply
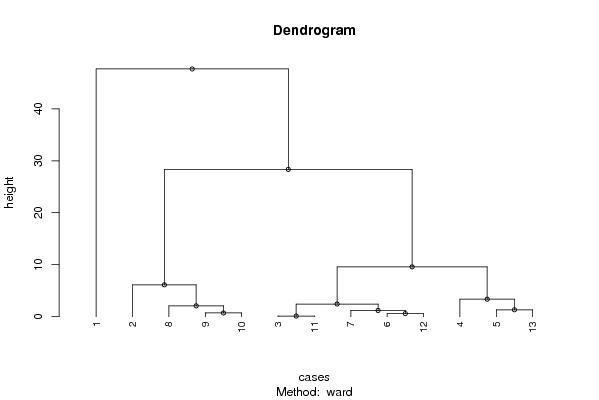
het nut van een dendrogram is dat we kunnen zien welke gegevens in 1 groep zitten en welke we dus anders moeten behandelen.

de linkertak bestaat slechts uit 1 tak. dit vormt 1 cluster. de overige gegevens zitten in de rechtertak, die nog vele andere vertakkingen kent. deze vormen de rechtercluster en de periodes hieronder zijn gelijkaardig.
er moet dus een opsplitsing (2 clusters) moet worden gemaakt bij de behandeling van de verschillende gegevens.
2008-11-22 13:47:28 [Sandra Hofmans] [reply
Een dendogram geeft weer in hoeverre een variabele gerelateerd is tot een andere. Zo kan je zien dat alles wat zich onder 1 tak bevindt dezelfde eigenschappen vertonen. Elke cluster wordt steeds opnieuw onderverdeeld, zodat je uiteindelijk bij 1 periode terechtkomt.
Hier kun je bijvoorbeeld zien dat 2,8, 9 en 10 dezelfde eigenschappen vertonen, maar dat 2 dan ook hier weer verschillend is van de 3 anderen.
2008-11-22 15:17:05 [c00776cbed2786c9c4960950021bd861] [reply
Met deze methode worden de verschillende tijdreeksen opgeplitst in periodes die gelijkaardig zijn. Bij deze student zijn er veel verschillende periodes.
We kunnen bijvoorbeeld zeggen dat groepen 9 en 10 in eenzelfde cluster zitten en dus gelijkaardige periodes zijn.
2008-11-24 10:33:25 [Yannick Van Schil] [reply
Een dendrogram verdeeld de gegevens in 2 periodes en deze 2 worden verder verdeeld in ook telkens 2 clusters. Zo moet men beide periodes steeds anders interpreteren.

Post a new message
Dataseries X:
1,3322	0,78668	133,52
1,4369	0,79924	153,2
1,4975	0,79279	163,63
1,577	0,79308	168,45
1,5553	0,79152	166,26
1,5557	0,79209	162,31
1,575	0,79487	161,56
1,5527	0,77494	156,59
1,4748	0,75094	157,97
1,4718	0,74725	158,68
1,457	0,72064	163,55
1,4684	0,70896	162,89
1,4227	0,69614	164,95


Summary of computational transaction
Raw Inputview raw input (R code)
Raw Outputview raw output of R engine
Computing time1 seconds
R Server'George Udny Yule' @ 72.249.76.132

\begin{tabular}{lllllllll}
\hline
Summary of computational transaction \tabularnewline
Raw Input & view raw input (R code)  \tabularnewline
Raw Output & view raw output of R engine  \tabularnewline
Computing time & 1 seconds \tabularnewline
R Server & 'George Udny Yule' @ 72.249.76.132 \tabularnewline
\hline
\end{tabular}
%Source: https://freestatistics.org/blog/index.php?pk=24892&T=0

[TABLE]
[ROW][C]Summary of computational transaction[/C][/ROW]
[ROW][C]Raw Input[/C][C]view raw input (R code) [/C][/ROW]
[ROW][C]Raw Output[/C][C]view raw output of R engine [/C][/ROW]
[ROW][C]Computing time[/C][C]1 seconds[/C][/ROW]
[ROW][C]R Server[/C][C]'George Udny Yule' @ 72.249.76.132[/C][/ROW]
[/TABLE]
Source: https://freestatistics.org/blog/index.php?pk=24892&T=0

Globally Unique Identifier (entire table): ba.freestatistics.org/blog/index.php?pk=24892&T=0

As an alternative you can also use a QR Code:  

The GUIDs for individual cells are displayed in the table below:

Summary of computational transaction
Raw Inputview raw input (R code)
Raw Outputview raw output of R engine
Computing time1 seconds
R Server'George Udny Yule' @ 72.249.76.132


Summary of Dendrogram
LabelHeight
10.115090714221424
20.592395042940082
30.710015926652361
41.19405599677583
51.32014397108800
62.07943051851717
72.43199970011433
83.35651770639922
96.12404694718292
109.57867906968221
1128.3444424515227
1247.6744300404254

\begin{tabular}{lllllllll}
\hline
Summary of Dendrogram \tabularnewline
Label & Height \tabularnewline
1 & 0.115090714221424 \tabularnewline
2 & 0.592395042940082 \tabularnewline
3 & 0.710015926652361 \tabularnewline
4 & 1.19405599677583 \tabularnewline
5 & 1.32014397108800 \tabularnewline
6 & 2.07943051851717 \tabularnewline
7 & 2.43199970011433 \tabularnewline
8 & 3.35651770639922 \tabularnewline
9 & 6.12404694718292 \tabularnewline
10 & 9.57867906968221 \tabularnewline
11 & 28.3444424515227 \tabularnewline
12 & 47.6744300404254 \tabularnewline
\hline
\end{tabular}
%Source: https://freestatistics.org/blog/index.php?pk=24892&T=1

[TABLE]
[ROW][C]Summary of Dendrogram[/C][/ROW]
[ROW][C]Label[/C][C]Height[/C][/ROW]
[ROW][C]1[/C][C]0.115090714221424[/C][/ROW]
[ROW][C]2[/C][C]0.592395042940082[/C][/ROW]
[ROW][C]3[/C][C]0.710015926652361[/C][/ROW]
[ROW][C]4[/C][C]1.19405599677583[/C][/ROW]
[ROW][C]5[/C][C]1.32014397108800[/C][/ROW]
[ROW][C]6[/C][C]2.07943051851717[/C][/ROW]
[ROW][C]7[/C][C]2.43199970011433[/C][/ROW]
[ROW][C]8[/C][C]3.35651770639922[/C][/ROW]
[ROW][C]9[/C][C]6.12404694718292[/C][/ROW]
[ROW][C]10[/C][C]9.57867906968221[/C][/ROW]
[ROW][C]11[/C][C]28.3444424515227[/C][/ROW]
[ROW][C]12[/C][C]47.6744300404254[/C][/ROW]
[/TABLE]
Source: https://freestatistics.org/blog/index.php?pk=24892&T=1

Globally Unique Identifier (entire table): ba.freestatistics.org/blog/index.php?pk=24892&T=1

As an alternative you can also use a QR Code:  

The GUIDs for individual cells are displayed in the table below:

Summary of Dendrogram
LabelHeight
10.115090714221424
20.592395042940082
30.710015926652361
41.19405599677583
51.32014397108800
62.07943051851717
72.43199970011433
83.35651770639922
96.12404694718292
109.57867906968221
1128.3444424515227
1247.6744300404254


Parameters (Session):
par1 = ward ; par2 = ALL ; par3 = FALSE ; par4 = FALSE ;
Parameters (R input):
par1 = ward ; par2 = ALL ; par3 = FALSE ; par4 = FALSE ;
R code (references can be found in the software module):
par3 <- as.logical(par3)
par4 <- as.logical(par4)
if (par3 == 'TRUE'){
dum = xlab
xlab = ylab
ylab = dum
}
x <- t(y)
hc <- hclust(dist(x),method=par1)
d <- as.dendrogram(hc)
str(d)
mysub <- paste('Method: ',par1)
bitmap(file='test1.png')
if (par4 == 'TRUE'){
plot(d,main=main,ylab=ylab,xlab=xlab,horiz=par3, nodePar=list(pch = c(1,NA), cex=0.8, lab.cex = 0.8),type='t',center=T, sub=mysub)
} else {
plot(d,main=main,ylab=ylab,xlab=xlab,horiz=par3, nodePar=list(pch = c(1,NA), cex=0.8, lab.cex = 0.8), sub=mysub)
}
dev.off()
if (par2 != 'ALL'){
if (par3 == 'TRUE'){
ylab = 'cluster'
} else {
xlab = 'cluster'
}
par2 <- as.numeric(par2)
memb <- cutree(hc, k = par2)
cent <- NULL
for(k in 1:par2){
cent <- rbind(cent, colMeans(x[memb == k, , drop = FALSE]))
}
hc1 <- hclust(dist(cent),method=par1, members = table(memb))
de <- as.dendrogram(hc1)
bitmap(file='test2.png')
if (par4 == 'TRUE'){
plot(de,main=main,ylab=ylab,xlab=xlab,horiz=par3, nodePar=list(pch = c(1,NA), cex=0.8, lab.cex = 0.8),type='t',center=T, sub=mysub)
} else {
plot(de,main=main,ylab=ylab,xlab=xlab,horiz=par3, nodePar=list(pch = c(1,NA), cex=0.8, lab.cex = 0.8), sub=mysub)
}
dev.off()
str(de)
}
load(file='createtable')
a<-table.start()
a<-table.row.start(a)
a<-table.element(a,'Summary of Dendrogram',2,TRUE)
a<-table.row.end(a)
a<-table.row.start(a)
a<-table.element(a,'Label',header=TRUE)
a<-table.element(a,'Height',header=TRUE)
a<-table.row.end(a)
num <- length(x[,1])-1
for (i in 1:num)
{
a<-table.row.start(a)
a<-table.element(a,hc$labels[i])
a<-table.element(a,hc$height[i])
a<-table.row.end(a)
}
a<-table.end(a)
table.save(a,file='mytable1.tab')
if (par2 != 'ALL'){
a<-table.start()
a<-table.row.start(a)
a<-table.element(a,'Summary of Cut Dendrogram',2,TRUE)
a<-table.row.end(a)
a<-table.row.start(a)
a<-table.element(a,'Label',header=TRUE)
a<-table.element(a,'Height',header=TRUE)
a<-table.row.end(a)
num <- par2-1
for (i in 1:num)
{
a<-table.row.start(a)
a<-table.element(a,i)
a<-table.element(a,hc1$height[i])
a<-table.row.end(a)
}
a<-table.end(a)
table.save(a,file='mytable2.tab')
}