Free Statistics

of Irreproducible Research!

Author's title

Author*Unverified author*
R Software Modulerwasp_bidensity.wasp
Title produced by softwareBivariate Kernel Density Estimation
Date of computationThu, 13 Nov 2008 16:41:00 -0700
Cite this page as followsStatistical Computations at FreeStatistics.org, Office for Research Development and Education, URL https://freestatistics.org/blog/index.php?v=date/2008/Nov/14/t12266197092atpy097ql79a0v.htm/, Retrieved Sun, 19 May 2024 10:08:03 +0000
Statistical Computations at FreeStatistics.org, Office for Research Development and Education, URL https://freestatistics.org/blog/index.php?pk=24889, Retrieved Sun, 19 May 2024 10:08:03 +0000
QR Codes:

Original text written by user:
IsPrivate?No (this computation is public)
User-defined keywords
Estimated Impact238
Family? (F = Feedback message, R = changed R code, M = changed R Module, P = changed Parameters, D = changed Data)
-     [Bivariate Kernel Density Estimation] [] [2008-11-13 23:07:55] [108c99fc7c328084b08f3800f7874943]
F    D    [Bivariate Kernel Density Estimation] [] [2008-11-13 23:41:00] [8fe13e00c5696af38d958e9734b9d18e] [Current]
Feedback Forum
2008-11-15 18:24:08 [Hundra Smet] [reply
de plot is juist, een conclusie of interpretatie ontbrak.
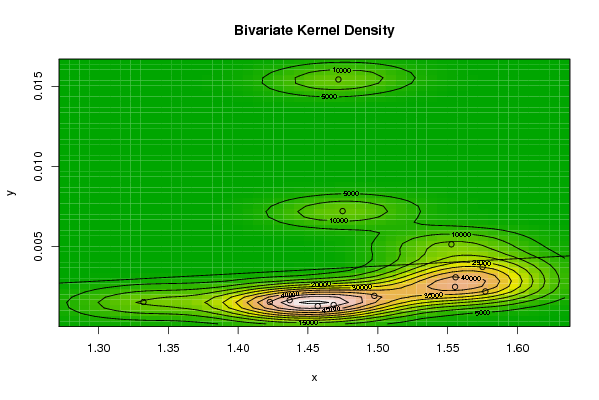
-> In de bivariate Kernel density plot worden er 3 dimensies gesuggereerd door de hoogtelijnen.
de hoogtelijnen hebben te maken met de dichtheid van de punten. wanneer deze hoog is, is de waarschijnlijkheid in het midden hoger dan die van de buitenrand.

we zien in de density plot van de student dat 2 ellipsen met een hoge dichtheid opvallen. uit de ellipsvorm kunnen we afleiden dat er tussen de totale pond en de dollar een positieve correlatie bestaat.

2 ellipsen naar de bovenkant van de plot hebben een lagere dichtheid.
2008-11-22 13:40:29 [Sandra Hofmans] [reply
Je ziet dat de punten circuleren rond de regressielijn, dit is de lijn die alle punten het best benadert. We zien hier ellipsen wat duidt op een verband. Wanneer er echter cirkels waar te nemen zijn, betekent dit dat er geen verband is.
2008-11-22 15:13:36 [c00776cbed2786c9c4960950021bd861] [reply
Hier worden 3 dimensies gesuggereerd door de hoogtelijnen. De hoogtelijnen zijn concentraties van punten.
Deze methode wordt gebruikt om scatterplots op een andere manier te bekijken.
We zien dat de hoogste concentraties van punten zich bevinden aan de regressielijn. Die 2 clusters hebben een ellipsvorm, wat kan wijzen op een eventueel verband. En dit zal dan een positief verband zijn omdat de clusters een stijgende lijn vormen.
opmerking: hier wordt weer gebruik gemaakt van datums voor variabele y?.. terwijl de student zegt dat hij de pond gaat vergelijken met de amerikaanse dollar..
2008-11-24 10:28:23 [Yannick Van Schil] [reply
Er is een juiste berekening maar geen interpretatie.
Een bivariate kernel density plot geeft 3 dimensies weer die geconstrueerd worden door hoogtelijnen. Deze hoogtelijnen kunnen elipsen vormen zoals hier ook bij de student. Als deze elipsen positief hellend zijn dan wijst dit op een positief verband tussen de variabeln

Post a new message
Dataseries X:
1.3322
1.4369
1.4975
1.577
1.5553
1.5557
1.575
1.5527
1.4748
1.4718
1.457
1.4684
1.4227
Dataseries Y:
31/10/2008
30/09/2008
31/08/2008
31/07/2008
30/06/2008
31/05/2008
30/04/2008
31/03/2008
29/02/2008
31/01/2008
31/12/2007
30/11/2007
31/10/2007


Summary of computational transaction
Raw Inputview raw input (R code)
Raw Outputview raw output of R engine
Computing time3 seconds
R Server'Herman Ole Andreas Wold' @ 193.190.124.10:1001

\begin{tabular}{lllllllll}
\hline
Summary of computational transaction \tabularnewline
Raw Input & view raw input (R code)  \tabularnewline
Raw Output & view raw output of R engine  \tabularnewline
Computing time & 3 seconds \tabularnewline
R Server & 'Herman Ole Andreas Wold' @ 193.190.124.10:1001 \tabularnewline
\hline
\end{tabular}
%Source: https://freestatistics.org/blog/index.php?pk=24889&T=0

[TABLE]
[ROW][C]Summary of computational transaction[/C][/ROW]
[ROW][C]Raw Input[/C][C]view raw input (R code) [/C][/ROW]
[ROW][C]Raw Output[/C][C]view raw output of R engine [/C][/ROW]
[ROW][C]Computing time[/C][C]3 seconds[/C][/ROW]
[ROW][C]R Server[/C][C]'Herman Ole Andreas Wold' @ 193.190.124.10:1001[/C][/ROW]
[/TABLE]
Source: https://freestatistics.org/blog/index.php?pk=24889&T=0

Globally Unique Identifier (entire table): ba.freestatistics.org/blog/index.php?pk=24889&T=0

As an alternative you can also use a QR Code:  

The GUIDs for individual cells are displayed in the table below:

Summary of computational transaction
Raw Inputview raw input (R code)
Raw Outputview raw output of R engine
Computing time3 seconds
R Server'Herman Ole Andreas Wold' @ 193.190.124.10:1001


Bandwidth
x axis0.0378518727403748
y axis0.000738428438015644
Correlation
correlation used in KDE0.0852499536959712
correlation(x,y)0.0852499536959712

\begin{tabular}{lllllllll}
\hline
Bandwidth \tabularnewline
x axis & 0.0378518727403748 \tabularnewline
y axis & 0.000738428438015644 \tabularnewline
Correlation \tabularnewline
correlation used in KDE & 0.0852499536959712 \tabularnewline
correlation(x,y) & 0.0852499536959712 \tabularnewline
\hline
\end{tabular}
%Source: https://freestatistics.org/blog/index.php?pk=24889&T=1

[TABLE]
[ROW][C]Bandwidth[/C][/ROW]
[ROW][C]x axis[/C][C]0.0378518727403748[/C][/ROW]
[ROW][C]y axis[/C][C]0.000738428438015644[/C][/ROW]
[ROW][C]Correlation[/C][/ROW]
[ROW][C]correlation used in KDE[/C][C]0.0852499536959712[/C][/ROW]
[ROW][C]correlation(x,y)[/C][C]0.0852499536959712[/C][/ROW]
[/TABLE]
Source: https://freestatistics.org/blog/index.php?pk=24889&T=1

Globally Unique Identifier (entire table): ba.freestatistics.org/blog/index.php?pk=24889&T=1

As an alternative you can also use a QR Code:  

The GUIDs for individual cells are displayed in the table below:

Bandwidth
x axis0.0378518727403748
y axis0.000738428438015644
Correlation
correlation used in KDE0.0852499536959712
correlation(x,y)0.0852499536959712


Parameters (Session):
par1 = 50 ; par2 = 50 ; par3 = 0 ; par4 = 0 ; par5 = 0 ; par6 = Y ; par7 = Y ;
Parameters (R input):
par1 = 50 ; par2 = 50 ; par3 = 0 ; par4 = 0 ; par5 = 0 ; par6 = Y ; par7 = Y ;
R code (references can be found in the software module):
par1 <- as(par1,'numeric')
par2 <- as(par2,'numeric')
par3 <- as(par3,'numeric')
par4 <- as(par4,'numeric')
par5 <- as(par5,'numeric')
library('GenKern')
if (par3==0) par3 <- dpik(x)
if (par4==0) par4 <- dpik(y)
if (par5==0) par5 <- cor(x,y)
if (par1 > 500) par1 <- 500
if (par2 > 500) par2 <- 500
bitmap(file='bidensity.png')
op <- KernSur(x,y, xgridsize=par1, ygridsize=par2, correlation=par5, xbandwidth=par3, ybandwidth=par4)
image(op$xords, op$yords, op$zden, col=terrain.colors(100), axes=TRUE,main=main,xlab=xlab,ylab=ylab)
if (par6=='Y') contour(op$xords, op$yords, op$zden, add=TRUE)
if (par7=='Y') points(x,y)
(r<-lm(y ~ x))
abline(r)
box()
dev.off()
load(file='createtable')
a<-table.start()
a<-table.row.start(a)
a<-table.element(a,'Bandwidth',2,TRUE)
a<-table.row.end(a)
a<-table.row.start(a)
a<-table.element(a,'x axis',header=TRUE)
a<-table.element(a,par3)
a<-table.row.end(a)
a<-table.row.start(a)
a<-table.element(a,'y axis',header=TRUE)
a<-table.element(a,par4)
a<-table.row.end(a)
a<-table.row.start(a)
a<-table.element(a,'Correlation',2,TRUE)
a<-table.row.end(a)
a<-table.row.start(a)
a<-table.element(a,'correlation used in KDE',header=TRUE)
a<-table.element(a,par5)
a<-table.row.end(a)
a<-table.row.start(a)
a<-table.element(a,'correlation(x,y)',header=TRUE)
a<-table.element(a,cor(x,y))
a<-table.row.end(a)
a<-table.end(a)
table.save(a,file='mytable.tab')