Free Statistics

of Irreproducible Research!

Author's title

Author*The author of this computation has been verified*
R Software Modulerwasp_boxcoxnorm.wasp
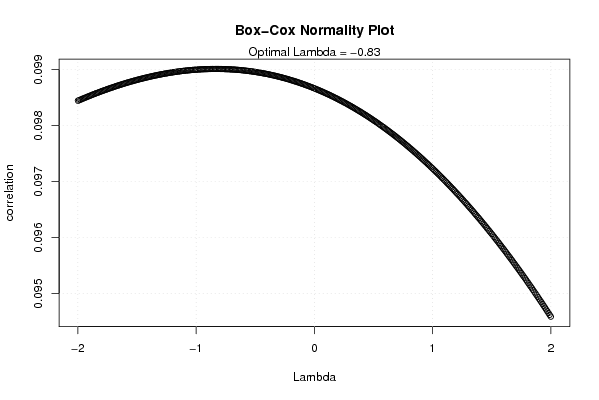
Title produced by softwareBox-Cox Normality Plot
Date of computationThu, 13 Nov 2008 15:07:15 -0700
Cite this page as followsStatistical Computations at FreeStatistics.org, Office for Research Development and Education, URL https://freestatistics.org/blog/index.php?v=date/2008/Nov/13/t1226614087psxfd3n75l3oo43.htm/, Retrieved Sun, 19 May 2024 10:21:54 +0000
Statistical Computations at FreeStatistics.org, Office for Research Development and Education, URL https://freestatistics.org/blog/index.php?pk=24863, Retrieved Sun, 19 May 2024 10:21:54 +0000
QR Codes:

Original text written by user:
IsPrivate?No (this computation is public)
User-defined keywordsJonas Scheltjens
Estimated Impact158
Family? (F = Feedback message, R = changed R code, M = changed R Module, P = changed Parameters, D = changed Data)
F       [Box-Cox Normality Plot] [Various EDA topic...] [2008-11-13 22:07:15] [f4960a11bac8b7f1cb71c83b5826d5bd] [Current]
Feedback Forum
2008-11-16 14:57:50 [074508d5a5a3592082de3e836d27af7d] [reply
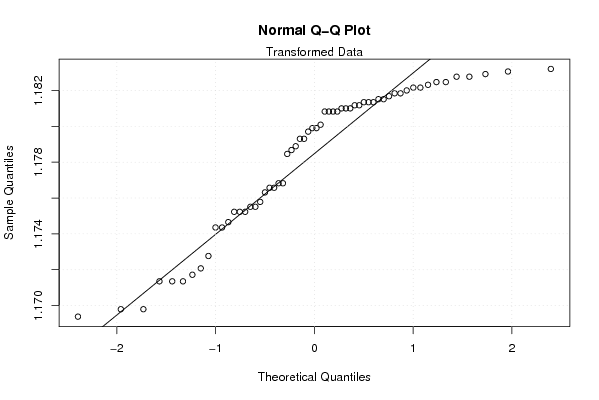
Ik denk dat dit niets te maken heeft met een daling. Dit wil zeggen dat de correlatie zijn maximum nog niet bereikt heeft, want dan zou ze een mooi symmetrisch verloop vertonen (zoals bij een normaal verdeling).
2008-11-23 15:44:16 [Alexander Hendrickx] [reply
We gebruiken de box cox normality plot om een transformatie in de richting van een normaalverdeling te krijgen. De kromme vorm van de curve doet vermoeden dat er zich geen verbetering in naar de normaalverdeling toe heeft plaatsgevonden.

Post a new message
Dataseries X:
93
87
89
91
108
124
104
107
116
70
126
119
102
88
71
76
84
125
122
93
117
71
118
115
101
106
79
77
85
124
115
115
114
75
114
121
113
104
84
113
120
127
92
113
112
75
120
122
116
88
87
107
112
92
112
87
112
75
100
118


Summary of computational transaction
Raw Inputview raw input (R code)
Raw Outputview raw output of R engine
Computing time3 seconds
R Server'Gwilym Jenkins' @ 72.249.127.135

\begin{tabular}{lllllllll}
\hline
Summary of computational transaction \tabularnewline
Raw Input & view raw input (R code)  \tabularnewline
Raw Output & view raw output of R engine  \tabularnewline
Computing time & 3 seconds \tabularnewline
R Server & 'Gwilym Jenkins' @ 72.249.127.135 \tabularnewline
\hline
\end{tabular}
%Source: https://freestatistics.org/blog/index.php?pk=24863&T=0

[TABLE]
[ROW][C]Summary of computational transaction[/C][/ROW]
[ROW][C]Raw Input[/C][C]view raw input (R code) [/C][/ROW]
[ROW][C]Raw Output[/C][C]view raw output of R engine [/C][/ROW]
[ROW][C]Computing time[/C][C]3 seconds[/C][/ROW]
[ROW][C]R Server[/C][C]'Gwilym Jenkins' @ 72.249.127.135[/C][/ROW]
[/TABLE]
Source: https://freestatistics.org/blog/index.php?pk=24863&T=0

Globally Unique Identifier (entire table): ba.freestatistics.org/blog/index.php?pk=24863&T=0

As an alternative you can also use a QR Code:  

The GUIDs for individual cells are displayed in the table below:

Summary of computational transaction
Raw Inputview raw input (R code)
Raw Outputview raw output of R engine
Computing time3 seconds
R Server'Gwilym Jenkins' @ 72.249.127.135


Box-Cox Normality Plot
# observations x60
maximum correlation0.099012144668132
optimal lambda-0.83

\begin{tabular}{lllllllll}
\hline
Box-Cox Normality Plot \tabularnewline
# observations x & 60 \tabularnewline
maximum correlation & 0.099012144668132 \tabularnewline
optimal lambda & -0.83 \tabularnewline
\hline
\end{tabular}
%Source: https://freestatistics.org/blog/index.php?pk=24863&T=1

[TABLE]
[ROW][C]Box-Cox Normality Plot[/C][/ROW]
[ROW][C]# observations x[/C][C]60[/C][/ROW]
[ROW][C]maximum correlation[/C][C]0.099012144668132[/C][/ROW]
[ROW][C]optimal lambda[/C][C]-0.83[/C][/ROW]
[/TABLE]
Source: https://freestatistics.org/blog/index.php?pk=24863&T=1

Globally Unique Identifier (entire table): ba.freestatistics.org/blog/index.php?pk=24863&T=1

As an alternative you can also use a QR Code:  

The GUIDs for individual cells are displayed in the table below:

Box-Cox Normality Plot
# observations x60
maximum correlation0.099012144668132
optimal lambda-0.83


Parameters (Session):
Parameters (R input):
R code (references can be found in the software module):
n <- length(x)
c <- array(NA,dim=c(401))
l <- array(NA,dim=c(401))
mx <- 0
mxli <- -999
for (i in 1:401)
{
l[i] <- (i-201)/100
if (l[i] != 0)
{
x1 <- (x^l[i] - 1) / l[i]
} else {
x1 <- log(x)
}
c[i] <- cor(qnorm(ppoints(x), mean=0, sd=1),x1)
if (mx < c[i])
{
mx <- c[i]
mxli <- l[i]
}
}
c
mx
mxli
if (mxli != 0)
{
x1 <- (x^mxli - 1) / mxli
} else {
x1 <- log(x)
}
bitmap(file='test1.png')
plot(l,c,main='Box-Cox Normality Plot',xlab='Lambda',ylab='correlation')
mtext(paste('Optimal Lambda =',mxli))
grid()
dev.off()
bitmap(file='test2.png')
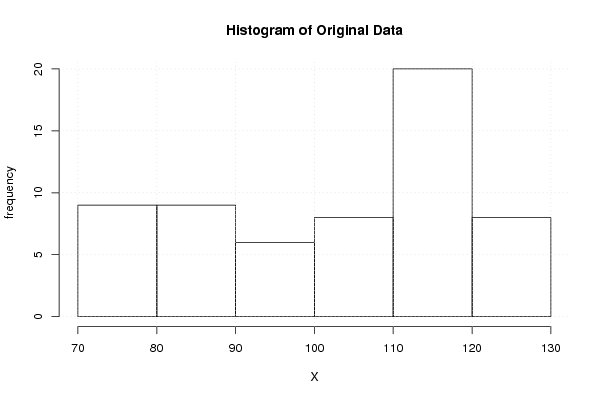
hist(x,main='Histogram of Original Data',xlab='X',ylab='frequency')
grid()
dev.off()
bitmap(file='test3.png')
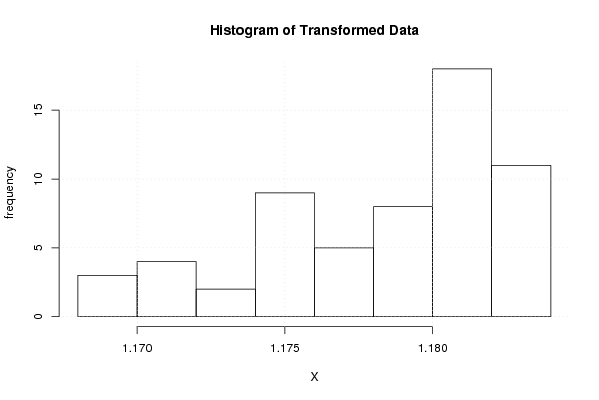
hist(x1,main='Histogram of Transformed Data',xlab='X',ylab='frequency')
grid()
dev.off()
bitmap(file='test4.png')
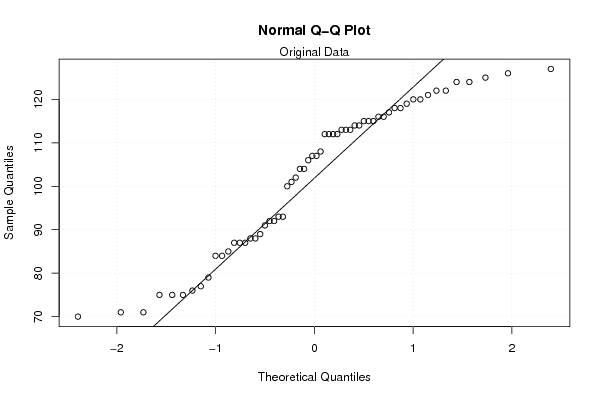
qqnorm(x)
qqline(x)
grid()
mtext('Original Data')
dev.off()
bitmap(file='test5.png')
qqnorm(x1)
qqline(x1)
grid()
mtext('Transformed Data')
dev.off()
load(file='createtable')
a<-table.start()
a<-table.row.start(a)
a<-table.element(a,'Box-Cox Normality Plot',2,TRUE)
a<-table.row.end(a)
a<-table.row.start(a)
a<-table.element(a,'# observations x',header=TRUE)
a<-table.element(a,n)
a<-table.row.end(a)
a<-table.row.start(a)
a<-table.element(a,'maximum correlation',header=TRUE)
a<-table.element(a,mx)
a<-table.row.end(a)
a<-table.row.start(a)
a<-table.element(a,'optimal lambda',header=TRUE)
a<-table.element(a,mxli)
a<-table.row.end(a)
a<-table.end(a)
table.save(a,file='mytable.tab')