Free Statistics

of Irreproducible Research!

Author's title

Author*The author of this computation has been verified*
R Software Modulerwasp_hierarchicalclustering.wasp
Title produced by softwareHierarchical Clustering
Date of computationThu, 13 Nov 2008 14:35:53 -0700
Cite this page as followsStatistical Computations at FreeStatistics.org, Office for Research Development and Education, URL https://freestatistics.org/blog/index.php?v=date/2008/Nov/13/t1226612290t12sui3qrawztl5.htm/, Retrieved Sun, 19 May 2024 12:02:34 +0000
Statistical Computations at FreeStatistics.org, Office for Research Development and Education, URL https://freestatistics.org/blog/index.php?pk=24846, Retrieved Sun, 19 May 2024 12:02:34 +0000
QR Codes:

Original text written by user:
IsPrivate?No (this computation is public)
User-defined keywordsJonas Scheltjens
Estimated Impact127
Family? (F = Feedback message, R = changed R code, M = changed R Module, P = changed Parameters, D = changed Data)
F       [Hierarchical Clustering] [Various EDA topic...] [2008-11-13 21:35:53] [f4960a11bac8b7f1cb71c83b5826d5bd] [Current]
Feedback Forum
2008-11-16 15:09:53 [074508d5a5a3592082de3e836d27af7d] [reply
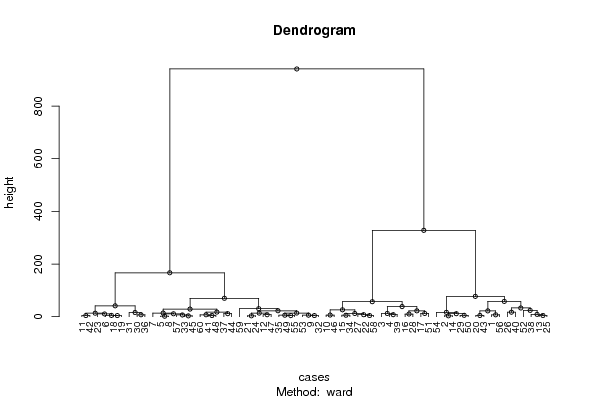
juist dendrogram, maar te weining uitleg. Het nut van een dendrogram is dat we kunnen zien welke gegevens in 1 groep zitten en welke we dus anders moeten behandelen.
2008-11-23 15:30:50 [Alexander Hendrickx] [reply
Er valt inderdaad weinig op te maken uit de dendogram.

Post a new message
Dataseries X:
8	-7	-6
-10	-13	-17
-24	-11	-44
-19	-9	-36
8	8	4
24	24	29
14	4	8
7	7	3
9	16	8
-26	-30	-49
19	26	32
15	19	25
-1	2	-1
-10	-12	-20
-21	-29	-34
-14	-24	-31
-27	-16	-12
26	25	25
23	22	25
5	-7	7
19	17	13
-19	-29	-40
24	18	32
17	15	14
1	1	-5
-9	6	-14
-16	-21	-42
-21	-23	-24
-14	-15	-11
31	24	20
27	15	7
10	15	12
12	14	4
-23	-25	-37
13	14	19
26	21	16
-1	13	2
4	4	-9
-16	-16	-36
-5	13	-29
9	20	3
23	27	33
9	-8	9
2	13	13
10	12	3
-29	-25	-47
17	20	18
9	22	7
9	16	16
-10	-12	-12
-23	-13	-23
13	7	-18
13	12	11
-9	-8	-4
9	12	17
5	-13	-4
8	12	-1
-18	-25	-41
7	0	26
4	18	3


Summary of computational transaction
Raw Inputview raw input (R code)
Raw Outputview raw output of R engine
Computing time1 seconds
R Server'George Udny Yule' @ 72.249.76.132

\begin{tabular}{lllllllll}
\hline
Summary of computational transaction \tabularnewline
Raw Input & view raw input (R code)  \tabularnewline
Raw Output & view raw output of R engine  \tabularnewline
Computing time & 1 seconds \tabularnewline
R Server & 'George Udny Yule' @ 72.249.76.132 \tabularnewline
\hline
\end{tabular}
%Source: https://freestatistics.org/blog/index.php?pk=24846&T=0

[TABLE]
[ROW][C]Summary of computational transaction[/C][/ROW]
[ROW][C]Raw Input[/C][C]view raw input (R code) [/C][/ROW]
[ROW][C]Raw Output[/C][C]view raw output of R engine [/C][/ROW]
[ROW][C]Computing time[/C][C]1 seconds[/C][/ROW]
[ROW][C]R Server[/C][C]'George Udny Yule' @ 72.249.76.132[/C][/ROW]
[/TABLE]
Source: https://freestatistics.org/blog/index.php?pk=24846&T=0

Globally Unique Identifier (entire table): ba.freestatistics.org/blog/index.php?pk=24846&T=0

As an alternative you can also use a QR Code:  

The GUIDs for individual cells are displayed in the table below:

Summary of computational transaction
Raw Inputview raw input (R code)
Raw Outputview raw output of R engine
Computing time1 seconds
R Server'George Udny Yule' @ 72.249.76.132


Summary of Dendrogram
LabelHeight
11.73205080756888
23
33
43.16227766016838
54.12310562561766
64.24264068711928
74.24264068711928
84.24264068711928
94.24264068711928
104.47213595499958
114.58257569495584
124.58257569495584
134.69588736423469
145.09901951359278
155.3851648071345
165.48172765326135
175.76046855827592
186.16441400296898
196.4535599249993
207
217.07106781186548
227.13262084327031
237.34846922834953
247.49081315919221
257.61577310586391
268.78887653890689
279.9498743710662
2810.2312416249102
2910.8468451912246
3011.3083336271833
3111.4017542509914
3211.9112311450360
3312.0830459735946
3412.1367207232760
3513.1038723559249
3613.4498297869780
3713.6651476105399
3813.7194335193147
3915.7578353437117
4016.3170691166258
4117.0293863659264
4217.3389407039620
4321.9234741874105
4422.0141990079642
4522.3966541889198
4623.8278459936162
4726.0093030634111
4828.8107034727402
4930.3119990427042
5032.9367756335492
5138.2704933646133
5241.2117988278412
5356.8306799024851
5457.9446486426321
5569.7680669850267
5677.0245219960672
57166.680399988993
58328.024290680700
59941.16651422093

\begin{tabular}{lllllllll}
\hline
Summary of Dendrogram \tabularnewline
Label & Height \tabularnewline
1 & 1.73205080756888 \tabularnewline
2 & 3 \tabularnewline
3 & 3 \tabularnewline
4 & 3.16227766016838 \tabularnewline
5 & 4.12310562561766 \tabularnewline
6 & 4.24264068711928 \tabularnewline
7 & 4.24264068711928 \tabularnewline
8 & 4.24264068711928 \tabularnewline
9 & 4.24264068711928 \tabularnewline
10 & 4.47213595499958 \tabularnewline
11 & 4.58257569495584 \tabularnewline
12 & 4.58257569495584 \tabularnewline
13 & 4.69588736423469 \tabularnewline
14 & 5.09901951359278 \tabularnewline
15 & 5.3851648071345 \tabularnewline
16 & 5.48172765326135 \tabularnewline
17 & 5.76046855827592 \tabularnewline
18 & 6.16441400296898 \tabularnewline
19 & 6.4535599249993 \tabularnewline
20 & 7 \tabularnewline
21 & 7.07106781186548 \tabularnewline
22 & 7.13262084327031 \tabularnewline
23 & 7.34846922834953 \tabularnewline
24 & 7.49081315919221 \tabularnewline
25 & 7.61577310586391 \tabularnewline
26 & 8.78887653890689 \tabularnewline
27 & 9.9498743710662 \tabularnewline
28 & 10.2312416249102 \tabularnewline
29 & 10.8468451912246 \tabularnewline
30 & 11.3083336271833 \tabularnewline
31 & 11.4017542509914 \tabularnewline
32 & 11.9112311450360 \tabularnewline
33 & 12.0830459735946 \tabularnewline
34 & 12.1367207232760 \tabularnewline
35 & 13.1038723559249 \tabularnewline
36 & 13.4498297869780 \tabularnewline
37 & 13.6651476105399 \tabularnewline
38 & 13.7194335193147 \tabularnewline
39 & 15.7578353437117 \tabularnewline
40 & 16.3170691166258 \tabularnewline
41 & 17.0293863659264 \tabularnewline
42 & 17.3389407039620 \tabularnewline
43 & 21.9234741874105 \tabularnewline
44 & 22.0141990079642 \tabularnewline
45 & 22.3966541889198 \tabularnewline
46 & 23.8278459936162 \tabularnewline
47 & 26.0093030634111 \tabularnewline
48 & 28.8107034727402 \tabularnewline
49 & 30.3119990427042 \tabularnewline
50 & 32.9367756335492 \tabularnewline
51 & 38.2704933646133 \tabularnewline
52 & 41.2117988278412 \tabularnewline
53 & 56.8306799024851 \tabularnewline
54 & 57.9446486426321 \tabularnewline
55 & 69.7680669850267 \tabularnewline
56 & 77.0245219960672 \tabularnewline
57 & 166.680399988993 \tabularnewline
58 & 328.024290680700 \tabularnewline
59 & 941.16651422093 \tabularnewline
\hline
\end{tabular}
%Source: https://freestatistics.org/blog/index.php?pk=24846&T=1

[TABLE]
[ROW][C]Summary of Dendrogram[/C][/ROW]
[ROW][C]Label[/C][C]Height[/C][/ROW]
[ROW][C]1[/C][C]1.73205080756888[/C][/ROW]
[ROW][C]2[/C][C]3[/C][/ROW]
[ROW][C]3[/C][C]3[/C][/ROW]
[ROW][C]4[/C][C]3.16227766016838[/C][/ROW]
[ROW][C]5[/C][C]4.12310562561766[/C][/ROW]
[ROW][C]6[/C][C]4.24264068711928[/C][/ROW]
[ROW][C]7[/C][C]4.24264068711928[/C][/ROW]
[ROW][C]8[/C][C]4.24264068711928[/C][/ROW]
[ROW][C]9[/C][C]4.24264068711928[/C][/ROW]
[ROW][C]10[/C][C]4.47213595499958[/C][/ROW]
[ROW][C]11[/C][C]4.58257569495584[/C][/ROW]
[ROW][C]12[/C][C]4.58257569495584[/C][/ROW]
[ROW][C]13[/C][C]4.69588736423469[/C][/ROW]
[ROW][C]14[/C][C]5.09901951359278[/C][/ROW]
[ROW][C]15[/C][C]5.3851648071345[/C][/ROW]
[ROW][C]16[/C][C]5.48172765326135[/C][/ROW]
[ROW][C]17[/C][C]5.76046855827592[/C][/ROW]
[ROW][C]18[/C][C]6.16441400296898[/C][/ROW]
[ROW][C]19[/C][C]6.4535599249993[/C][/ROW]
[ROW][C]20[/C][C]7[/C][/ROW]
[ROW][C]21[/C][C]7.07106781186548[/C][/ROW]
[ROW][C]22[/C][C]7.13262084327031[/C][/ROW]
[ROW][C]23[/C][C]7.34846922834953[/C][/ROW]
[ROW][C]24[/C][C]7.49081315919221[/C][/ROW]
[ROW][C]25[/C][C]7.61577310586391[/C][/ROW]
[ROW][C]26[/C][C]8.78887653890689[/C][/ROW]
[ROW][C]27[/C][C]9.9498743710662[/C][/ROW]
[ROW][C]28[/C][C]10.2312416249102[/C][/ROW]
[ROW][C]29[/C][C]10.8468451912246[/C][/ROW]
[ROW][C]30[/C][C]11.3083336271833[/C][/ROW]
[ROW][C]31[/C][C]11.4017542509914[/C][/ROW]
[ROW][C]32[/C][C]11.9112311450360[/C][/ROW]
[ROW][C]33[/C][C]12.0830459735946[/C][/ROW]
[ROW][C]34[/C][C]12.1367207232760[/C][/ROW]
[ROW][C]35[/C][C]13.1038723559249[/C][/ROW]
[ROW][C]36[/C][C]13.4498297869780[/C][/ROW]
[ROW][C]37[/C][C]13.6651476105399[/C][/ROW]
[ROW][C]38[/C][C]13.7194335193147[/C][/ROW]
[ROW][C]39[/C][C]15.7578353437117[/C][/ROW]
[ROW][C]40[/C][C]16.3170691166258[/C][/ROW]
[ROW][C]41[/C][C]17.0293863659264[/C][/ROW]
[ROW][C]42[/C][C]17.3389407039620[/C][/ROW]
[ROW][C]43[/C][C]21.9234741874105[/C][/ROW]
[ROW][C]44[/C][C]22.0141990079642[/C][/ROW]
[ROW][C]45[/C][C]22.3966541889198[/C][/ROW]
[ROW][C]46[/C][C]23.8278459936162[/C][/ROW]
[ROW][C]47[/C][C]26.0093030634111[/C][/ROW]
[ROW][C]48[/C][C]28.8107034727402[/C][/ROW]
[ROW][C]49[/C][C]30.3119990427042[/C][/ROW]
[ROW][C]50[/C][C]32.9367756335492[/C][/ROW]
[ROW][C]51[/C][C]38.2704933646133[/C][/ROW]
[ROW][C]52[/C][C]41.2117988278412[/C][/ROW]
[ROW][C]53[/C][C]56.8306799024851[/C][/ROW]
[ROW][C]54[/C][C]57.9446486426321[/C][/ROW]
[ROW][C]55[/C][C]69.7680669850267[/C][/ROW]
[ROW][C]56[/C][C]77.0245219960672[/C][/ROW]
[ROW][C]57[/C][C]166.680399988993[/C][/ROW]
[ROW][C]58[/C][C]328.024290680700[/C][/ROW]
[ROW][C]59[/C][C]941.16651422093[/C][/ROW]
[/TABLE]
Source: https://freestatistics.org/blog/index.php?pk=24846&T=1

Globally Unique Identifier (entire table): ba.freestatistics.org/blog/index.php?pk=24846&T=1

As an alternative you can also use a QR Code:  

The GUIDs for individual cells are displayed in the table below:

Summary of Dendrogram
LabelHeight
11.73205080756888
23
33
43.16227766016838
54.12310562561766
64.24264068711928
74.24264068711928
84.24264068711928
94.24264068711928
104.47213595499958
114.58257569495584
124.58257569495584
134.69588736423469
145.09901951359278
155.3851648071345
165.48172765326135
175.76046855827592
186.16441400296898
196.4535599249993
207
217.07106781186548
227.13262084327031
237.34846922834953
247.49081315919221
257.61577310586391
268.78887653890689
279.9498743710662
2810.2312416249102
2910.8468451912246
3011.3083336271833
3111.4017542509914
3211.9112311450360
3312.0830459735946
3412.1367207232760
3513.1038723559249
3613.4498297869780
3713.6651476105399
3813.7194335193147
3915.7578353437117
4016.3170691166258
4117.0293863659264
4217.3389407039620
4321.9234741874105
4422.0141990079642
4522.3966541889198
4623.8278459936162
4726.0093030634111
4828.8107034727402
4930.3119990427042
5032.9367756335492
5138.2704933646133
5241.2117988278412
5356.8306799024851
5457.9446486426321
5569.7680669850267
5677.0245219960672
57166.680399988993
58328.024290680700
59941.16651422093


Parameters (Session):
par1 = ward ; par2 = ALL ; par3 = FALSE ; par4 = FALSE ;
Parameters (R input):
par1 = ward ; par2 = ALL ; par3 = FALSE ; par4 = FALSE ;
R code (references can be found in the software module):
par3 <- as.logical(par3)
par4 <- as.logical(par4)
if (par3 == 'TRUE'){
dum = xlab
xlab = ylab
ylab = dum
}
x <- t(y)
hc <- hclust(dist(x),method=par1)
d <- as.dendrogram(hc)
str(d)
mysub <- paste('Method: ',par1)
bitmap(file='test1.png')
if (par4 == 'TRUE'){
plot(d,main=main,ylab=ylab,xlab=xlab,horiz=par3, nodePar=list(pch = c(1,NA), cex=0.8, lab.cex = 0.8),type='t',center=T, sub=mysub)
} else {
plot(d,main=main,ylab=ylab,xlab=xlab,horiz=par3, nodePar=list(pch = c(1,NA), cex=0.8, lab.cex = 0.8), sub=mysub)
}
dev.off()
if (par2 != 'ALL'){
if (par3 == 'TRUE'){
ylab = 'cluster'
} else {
xlab = 'cluster'
}
par2 <- as.numeric(par2)
memb <- cutree(hc, k = par2)
cent <- NULL
for(k in 1:par2){
cent <- rbind(cent, colMeans(x[memb == k, , drop = FALSE]))
}
hc1 <- hclust(dist(cent),method=par1, members = table(memb))
de <- as.dendrogram(hc1)
bitmap(file='test2.png')
if (par4 == 'TRUE'){
plot(de,main=main,ylab=ylab,xlab=xlab,horiz=par3, nodePar=list(pch = c(1,NA), cex=0.8, lab.cex = 0.8),type='t',center=T, sub=mysub)
} else {
plot(de,main=main,ylab=ylab,xlab=xlab,horiz=par3, nodePar=list(pch = c(1,NA), cex=0.8, lab.cex = 0.8), sub=mysub)
}
dev.off()
str(de)
}
load(file='createtable')
a<-table.start()
a<-table.row.start(a)
a<-table.element(a,'Summary of Dendrogram',2,TRUE)
a<-table.row.end(a)
a<-table.row.start(a)
a<-table.element(a,'Label',header=TRUE)
a<-table.element(a,'Height',header=TRUE)
a<-table.row.end(a)
num <- length(x[,1])-1
for (i in 1:num)
{
a<-table.row.start(a)
a<-table.element(a,hc$labels[i])
a<-table.element(a,hc$height[i])
a<-table.row.end(a)
}
a<-table.end(a)
table.save(a,file='mytable1.tab')
if (par2 != 'ALL'){
a<-table.start()
a<-table.row.start(a)
a<-table.element(a,'Summary of Cut Dendrogram',2,TRUE)
a<-table.row.end(a)
a<-table.row.start(a)
a<-table.element(a,'Label',header=TRUE)
a<-table.element(a,'Height',header=TRUE)
a<-table.row.end(a)
num <- par2-1
for (i in 1:num)
{
a<-table.row.start(a)
a<-table.element(a,i)
a<-table.element(a,hc1$height[i])
a<-table.row.end(a)
}
a<-table.end(a)
table.save(a,file='mytable2.tab')
}