Free Statistics

of Irreproducible Research!

Author's title

Author*The author of this computation has been verified*
R Software Modulerwasp_boxcoxlin.wasp
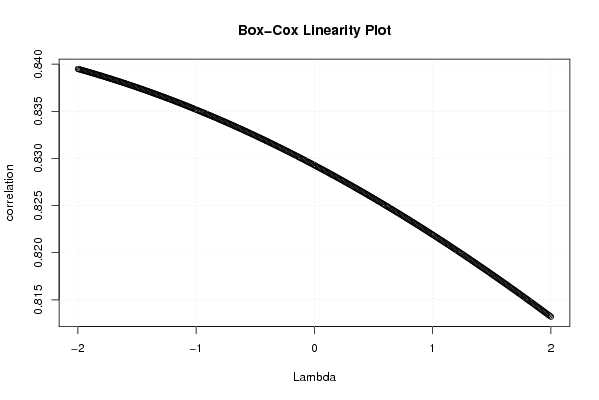
Title produced by softwareBox-Cox Linearity Plot
Date of computationThu, 13 Nov 2008 13:09:04 -0700
Cite this page as followsStatistical Computations at FreeStatistics.org, Office for Research Development and Education, URL https://freestatistics.org/blog/index.php?v=date/2008/Nov/13/t1226606983xbr72y2ish2cbhs.htm/, Retrieved Sun, 19 May 2024 10:05:59 +0000
Statistical Computations at FreeStatistics.org, Office for Research Development and Education, URL https://freestatistics.org/blog/index.php?pk=24816, Retrieved Sun, 19 May 2024 10:05:59 +0000
QR Codes:

Original text written by user:
IsPrivate?No (this computation is public)
User-defined keywords
Estimated Impact151
Family? (F = Feedback message, R = changed R code, M = changed R Module, P = changed Parameters, D = changed Data)
F       [Box-Cox Linearity Plot] [Box cox transform...] [2008-11-13 20:09:04] [5bd06487453d0eec7a1bf04bf9f25085] [Current]
Feedback Forum
2008-11-20 15:56:07 [Gert-Jan Geudens] [reply
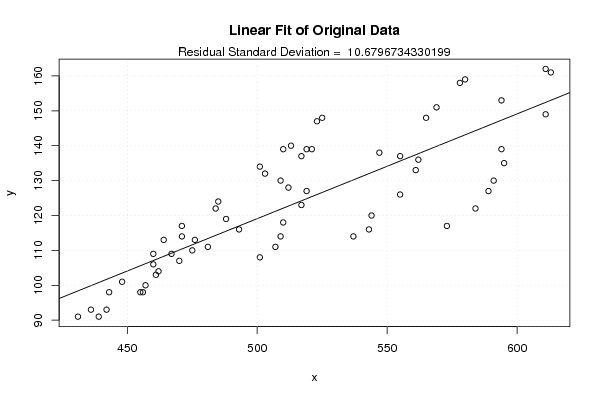
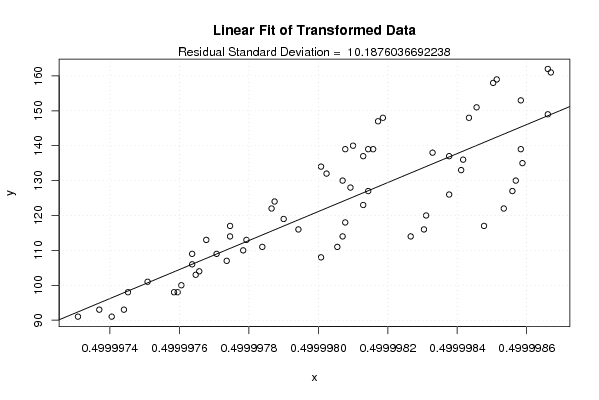
De conclusie is niet gegeven. We willen de gegevens lineair transformeren door een lambda toe te voegen. De optimale lambda (met dus de hoogste correlatie) is hier gelijk aan -2. De transformatie heeft hier echter weinig zin aangezien de correlatie slecht een beetje stijgt van 0.810 naar 0.840. Dat er weinig veranderd is kunnen we ook afleiden aan de scatterplots. Het lineair verband is slechts weinig verbeterd. Dit kan mogelijk te maken hebben met het feit dat oorspronkelijk, de correlatie tussen beide variabelen reeds redelijk hoog was.

Je kan deze berekening ook nog toepassen op de andere variabelen.
2008-11-20 21:16:43 [Gilliam Schoorel] [reply
De box cox transformatie zorgt voor een betere fit. Indien het maximum niet bekomen wordt na de transformatie heeft de transformatie niet veel zin. De correlatie stijgt hier slechts een klein beetje en heeft dus niet zoveel zin. De lineair fit correlatie grafieken geven dit ook heel duidelijk weer. Er is AMPER iets veranderd in de correlatie op de transformed fit grafiek. De maximale lambda die men kan bereiken is hier -2 (als ze oplopend naar de rechter kant is, is dit 2). Je kan bijvoorbeeld ook kijken naar het verloop van de lijn. Als de lijn vanboven voldoende buigt (en terug naar beneden deint te lopen) duidt dit erop dat het maximaal bereikt is.
2008-11-24 18:04:08 [Jan De Vleeschauwer] [reply
Kan het niet lezen!

Post a new message
Dataseries X:
493
481
462
457
442
439
488
521
501
485
464
460
467
460
448
443
436
431
484
510
513
503
471
471
476
475
470
461
455
456
517
525
523
519
509
512
519
517
510
509
501
507
569
580
578
565
547
555
562
561
555
544
537
543
594
611
613
611
594
595
591
589
584
573
Dataseries Y:
116
111
104
100
93
91
119
139
134
124
113
109
109
106
101
98
93
91
122
139
140
132
117
114
113
110
107
103
98
98
137
148
147
139
130
128
127
123
118
114
108
111
151
159
158
148
138
137
136
133
126
120
114
116
153
162
161
149
139
135
130
127
122
117


Summary of computational transaction
Raw Inputview raw input (R code)
Raw Outputview raw output of R engine
Computing time2 seconds
R Server'George Udny Yule' @ 72.249.76.132

\begin{tabular}{lllllllll}
\hline
Summary of computational transaction \tabularnewline
Raw Input & view raw input (R code)  \tabularnewline
Raw Output & view raw output of R engine  \tabularnewline
Computing time & 2 seconds \tabularnewline
R Server & 'George Udny Yule' @ 72.249.76.132 \tabularnewline
\hline
\end{tabular}
%Source: https://freestatistics.org/blog/index.php?pk=24816&T=0

[TABLE]
[ROW][C]Summary of computational transaction[/C][/ROW]
[ROW][C]Raw Input[/C][C]view raw input (R code) [/C][/ROW]
[ROW][C]Raw Output[/C][C]view raw output of R engine [/C][/ROW]
[ROW][C]Computing time[/C][C]2 seconds[/C][/ROW]
[ROW][C]R Server[/C][C]'George Udny Yule' @ 72.249.76.132[/C][/ROW]
[/TABLE]
Source: https://freestatistics.org/blog/index.php?pk=24816&T=0

Globally Unique Identifier (entire table): ba.freestatistics.org/blog/index.php?pk=24816&T=0

As an alternative you can also use a QR Code:  

The GUIDs for individual cells are displayed in the table below:

Summary of computational transaction
Raw Inputview raw input (R code)
Raw Outputview raw output of R engine
Computing time2 seconds
R Server'George Udny Yule' @ 72.249.76.132


Box-Cox Linearity Plot
# observations x64
maximum correlation0.839494001918864
optimal lambda(x)-2
Residual SD (orginial)10.6796734330199
Residual SD (transformed)10.1876036692238

\begin{tabular}{lllllllll}
\hline
Box-Cox Linearity Plot \tabularnewline
# observations x & 64 \tabularnewline
maximum correlation & 0.839494001918864 \tabularnewline
optimal lambda(x) & -2 \tabularnewline
Residual SD (orginial) & 10.6796734330199 \tabularnewline
Residual SD (transformed) & 10.1876036692238 \tabularnewline
\hline
\end{tabular}
%Source: https://freestatistics.org/blog/index.php?pk=24816&T=1

[TABLE]
[ROW][C]Box-Cox Linearity Plot[/C][/ROW]
[ROW][C]# observations x[/C][C]64[/C][/ROW]
[ROW][C]maximum correlation[/C][C]0.839494001918864[/C][/ROW]
[ROW][C]optimal lambda(x)[/C][C]-2[/C][/ROW]
[ROW][C]Residual SD (orginial)[/C][C]10.6796734330199[/C][/ROW]
[ROW][C]Residual SD (transformed)[/C][C]10.1876036692238[/C][/ROW]
[/TABLE]
Source: https://freestatistics.org/blog/index.php?pk=24816&T=1

Globally Unique Identifier (entire table): ba.freestatistics.org/blog/index.php?pk=24816&T=1

As an alternative you can also use a QR Code:  

The GUIDs for individual cells are displayed in the table below:

Box-Cox Linearity Plot
# observations x64
maximum correlation0.839494001918864
optimal lambda(x)-2
Residual SD (orginial)10.6796734330199
Residual SD (transformed)10.1876036692238


Parameters (Session):
Parameters (R input):
R code (references can be found in the software module):
n <- length(x)
c <- array(NA,dim=c(401))
l <- array(NA,dim=c(401))
mx <- 0
mxli <- -999
for (i in 1:401)
{
l[i] <- (i-201)/100
if (l[i] != 0)
{
x1 <- (x^l[i] - 1) / l[i]
} else {
x1 <- log(x)
}
c[i] <- cor(x1,y)
if (mx < abs(c[i]))
{
mx <- abs(c[i])
mxli <- l[i]
}
}
c
mx
mxli
if (mxli != 0)
{
x1 <- (x^mxli - 1) / mxli
} else {
x1 <- log(x)
}
r<-lm(y~x)
se <- sqrt(var(r$residuals))
r1 <- lm(y~x1)
se1 <- sqrt(var(r1$residuals))
bitmap(file='test1.png')
plot(l,c,main='Box-Cox Linearity Plot',xlab='Lambda',ylab='correlation')
grid()
dev.off()
bitmap(file='test2.png')
plot(x,y,main='Linear Fit of Original Data',xlab='x',ylab='y')
abline(r)
grid()
mtext(paste('Residual Standard Deviation = ',se))
dev.off()
bitmap(file='test3.png')
plot(x1,y,main='Linear Fit of Transformed Data',xlab='x',ylab='y')
abline(r1)
grid()
mtext(paste('Residual Standard Deviation = ',se1))
dev.off()
load(file='createtable')
a<-table.start()
a<-table.row.start(a)
a<-table.element(a,'Box-Cox Linearity Plot',2,TRUE)
a<-table.row.end(a)
a<-table.row.start(a)
a<-table.element(a,'# observations x',header=TRUE)
a<-table.element(a,n)
a<-table.row.end(a)
a<-table.row.start(a)
a<-table.element(a,'maximum correlation',header=TRUE)
a<-table.element(a,mx)
a<-table.row.end(a)
a<-table.row.start(a)
a<-table.element(a,'optimal lambda(x)',header=TRUE)
a<-table.element(a,mxli)
a<-table.row.end(a)
a<-table.row.start(a)
a<-table.element(a,'Residual SD (orginial)',header=TRUE)
a<-table.element(a,se)
a<-table.row.end(a)
a<-table.row.start(a)
a<-table.element(a,'Residual SD (transformed)',header=TRUE)
a<-table.element(a,se1)
a<-table.row.end(a)
a<-table.end(a)
table.save(a,file='mytable.tab')