Free Statistics

of Irreproducible Research!

Author's title

Author*The author of this computation has been verified*
R Software Modulerwasp_hierarchicalclustering.wasp
Title produced by softwareHierarchical Clustering
Date of computationThu, 13 Nov 2008 11:40:30 -0700
Cite this page as followsStatistical Computations at FreeStatistics.org, Office for Research Development and Education, URL https://freestatistics.org/blog/index.php?v=date/2008/Nov/13/t12266025318ion8p87dn5pxhr.htm/, Retrieved Sun, 19 May 2024 09:16:31 +0000
Statistical Computations at FreeStatistics.org, Office for Research Development and Education, URL https://freestatistics.org/blog/index.php?pk=24773, Retrieved Sun, 19 May 2024 09:16:31 +0000
QR Codes:

Original text written by user:
IsPrivate?No (this computation is public)
User-defined keywords
Estimated Impact188
Family? (F = Feedback message, R = changed R code, M = changed R Module, P = changed Parameters, D = changed Data)
-     [Hierarchical Clustering] [Hierarchical clus...] [2008-11-13 17:54:36] [5262baed313b307078ce11eb68e9efe6]
F    D    [Hierarchical Clustering] [Hierarchical clus...] [2008-11-13 18:40:30] [5bd06487453d0eec7a1bf04bf9f25085] [Current]
Feedback Forum
2008-11-20 15:48:17 [Gert-Jan Geudens] [reply
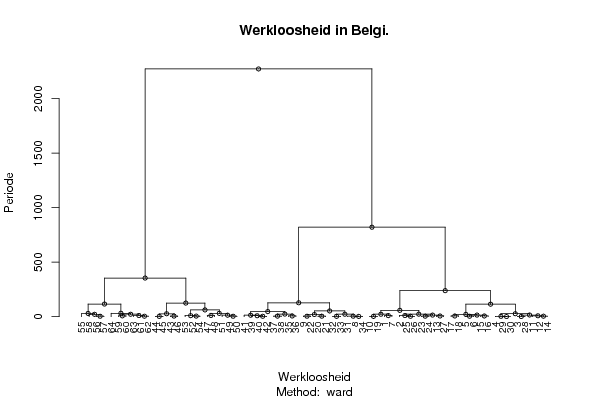
De conclusie is niet gegeven. De dendrogram tracht gelijkaardige gegevens onder te verdelen in clusters of groepen.
Uit deze dendrogram kunnen we duidelijk afleiden dat de maanden 43 tot en met 64 zich in de linkse cluster bevinden en dus ongeveer gelijkaardig zijn. De andere maanden bevinden zich in de rechter cluster.
2008-11-20 20:57:52 [Gilliam Schoorel] [reply
Hey,

Op google etc kan je wel enkele definities vinden van dendogrammen.
De dendogram gaat de tijdreeksen opdelen in twee clusters. Elke cluster wordt steeds opnieuw opgedeeld tot men aan een periode komt. Ze vergelijkt gelijkaardige gegevens van de variabelen. Op je dendogram kan je zien dat de maanden 43 tem 64 ongeveer gelijk zijn (ze bevinden zich in de linker cluster).
2008-11-24 19:19:31 [Sören Van Donink] [reply
De conclusie is niet gegeven. De dendrogram tracht gelijkaardige gegevens onder te verdelen in clusters of groepen. Dit gaat door tot op één periode.
Uit deze dendrogram kunnen we duidelijk afleiden dat de maanden 43 tot en met 64 zich in de linkse cluster bevinden en dus ongeveer gelijkaardig zijn. De andere maanden bevinden zich in de rechter cluster.

Post a new message
Dataseries X:
493	116	377
481	111	370
462	104	358
457	100	357
442	93	349
439	91	348
488	119	369
521	139	381
501	134	368
485	124	361
464	113	351
460	109	351
467	109	358
460	106	354
448	101	347
443	98	345
436	93	343
431	91	340
484	122	362
510	139	370
513	140	373
503	132	371
471	117	354
471	114	357
476	113	363
475	110	364
470	107	363
461	103	358
455	98	357
456	98	357
517	137	380
525	148	378
523	147	376
519	139	380
509	130	379
512	128	384
519	127	392
517	123	394
510	118	392
509	114	396
501	108	392
507	111	396
569	151	419
580	159	421
578	158	420
565	148	418
547	138	410
555	137	418
562	136	426
561	133	428
555	126	430
544	120	424
537	114	423
543	116	427
594	153	441
611	162	449
613	161	452
611	149	462
594	139	455
595	135	461
591	130	461
589	127	463
584	122	462
573	117	456


Summary of computational transaction
Raw Inputview raw input (R code)
Raw Outputview raw output of R engine
Computing time3 seconds
R Server'Herman Ole Andreas Wold' @ 193.190.124.10:1001

\begin{tabular}{lllllllll}
\hline
Summary of computational transaction \tabularnewline
Raw Input & view raw input (R code)  \tabularnewline
Raw Output & view raw output of R engine  \tabularnewline
Computing time & 3 seconds \tabularnewline
R Server & 'Herman Ole Andreas Wold' @ 193.190.124.10:1001 \tabularnewline
\hline
\end{tabular}
%Source: https://freestatistics.org/blog/index.php?pk=24773&T=0

[TABLE]
[ROW][C]Summary of computational transaction[/C][/ROW]
[ROW][C]Raw Input[/C][C]view raw input (R code) [/C][/ROW]
[ROW][C]Raw Output[/C][C]view raw output of R engine [/C][/ROW]
[ROW][C]Computing time[/C][C]3 seconds[/C][/ROW]
[ROW][C]R Server[/C][C]'Herman Ole Andreas Wold' @ 193.190.124.10:1001[/C][/ROW]
[/TABLE]
Source: https://freestatistics.org/blog/index.php?pk=24773&T=0

Globally Unique Identifier (entire table): ba.freestatistics.org/blog/index.php?pk=24773&T=0

As an alternative you can also use a QR Code:  

The GUIDs for individual cells are displayed in the table below:

Summary of computational transaction
Raw Inputview raw input (R code)
Raw Outputview raw output of R engine
Computing time3 seconds
R Server'Herman Ole Andreas Wold' @ 193.190.124.10:1001


Summary of Dendrogram
LabelHeight
11
21.41421356237310
32.23606797749979
42.44948974278318
52.44948974278318
63
73.04299673483065
83.3166247903554
93.60555127546399
103.74165738677394
113.74165738677394
123.74165738677394
134.12310562561766
144.12310562561766
154.19531255396809
164.24264068711928
174.24264068711928
184.35889894354067
194.89897948556636
205.09901951359278
215.09901951359278
226.16441400296898
236.16441400296898
246.16441400296898
256.16441400296898
267.28010988928052
278.09190611531691
288.36274151723244
299.47161567483146
309.89949493661167
3110.4783014776451
3210.5046359118436
3311.3578166916005
3413.0250284704506
3513.6055900115565
3614.3180005190900
3714.4328855830626
3815.1172612831014
3919.6176303718507
4021.0466606673232
4121.5079755769913
4222.1209977377159
4322.2118952886881
4422.3529657729801
4522.9261441364216
4623.4596208943976
4726.5044481470131
4827.0038179354249
4929.4437468163541
5029.9705444142465
5131.2023589484089
5246.6502786886399
5352.3844044297933
5457.9344083137191
5561.8961167183344
56114.544243689187
57115.612153596980
58124.720675213633
59127.255064005911
60238.692627276993
61354.178143335913
62820.802661979632
632273.2871274683

\begin{tabular}{lllllllll}
\hline
Summary of Dendrogram \tabularnewline
Label & Height \tabularnewline
1 & 1 \tabularnewline
2 & 1.41421356237310 \tabularnewline
3 & 2.23606797749979 \tabularnewline
4 & 2.44948974278318 \tabularnewline
5 & 2.44948974278318 \tabularnewline
6 & 3 \tabularnewline
7 & 3.04299673483065 \tabularnewline
8 & 3.3166247903554 \tabularnewline
9 & 3.60555127546399 \tabularnewline
10 & 3.74165738677394 \tabularnewline
11 & 3.74165738677394 \tabularnewline
12 & 3.74165738677394 \tabularnewline
13 & 4.12310562561766 \tabularnewline
14 & 4.12310562561766 \tabularnewline
15 & 4.19531255396809 \tabularnewline
16 & 4.24264068711928 \tabularnewline
17 & 4.24264068711928 \tabularnewline
18 & 4.35889894354067 \tabularnewline
19 & 4.89897948556636 \tabularnewline
20 & 5.09901951359278 \tabularnewline
21 & 5.09901951359278 \tabularnewline
22 & 6.16441400296898 \tabularnewline
23 & 6.16441400296898 \tabularnewline
24 & 6.16441400296898 \tabularnewline
25 & 6.16441400296898 \tabularnewline
26 & 7.28010988928052 \tabularnewline
27 & 8.09190611531691 \tabularnewline
28 & 8.36274151723244 \tabularnewline
29 & 9.47161567483146 \tabularnewline
30 & 9.89949493661167 \tabularnewline
31 & 10.4783014776451 \tabularnewline
32 & 10.5046359118436 \tabularnewline
33 & 11.3578166916005 \tabularnewline
34 & 13.0250284704506 \tabularnewline
35 & 13.6055900115565 \tabularnewline
36 & 14.3180005190900 \tabularnewline
37 & 14.4328855830626 \tabularnewline
38 & 15.1172612831014 \tabularnewline
39 & 19.6176303718507 \tabularnewline
40 & 21.0466606673232 \tabularnewline
41 & 21.5079755769913 \tabularnewline
42 & 22.1209977377159 \tabularnewline
43 & 22.2118952886881 \tabularnewline
44 & 22.3529657729801 \tabularnewline
45 & 22.9261441364216 \tabularnewline
46 & 23.4596208943976 \tabularnewline
47 & 26.5044481470131 \tabularnewline
48 & 27.0038179354249 \tabularnewline
49 & 29.4437468163541 \tabularnewline
50 & 29.9705444142465 \tabularnewline
51 & 31.2023589484089 \tabularnewline
52 & 46.6502786886399 \tabularnewline
53 & 52.3844044297933 \tabularnewline
54 & 57.9344083137191 \tabularnewline
55 & 61.8961167183344 \tabularnewline
56 & 114.544243689187 \tabularnewline
57 & 115.612153596980 \tabularnewline
58 & 124.720675213633 \tabularnewline
59 & 127.255064005911 \tabularnewline
60 & 238.692627276993 \tabularnewline
61 & 354.178143335913 \tabularnewline
62 & 820.802661979632 \tabularnewline
63 & 2273.2871274683 \tabularnewline
\hline
\end{tabular}
%Source: https://freestatistics.org/blog/index.php?pk=24773&T=1

[TABLE]
[ROW][C]Summary of Dendrogram[/C][/ROW]
[ROW][C]Label[/C][C]Height[/C][/ROW]
[ROW][C]1[/C][C]1[/C][/ROW]
[ROW][C]2[/C][C]1.41421356237310[/C][/ROW]
[ROW][C]3[/C][C]2.23606797749979[/C][/ROW]
[ROW][C]4[/C][C]2.44948974278318[/C][/ROW]
[ROW][C]5[/C][C]2.44948974278318[/C][/ROW]
[ROW][C]6[/C][C]3[/C][/ROW]
[ROW][C]7[/C][C]3.04299673483065[/C][/ROW]
[ROW][C]8[/C][C]3.3166247903554[/C][/ROW]
[ROW][C]9[/C][C]3.60555127546399[/C][/ROW]
[ROW][C]10[/C][C]3.74165738677394[/C][/ROW]
[ROW][C]11[/C][C]3.74165738677394[/C][/ROW]
[ROW][C]12[/C][C]3.74165738677394[/C][/ROW]
[ROW][C]13[/C][C]4.12310562561766[/C][/ROW]
[ROW][C]14[/C][C]4.12310562561766[/C][/ROW]
[ROW][C]15[/C][C]4.19531255396809[/C][/ROW]
[ROW][C]16[/C][C]4.24264068711928[/C][/ROW]
[ROW][C]17[/C][C]4.24264068711928[/C][/ROW]
[ROW][C]18[/C][C]4.35889894354067[/C][/ROW]
[ROW][C]19[/C][C]4.89897948556636[/C][/ROW]
[ROW][C]20[/C][C]5.09901951359278[/C][/ROW]
[ROW][C]21[/C][C]5.09901951359278[/C][/ROW]
[ROW][C]22[/C][C]6.16441400296898[/C][/ROW]
[ROW][C]23[/C][C]6.16441400296898[/C][/ROW]
[ROW][C]24[/C][C]6.16441400296898[/C][/ROW]
[ROW][C]25[/C][C]6.16441400296898[/C][/ROW]
[ROW][C]26[/C][C]7.28010988928052[/C][/ROW]
[ROW][C]27[/C][C]8.09190611531691[/C][/ROW]
[ROW][C]28[/C][C]8.36274151723244[/C][/ROW]
[ROW][C]29[/C][C]9.47161567483146[/C][/ROW]
[ROW][C]30[/C][C]9.89949493661167[/C][/ROW]
[ROW][C]31[/C][C]10.4783014776451[/C][/ROW]
[ROW][C]32[/C][C]10.5046359118436[/C][/ROW]
[ROW][C]33[/C][C]11.3578166916005[/C][/ROW]
[ROW][C]34[/C][C]13.0250284704506[/C][/ROW]
[ROW][C]35[/C][C]13.6055900115565[/C][/ROW]
[ROW][C]36[/C][C]14.3180005190900[/C][/ROW]
[ROW][C]37[/C][C]14.4328855830626[/C][/ROW]
[ROW][C]38[/C][C]15.1172612831014[/C][/ROW]
[ROW][C]39[/C][C]19.6176303718507[/C][/ROW]
[ROW][C]40[/C][C]21.0466606673232[/C][/ROW]
[ROW][C]41[/C][C]21.5079755769913[/C][/ROW]
[ROW][C]42[/C][C]22.1209977377159[/C][/ROW]
[ROW][C]43[/C][C]22.2118952886881[/C][/ROW]
[ROW][C]44[/C][C]22.3529657729801[/C][/ROW]
[ROW][C]45[/C][C]22.9261441364216[/C][/ROW]
[ROW][C]46[/C][C]23.4596208943976[/C][/ROW]
[ROW][C]47[/C][C]26.5044481470131[/C][/ROW]
[ROW][C]48[/C][C]27.0038179354249[/C][/ROW]
[ROW][C]49[/C][C]29.4437468163541[/C][/ROW]
[ROW][C]50[/C][C]29.9705444142465[/C][/ROW]
[ROW][C]51[/C][C]31.2023589484089[/C][/ROW]
[ROW][C]52[/C][C]46.6502786886399[/C][/ROW]
[ROW][C]53[/C][C]52.3844044297933[/C][/ROW]
[ROW][C]54[/C][C]57.9344083137191[/C][/ROW]
[ROW][C]55[/C][C]61.8961167183344[/C][/ROW]
[ROW][C]56[/C][C]114.544243689187[/C][/ROW]
[ROW][C]57[/C][C]115.612153596980[/C][/ROW]
[ROW][C]58[/C][C]124.720675213633[/C][/ROW]
[ROW][C]59[/C][C]127.255064005911[/C][/ROW]
[ROW][C]60[/C][C]238.692627276993[/C][/ROW]
[ROW][C]61[/C][C]354.178143335913[/C][/ROW]
[ROW][C]62[/C][C]820.802661979632[/C][/ROW]
[ROW][C]63[/C][C]2273.2871274683[/C][/ROW]
[/TABLE]
Source: https://freestatistics.org/blog/index.php?pk=24773&T=1

Globally Unique Identifier (entire table): ba.freestatistics.org/blog/index.php?pk=24773&T=1

As an alternative you can also use a QR Code:  

The GUIDs for individual cells are displayed in the table below:

Summary of Dendrogram
LabelHeight
11
21.41421356237310
32.23606797749979
42.44948974278318
52.44948974278318
63
73.04299673483065
83.3166247903554
93.60555127546399
103.74165738677394
113.74165738677394
123.74165738677394
134.12310562561766
144.12310562561766
154.19531255396809
164.24264068711928
174.24264068711928
184.35889894354067
194.89897948556636
205.09901951359278
215.09901951359278
226.16441400296898
236.16441400296898
246.16441400296898
256.16441400296898
267.28010988928052
278.09190611531691
288.36274151723244
299.47161567483146
309.89949493661167
3110.4783014776451
3210.5046359118436
3311.3578166916005
3413.0250284704506
3513.6055900115565
3614.3180005190900
3714.4328855830626
3815.1172612831014
3919.6176303718507
4021.0466606673232
4121.5079755769913
4222.1209977377159
4322.2118952886881
4422.3529657729801
4522.9261441364216
4623.4596208943976
4726.5044481470131
4827.0038179354249
4929.4437468163541
5029.9705444142465
5131.2023589484089
5246.6502786886399
5352.3844044297933
5457.9344083137191
5561.8961167183344
56114.544243689187
57115.612153596980
58124.720675213633
59127.255064005911
60238.692627276993
61354.178143335913
62820.802661979632
632273.2871274683


Parameters (Session):
par1 = ward ; par2 = ALL ; par3 = FALSE ; par4 = FALSE ;
Parameters (R input):
par1 = ward ; par2 = ALL ; par3 = FALSE ; par4 = FALSE ;
R code (references can be found in the software module):
par3 <- as.logical(par3)
par4 <- as.logical(par4)
if (par3 == 'TRUE'){
dum = xlab
xlab = ylab
ylab = dum
}
x <- t(y)
hc <- hclust(dist(x),method=par1)
d <- as.dendrogram(hc)
str(d)
mysub <- paste('Method: ',par1)
bitmap(file='test1.png')
if (par4 == 'TRUE'){
plot(d,main=main,ylab=ylab,xlab=xlab,horiz=par3, nodePar=list(pch = c(1,NA), cex=0.8, lab.cex = 0.8),type='t',center=T, sub=mysub)
} else {
plot(d,main=main,ylab=ylab,xlab=xlab,horiz=par3, nodePar=list(pch = c(1,NA), cex=0.8, lab.cex = 0.8), sub=mysub)
}
dev.off()
if (par2 != 'ALL'){
if (par3 == 'TRUE'){
ylab = 'cluster'
} else {
xlab = 'cluster'
}
par2 <- as.numeric(par2)
memb <- cutree(hc, k = par2)
cent <- NULL
for(k in 1:par2){
cent <- rbind(cent, colMeans(x[memb == k, , drop = FALSE]))
}
hc1 <- hclust(dist(cent),method=par1, members = table(memb))
de <- as.dendrogram(hc1)
bitmap(file='test2.png')
if (par4 == 'TRUE'){
plot(de,main=main,ylab=ylab,xlab=xlab,horiz=par3, nodePar=list(pch = c(1,NA), cex=0.8, lab.cex = 0.8),type='t',center=T, sub=mysub)
} else {
plot(de,main=main,ylab=ylab,xlab=xlab,horiz=par3, nodePar=list(pch = c(1,NA), cex=0.8, lab.cex = 0.8), sub=mysub)
}
dev.off()
str(de)
}
load(file='createtable')
a<-table.start()
a<-table.row.start(a)
a<-table.element(a,'Summary of Dendrogram',2,TRUE)
a<-table.row.end(a)
a<-table.row.start(a)
a<-table.element(a,'Label',header=TRUE)
a<-table.element(a,'Height',header=TRUE)
a<-table.row.end(a)
num <- length(x[,1])-1
for (i in 1:num)
{
a<-table.row.start(a)
a<-table.element(a,hc$labels[i])
a<-table.element(a,hc$height[i])
a<-table.row.end(a)
}
a<-table.end(a)
table.save(a,file='mytable1.tab')
if (par2 != 'ALL'){
a<-table.start()
a<-table.row.start(a)
a<-table.element(a,'Summary of Cut Dendrogram',2,TRUE)
a<-table.row.end(a)
a<-table.row.start(a)
a<-table.element(a,'Label',header=TRUE)
a<-table.element(a,'Height',header=TRUE)
a<-table.row.end(a)
num <- par2-1
for (i in 1:num)
{
a<-table.row.start(a)
a<-table.element(a,i)
a<-table.element(a,hc1$height[i])
a<-table.row.end(a)
}
a<-table.end(a)
table.save(a,file='mytable2.tab')
}