Free Statistics

of Irreproducible Research!

Author's title

Author*The author of this computation has been verified*
R Software Modulerwasp_bidensity.wasp
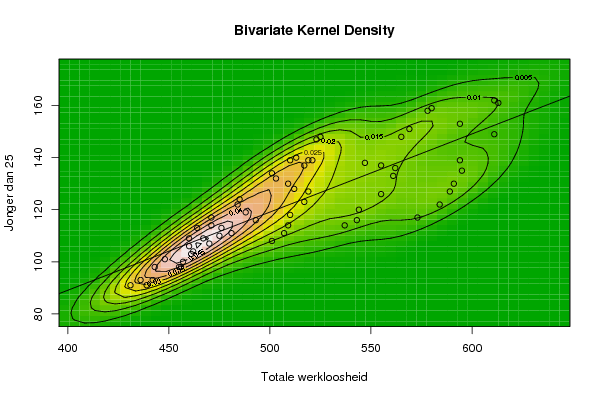
Title produced by softwareBivariate Kernel Density Estimation
Date of computationThu, 13 Nov 2008 11:53:01 -0700
Cite this page as followsStatistical Computations at FreeStatistics.org, Office for Research Development and Education, URL https://freestatistics.org/blog/index.php?v=date/2008/Nov/13/t12266024266uz9kf7d9e29vuh.htm/, Retrieved Sun, 19 May 2024 08:49:54 +0000
Statistical Computations at FreeStatistics.org, Office for Research Development and Education, URL https://freestatistics.org/blog/index.php?pk=24772, Retrieved Sun, 19 May 2024 08:49:54 +0000
QR Codes:

Original text written by user:
IsPrivate?No (this computation is public)
User-defined keywords
Estimated Impact180
Family? (F = Feedback message, R = changed R code, M = changed R Module, P = changed Parameters, D = changed Data)
-     [Hierarchical Clustering] [Hierarchical clus...] [2008-11-13 17:54:36] [5262baed313b307078ce11eb68e9efe6]
F RMPD    [Bivariate Kernel Density Estimation] [Bivariate density] [2008-11-13 18:53:01] [5bd06487453d0eec7a1bf04bf9f25085] [Current]
Feedback Forum
2008-11-20 15:41:02 [Gert-Jan Geudens] [reply
De studente heeft geen conclusie gegeven. We zien hier duidelijk een positief verband tussen beide variabelen. Dit zien we aan de hand van de positief gerichte ovalen die door de hoogtelijnen worden gevormd.
2008-11-20 20:28:27 [Gilliam Schoorel] [reply
2008-11-20 20:32:26 [Gilliam Schoorel] [reply
De conclusie ontbreekt. Bivariate dichtheid schat de afhankelijkheid van de variabelen dmv de dichtheid te berekenen. De hoogtelijnen zijn ellipsvormig en liggen schuin naar buiven wat wijst op een positief (en lineair verband).
2008-11-24 19:01:39 [Sören Van Donink] [reply
Er werd geen conclusie gegeven. Er is sprake van een positief verband als gevolg van de diagonaal positief geïnclineerde ellipsen en een positief hellende regressie rechte.

Post a new message
Dataseries X:
493
481
462
457
442
439
488
521
501
485
464
460
467
460
448
443
436
431
484
510
513
503
471
471
476
475
470
461
455
456
517
525
523
519
509
512
519
517
510
509
501
507
569
580
578
565
547
555
562
561
555
544
537
543
594
611
613
611
594
595
591
589
584
573
Dataseries Y:
116
111
104
100
93
91
119
139
134
124
113
109
109
106
101
98
93
91
122
139
140
132
117
114
113
110
107
103
98
98
137
148
147
139
130
128
127
123
118
114
108
111
151
159
158
148
138
137
136
133
126
120
114
116
153
162
161
149
139
135
130
127
122
117


Summary of computational transaction
Raw Inputview raw input (R code)
Raw Outputview raw output of R engine
Computing time1 seconds
R Server'George Udny Yule' @ 72.249.76.132

\begin{tabular}{lllllllll}
\hline
Summary of computational transaction \tabularnewline
Raw Input & view raw input (R code)  \tabularnewline
Raw Output & view raw output of R engine  \tabularnewline
Computing time & 1 seconds \tabularnewline
R Server & 'George Udny Yule' @ 72.249.76.132 \tabularnewline
\hline
\end{tabular}
%Source: https://freestatistics.org/blog/index.php?pk=24772&T=0

[TABLE]
[ROW][C]Summary of computational transaction[/C][/ROW]
[ROW][C]Raw Input[/C][C]view raw input (R code) [/C][/ROW]
[ROW][C]Raw Output[/C][C]view raw output of R engine [/C][/ROW]
[ROW][C]Computing time[/C][C]1 seconds[/C][/ROW]
[ROW][C]R Server[/C][C]'George Udny Yule' @ 72.249.76.132[/C][/ROW]
[/TABLE]
Source: https://freestatistics.org/blog/index.php?pk=24772&T=0

Globally Unique Identifier (entire table): ba.freestatistics.org/blog/index.php?pk=24772&T=0

As an alternative you can also use a QR Code:  

The GUIDs for individual cells are displayed in the table below:

Summary of computational transaction
Raw Inputview raw input (R code)
Raw Outputview raw output of R engine
Computing time1 seconds
R Server'George Udny Yule' @ 72.249.76.132


Bandwidth
x axis21.8832264871429
y axis9.89759822769557
Correlation
correlation used in KDE0.821912248566757
correlation(x,y)0.821912248566757

\begin{tabular}{lllllllll}
\hline
Bandwidth \tabularnewline
x axis & 21.8832264871429 \tabularnewline
y axis & 9.89759822769557 \tabularnewline
Correlation \tabularnewline
correlation used in KDE & 0.821912248566757 \tabularnewline
correlation(x,y) & 0.821912248566757 \tabularnewline
\hline
\end{tabular}
%Source: https://freestatistics.org/blog/index.php?pk=24772&T=1

[TABLE]
[ROW][C]Bandwidth[/C][/ROW]
[ROW][C]x axis[/C][C]21.8832264871429[/C][/ROW]
[ROW][C]y axis[/C][C]9.89759822769557[/C][/ROW]
[ROW][C]Correlation[/C][/ROW]
[ROW][C]correlation used in KDE[/C][C]0.821912248566757[/C][/ROW]
[ROW][C]correlation(x,y)[/C][C]0.821912248566757[/C][/ROW]
[/TABLE]
Source: https://freestatistics.org/blog/index.php?pk=24772&T=1

Globally Unique Identifier (entire table): ba.freestatistics.org/blog/index.php?pk=24772&T=1

As an alternative you can also use a QR Code:  

The GUIDs for individual cells are displayed in the table below:

Bandwidth
x axis21.8832264871429
y axis9.89759822769557
Correlation
correlation used in KDE0.821912248566757
correlation(x,y)0.821912248566757


Parameters (Session):
par1 = 50 ; par2 = 50 ; par3 = 0 ; par4 = 0 ; par5 = 0 ; par6 = Y ; par7 = Y ;
Parameters (R input):
par1 = 50 ; par2 = 50 ; par3 = 0 ; par4 = 0 ; par5 = 0 ; par6 = Y ; par7 = Y ;
R code (references can be found in the software module):
par1 <- as(par1,'numeric')
par2 <- as(par2,'numeric')
par3 <- as(par3,'numeric')
par4 <- as(par4,'numeric')
par5 <- as(par5,'numeric')
library('GenKern')
if (par3==0) par3 <- dpik(x)
if (par4==0) par4 <- dpik(y)
if (par5==0) par5 <- cor(x,y)
if (par1 > 500) par1 <- 500
if (par2 > 500) par2 <- 500
bitmap(file='bidensity.png')
op <- KernSur(x,y, xgridsize=par1, ygridsize=par2, correlation=par5, xbandwidth=par3, ybandwidth=par4)
image(op$xords, op$yords, op$zden, col=terrain.colors(100), axes=TRUE,main=main,xlab=xlab,ylab=ylab)
if (par6=='Y') contour(op$xords, op$yords, op$zden, add=TRUE)
if (par7=='Y') points(x,y)
(r<-lm(y ~ x))
abline(r)
box()
dev.off()
load(file='createtable')
a<-table.start()
a<-table.row.start(a)
a<-table.element(a,'Bandwidth',2,TRUE)
a<-table.row.end(a)
a<-table.row.start(a)
a<-table.element(a,'x axis',header=TRUE)
a<-table.element(a,par3)
a<-table.row.end(a)
a<-table.row.start(a)
a<-table.element(a,'y axis',header=TRUE)
a<-table.element(a,par4)
a<-table.row.end(a)
a<-table.row.start(a)
a<-table.element(a,'Correlation',2,TRUE)
a<-table.row.end(a)
a<-table.row.start(a)
a<-table.element(a,'correlation used in KDE',header=TRUE)
a<-table.element(a,par5)
a<-table.row.end(a)
a<-table.row.start(a)
a<-table.element(a,'correlation(x,y)',header=TRUE)
a<-table.element(a,cor(x,y))
a<-table.row.end(a)
a<-table.end(a)
table.save(a,file='mytable.tab')