Free Statistics

of Irreproducible Research!

Author's title

Author*The author of this computation has been verified*
R Software Modulerwasp_cloud.wasp
Title produced by softwareTrivariate Scatterplots
Date of computationThu, 13 Nov 2008 11:44:48 -0700
Cite this page as followsStatistical Computations at FreeStatistics.org, Office for Research Development and Education, URL https://freestatistics.org/blog/index.php?v=date/2008/Nov/13/t1226601977f1bpg8zu43h6qq3.htm/, Retrieved Tue, 28 May 2024 01:04:56 +0000
Statistical Computations at FreeStatistics.org, Office for Research Development and Education, URL https://freestatistics.org/blog/index.php?pk=24765, Retrieved Tue, 28 May 2024 01:04:56 +0000
QR Codes:

Original text written by user:
IsPrivate?No (this computation is public)
User-defined keywordstrivariate scatterplot
Estimated Impact123
Family? (F = Feedback message, R = changed R code, M = changed R Module, P = changed Parameters, D = changed Data)
F       [Trivariate Scatterplots] [Various EDA topic...] [2008-11-13 18:44:48] [74c7506a1ea162af3aa8be25bcd05d28] [Current]
Feedback Forum
2008-11-15 11:57:10 [58d427c57bd46519a715a3a7fea6a80f] [reply
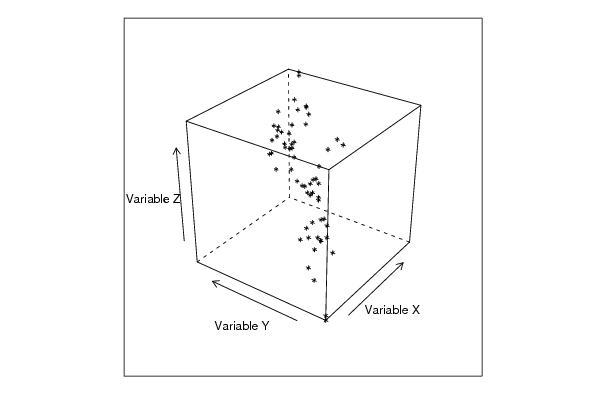
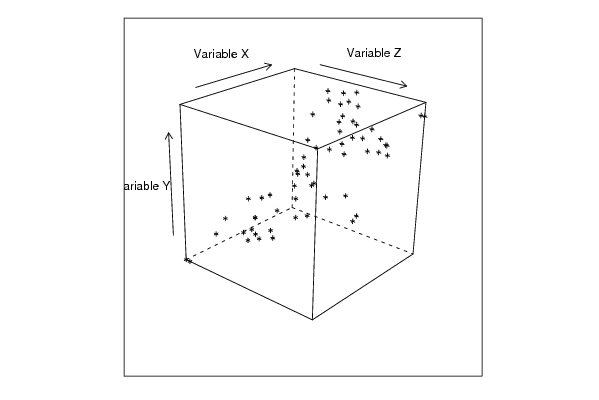
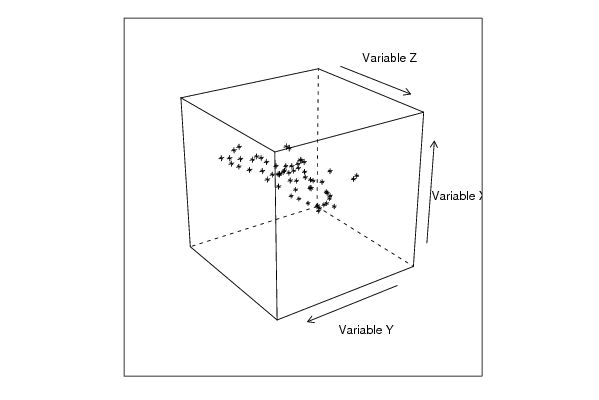
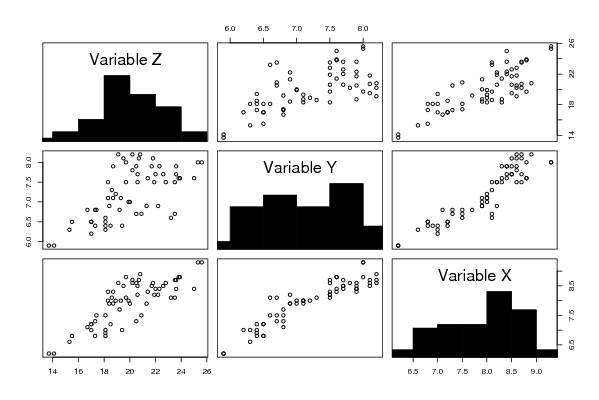
Bij de trivariate scatterplots zouden we het verband kunnen nagaan van 3variabelen tegelijkertijd, natuurlijk zullen we ons moeten beperken tot 2-dimensionele. Maar zo gaat er informatie verloren, naargelang rotatie kubus zijn er andere opmerkingen. Daarvoor hebben we een oplossing namelijk de gestandiseerde voorstelling, elke combinatie gescatterplot. Je neemt punten die bij elkaar liggen, je weet dan nog niet zeker of ze gelijkaardig zijn want je weet de dimensie niet. Je zou wel kunnen zeggen dat er bij alle variabelen een positief lineair verband is.
2008-11-19 18:35:16 [Bénédicte Soens] [reply
Opnieuw wordt er gelijktijdig een verband gezocht tussen de 3 variabelen. Een eerste methode is via een kubus, naargelang je de kubus andere bekijkt, zie je de gegevens op een andere manier. Als we de kubus zouden projecteren op een scherm bekomen we in de plaats van iets 3-dimensioneel, iets 2-dimensioneels. (er gaat wel wat info verloren). Ten tweede hebben we de gestandaardiseerde projecties waarbij op de diagonaal de histogrammen staan en op de andere staan de scatterplots (projecties van de kubussen). De op x-as van iedere scatterplot staat de variabele van het histogram dat eronder staat en op de y-as de variabele van de histogram ernaast. Zoals je kan zien is er een sterker verband tussen x,y en x,z dan bij y,z. Dit is te zien aan het feit dat de gegevens mooier op een rechte lijn liggen, minder verspreid. Het is een positief verband telkens.
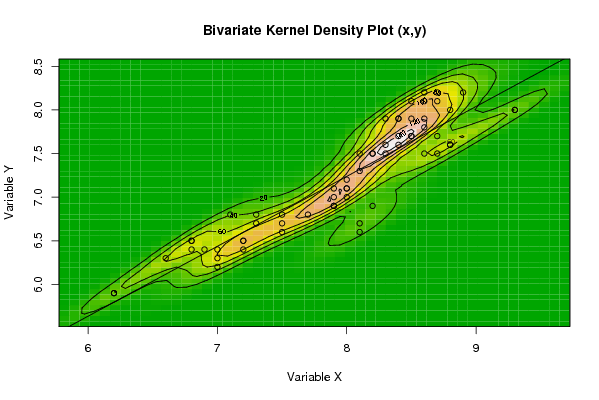
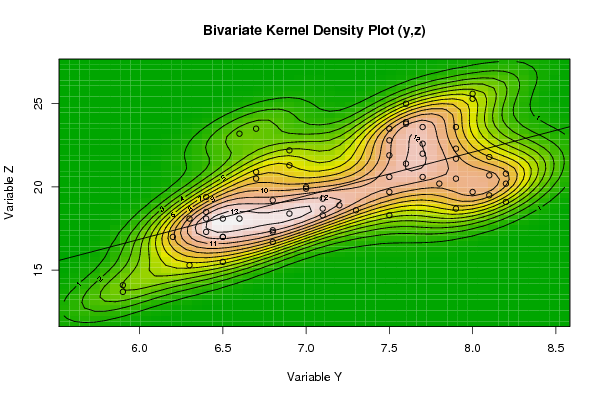
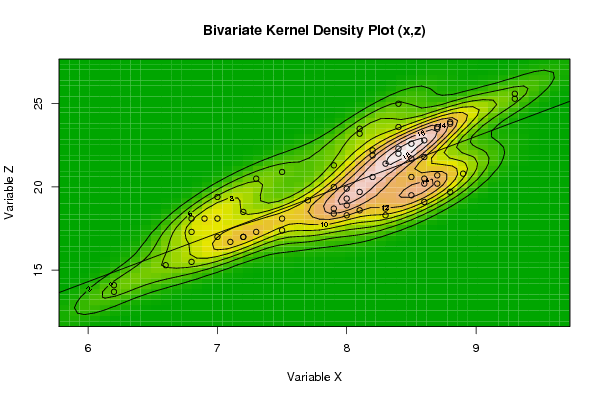
Vervolgens kan je ook figuren zien zoals bij de bivariate density (met regressielijn en hoogtelijnen). Daarbij kan je opnieuw de conclusie zien die ik vermelde bij de uitleg van de scatterplots hierboven (punten liggen dicht bij de regressielijn en de hoogtelijnen liggen er niet ver van verspreid).
2008-11-24 11:37:57 [Julian De Ruyter] [reply
Via de Trivariate Scatterplot wordt weergegeven hoe de 3-dimensionele scatterplot gerelateerd is aan de 2-dimensionle scatterplot en density plot.
Dit is een manier om het verband tussen meedere variabelen uit te drukken in 1 figuur.
Door de kubusfiguur te bekijken kunnen we zien hoe de gegevens van 3 variabelen zijn gelegen. Deze is echter op computerscherm moeilijk is te beoordelen.
We zien in de figuur met scatterplots tussen alle variabelen een positief lineair verband. Het sterkst bij x-y omdat de gegevens zeer duidelijk op een lijn liggen.
Bivariate Density:
Dit is een andere soort van scatterplot. Door middel van dichtheid en concentratie wordt een eventueel verband uitgedrukt. Je ziet in het midden een regressielijn met daarrond de concentratie-hoogtelijnen (rood=hogeconcentratie van gegevens, geel minder,groen nog minder).
Je ziet dat de regressielijn stijgt, wat wijst op positief verband indien de gegevens hier dicht bij liggen. Dit is hier het geval. De puntenwolkjes liggen zeer dicht bij de regressielijn en dit wijst op een POSITIEF verband tussen de variabelen.

Post a new message
Dataseries X:
8,4
8,4
8,4
8,6
8,9
8,8
8,3
7,5
7,2
7,5
8,8
9,3
9,3
8,7
8,2
8,3
8,5
8,6
8,6
8,2
8,1
8
8,6
8,7
8,8
8,5
8,4
8,5
8,7
8,7
8,6
8,5
8,3
8,1
8,2
8,1
8,1
7,9
7,9
7,9
8
8
7,9
8
7,7
7,2
7,5
7,3
7
7
7
7,2
7,3
7,1
6,8
6,6
6,2
6,2
6,8
6,9
6,8
Dataseries Y:
7,6
7,9
7,9
8,1
8,2
8
7,5
6,8
6,5
6,6
7,6
8
8
7,7
7,5
7,6
7,7
7,9
7,8
7,5
7,5
7,1
7,5
7,5
7,6
7,7
7,7
7,9
8,1
8,2
8,2
8,1
7,9
7,3
6,9
6,6
6,7
6,9
7
7,1
7,2
7,1
6,9
7
6,8
6,4
6,7
6,7
6,4
6,3
6,2
6,5
6,8
6,8
6,5
6,3
5,9
5,9
6,4
6,4
6,5
Dataseries Z:
25
23,6
22,3
21,8
20,8
19,7
18,3
17,4
17
18,1
23,9
25,6
25,3
23,6
21,9
21,4
20,6
20,5
20,2
20,6
19,7
19,3
22,8
23,5
23,8
22,6
22
21,7
20,7
20,2
19,1
19,5
18,7
18,6
22,2
23,2
23,5
21,3
20
18,7
18,9
18,3
18,4
19,9
19,2
18,5
20,9
20,5
19,4
18,1
17
17
17,3
16,7
15,5
15,3
13,7
14,1
17,3
18,1
18,1


Summary of computational transaction
Raw Inputview raw input (R code)
Raw Outputview raw output of R engine
Computing time5 seconds
R Server'Sir Ronald Aylmer Fisher' @ 193.190.124.24

\begin{tabular}{lllllllll}
\hline
Summary of computational transaction \tabularnewline
Raw Input & view raw input (R code)  \tabularnewline
Raw Output & view raw output of R engine  \tabularnewline
Computing time & 5 seconds \tabularnewline
R Server & 'Sir Ronald Aylmer Fisher' @ 193.190.124.24 \tabularnewline
\hline
\end{tabular}
%Source: https://freestatistics.org/blog/index.php?pk=24765&T=0

[TABLE]
[ROW][C]Summary of computational transaction[/C][/ROW]
[ROW][C]Raw Input[/C][C]view raw input (R code) [/C][/ROW]
[ROW][C]Raw Output[/C][C]view raw output of R engine [/C][/ROW]
[ROW][C]Computing time[/C][C]5 seconds[/C][/ROW]
[ROW][C]R Server[/C][C]'Sir Ronald Aylmer Fisher' @ 193.190.124.24[/C][/ROW]
[/TABLE]
Source: https://freestatistics.org/blog/index.php?pk=24765&T=0

Globally Unique Identifier (entire table): ba.freestatistics.org/blog/index.php?pk=24765&T=0

As an alternative you can also use a QR Code:  

The GUIDs for individual cells are displayed in the table below:

Summary of computational transaction
Raw Inputview raw input (R code)
Raw Outputview raw output of R engine
Computing time5 seconds
R Server'Sir Ronald Aylmer Fisher' @ 193.190.124.24


Parameters (Session):
par1 = 50 ; par2 = 50 ; par3 = Y ; par4 = Y ; par5 = Variable X ; par6 = Variable Y ; par7 = Variable Z ;
Parameters (R input):
par1 = 50 ; par2 = 50 ; par3 = Y ; par4 = Y ; par5 = Variable X ; par6 = Variable Y ; par7 = Variable Z ;
R code (references can be found in the software module):
x <- array(x,dim=c(length(x),1))
colnames(x) <- par5
y <- array(y,dim=c(length(y),1))
colnames(y) <- par6
z <- array(z,dim=c(length(z),1))
colnames(z) <- par7
d <- data.frame(cbind(z,y,x))
colnames(d) <- list(par7,par6,par5)
par1 <- as.numeric(par1)
par2 <- as.numeric(par2)
if (par1>500) par1 <- 500
if (par2>500) par2 <- 500
if (par1<10) par1 <- 10
if (par2<10) par2 <- 10
library(GenKern)
library(lattice)
panel.hist <- function(x, ...)
{
usr <- par('usr'); on.exit(par(usr))
par(usr = c(usr[1:2], 0, 1.5) )
h <- hist(x, plot = FALSE)
breaks <- h$breaks; nB <- length(breaks)
y <- h$counts; y <- y/max(y)
rect(breaks[-nB], 0, breaks[-1], y, col='black', ...)
}
bitmap(file='cloud1.png')
cloud(z~x*y, screen = list(x=-45, y=45, z=35),xlab=par5,ylab=par6,zlab=par7)
dev.off()
bitmap(file='cloud2.png')
cloud(z~x*y, screen = list(x=35, y=45, z=25),xlab=par5,ylab=par6,zlab=par7)
dev.off()
bitmap(file='cloud3.png')
cloud(z~x*y, screen = list(x=35, y=-25, z=90),xlab=par5,ylab=par6,zlab=par7)
dev.off()
bitmap(file='pairs.png')
pairs(d,diag.panel=panel.hist)
dev.off()
x <- as.vector(x)
y <- as.vector(y)
z <- as.vector(z)
bitmap(file='bidensity1.png')
op <- KernSur(x,y, xgridsize=par1, ygridsize=par2, correlation=cor(x,y), xbandwidth=dpik(x), ybandwidth=dpik(y))
image(op$xords, op$yords, op$zden, col=terrain.colors(100), axes=TRUE,main='Bivariate Kernel Density Plot (x,y)',xlab=par5,ylab=par6)
if (par3=='Y') contour(op$xords, op$yords, op$zden, add=TRUE)
if (par4=='Y') points(x,y)
(r<-lm(y ~ x))
abline(r)
box()
dev.off()
bitmap(file='bidensity2.png')
op <- KernSur(y,z, xgridsize=par1, ygridsize=par2, correlation=cor(y,z), xbandwidth=dpik(y), ybandwidth=dpik(z))
op
image(op$xords, op$yords, op$zden, col=terrain.colors(100), axes=TRUE,main='Bivariate Kernel Density Plot (y,z)',xlab=par6,ylab=par7)
if (par3=='Y') contour(op$xords, op$yords, op$zden, add=TRUE)
if (par4=='Y') points(y,z)
(r<-lm(z ~ y))
abline(r)
box()
dev.off()
bitmap(file='bidensity3.png')
op <- KernSur(x,z, xgridsize=par1, ygridsize=par2, correlation=cor(x,z), xbandwidth=dpik(x), ybandwidth=dpik(z))
op
image(op$xords, op$yords, op$zden, col=terrain.colors(100), axes=TRUE,main='Bivariate Kernel Density Plot (x,z)',xlab=par5,ylab=par7)
if (par3=='Y') contour(op$xords, op$yords, op$zden, add=TRUE)
if (par4=='Y') points(x,z)
(r<-lm(z ~ x))
abline(r)
box()
dev.off()