Free Statistics

of Irreproducible Research!

Author's title

Author*Unverified author*
R Software Modulerwasp_hierarchicalclustering.wasp
Title produced by softwareHierarchical Clustering
Date of computationThu, 13 Nov 2008 11:39:53 -0700
Cite this page as followsStatistical Computations at FreeStatistics.org, Office for Research Development and Education, URL https://freestatistics.org/blog/index.php?v=date/2008/Nov/13/t1226601768jvsnk922rjie4pm.htm/, Retrieved Sun, 19 May 2024 08:52:49 +0000
Statistical Computations at FreeStatistics.org, Office for Research Development and Education, URL https://freestatistics.org/blog/index.php?pk=24760, Retrieved Sun, 19 May 2024 08:52:49 +0000
QR Codes:

Original text written by user:
IsPrivate?No (this computation is public)
User-defined keywords
Estimated Impact137
Family? (F = Feedback message, R = changed R code, M = changed R Module, P = changed Parameters, D = changed Data)
F       [Hierarchical Clustering] [] [2008-11-13 18:39:53] [cae3b9b084628ae4df84563390017721] [Current]
Feedback Forum
2008-11-20 13:04:30 [Steven Vanhooreweghe] [reply
het klopt inderdaad dat je met een dendogram kan aantonen waar de clusters zich bevinden. Ik vraag mij eerlijk gezegd nog steeds af waar p
2008-11-22 17:30:40 [Peter Van Doninck] [reply
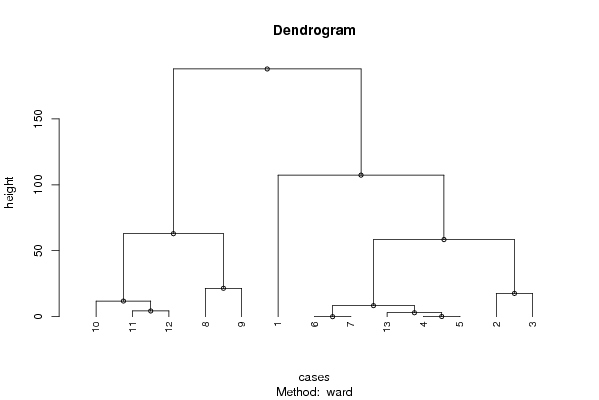
De gegevens uit dit dendogram zijn onvoldoende! Er wordt slechts gebruik gemaakt van 12 metingen, hoewel het er minstens 60 zouden moeten zijn zoals in de les aangehaald werd. Een dendogram wordt gebruikt voor clustering. Gegevens die gelijkaardig zijn, worden onderverdeeld in verschillende clusters. Hierdoor kan men vragen opstellen, die men achteraf, na onderzoek, zal kunnen beantwoorden.
2008-11-24 18:58:14 [Liese Drijkoningen] [reply
Het antwoord van de student kan nog vervolledigd worden.
Op het dendogram zien we vanboven twee opslitsingen die op zich ook steeds verder worden opgesplitst. We kunnen deze grafiek makkelijk visueel aflezen. Een dendogram moet gebruikt worden als een exploratief instrument. In dit geval wordt het wel op een atypische manier gebruikt. Meestal wordt dit statistisch instrument ingezet in marketing.
We hebben hier te maken met clustering. In de rijen kan je de periodes die op elkaar volgen aflezen. Zoals ik al zei, wordt het bovenste knooppunt steeds verder opgesplitst tot men bij de periode aankomt.

Post a new message
Dataseries X:
190,6
230,8
248,4
268
267,9
263,2
263,2
333,8
312,3
295,4
283,3
287,6
265,7


Summary of computational transaction
Raw Inputview raw input (R code)
Raw Outputview raw output of R engine
Computing time2 seconds
R Server'Herman Ole Andreas Wold' @ 193.190.124.10:1001

\begin{tabular}{lllllllll}
\hline
Summary of computational transaction \tabularnewline
Raw Input & view raw input (R code)  \tabularnewline
Raw Output & view raw output of R engine  \tabularnewline
Computing time & 2 seconds \tabularnewline
R Server & 'Herman Ole Andreas Wold' @ 193.190.124.10:1001 \tabularnewline
\hline
\end{tabular}
%Source: https://freestatistics.org/blog/index.php?pk=24760&T=0

[TABLE]
[ROW][C]Summary of computational transaction[/C][/ROW]
[ROW][C]Raw Input[/C][C]view raw input (R code) [/C][/ROW]
[ROW][C]Raw Output[/C][C]view raw output of R engine [/C][/ROW]
[ROW][C]Computing time[/C][C]2 seconds[/C][/ROW]
[ROW][C]R Server[/C][C]'Herman Ole Andreas Wold' @ 193.190.124.10:1001[/C][/ROW]
[/TABLE]
Source: https://freestatistics.org/blog/index.php?pk=24760&T=0

Globally Unique Identifier (entire table): ba.freestatistics.org/blog/index.php?pk=24760&T=0

As an alternative you can also use a QR Code:  

The GUIDs for individual cells are displayed in the table below:

Summary of computational transaction
Raw Inputview raw input (R code)
Raw Outputview raw output of R engine
Computing time2 seconds
R Server'Herman Ole Andreas Wold' @ 193.190.124.10:1001


Summary of Dendrogram
LabelHeight
10
20.100000000000023
32.96666666666666
44.30000000000001
58.37333333333333
611.8333333333333
717.6
821.5
958.4457142857142
1062.9266666666667
11107.314285714286
12187.84

\begin{tabular}{lllllllll}
\hline
Summary of Dendrogram \tabularnewline
Label & Height \tabularnewline
1 & 0 \tabularnewline
2 & 0.100000000000023 \tabularnewline
3 & 2.96666666666666 \tabularnewline
4 & 4.30000000000001 \tabularnewline
5 & 8.37333333333333 \tabularnewline
6 & 11.8333333333333 \tabularnewline
7 & 17.6 \tabularnewline
8 & 21.5 \tabularnewline
9 & 58.4457142857142 \tabularnewline
10 & 62.9266666666667 \tabularnewline
11 & 107.314285714286 \tabularnewline
12 & 187.84 \tabularnewline
\hline
\end{tabular}
%Source: https://freestatistics.org/blog/index.php?pk=24760&T=1

[TABLE]
[ROW][C]Summary of Dendrogram[/C][/ROW]
[ROW][C]Label[/C][C]Height[/C][/ROW]
[ROW][C]1[/C][C]0[/C][/ROW]
[ROW][C]2[/C][C]0.100000000000023[/C][/ROW]
[ROW][C]3[/C][C]2.96666666666666[/C][/ROW]
[ROW][C]4[/C][C]4.30000000000001[/C][/ROW]
[ROW][C]5[/C][C]8.37333333333333[/C][/ROW]
[ROW][C]6[/C][C]11.8333333333333[/C][/ROW]
[ROW][C]7[/C][C]17.6[/C][/ROW]
[ROW][C]8[/C][C]21.5[/C][/ROW]
[ROW][C]9[/C][C]58.4457142857142[/C][/ROW]
[ROW][C]10[/C][C]62.9266666666667[/C][/ROW]
[ROW][C]11[/C][C]107.314285714286[/C][/ROW]
[ROW][C]12[/C][C]187.84[/C][/ROW]
[/TABLE]
Source: https://freestatistics.org/blog/index.php?pk=24760&T=1

Globally Unique Identifier (entire table): ba.freestatistics.org/blog/index.php?pk=24760&T=1

As an alternative you can also use a QR Code:  

The GUIDs for individual cells are displayed in the table below:

Summary of Dendrogram
LabelHeight
10
20.100000000000023
32.96666666666666
44.30000000000001
58.37333333333333
611.8333333333333
717.6
821.5
958.4457142857142
1062.9266666666667
11107.314285714286
12187.84


Parameters (Session):
par1 = ward ; par2 = ALL ; par3 = FALSE ; par4 = FALSE ;
Parameters (R input):
par1 = ward ; par2 = ALL ; par3 = FALSE ; par4 = FALSE ;
R code (references can be found in the software module):
par3 <- as.logical(par3)
par4 <- as.logical(par4)
if (par3 == 'TRUE'){
dum = xlab
xlab = ylab
ylab = dum
}
x <- t(y)
hc <- hclust(dist(x),method=par1)
d <- as.dendrogram(hc)
str(d)
mysub <- paste('Method: ',par1)
bitmap(file='test1.png')
if (par4 == 'TRUE'){
plot(d,main=main,ylab=ylab,xlab=xlab,horiz=par3, nodePar=list(pch = c(1,NA), cex=0.8, lab.cex = 0.8),type='t',center=T, sub=mysub)
} else {
plot(d,main=main,ylab=ylab,xlab=xlab,horiz=par3, nodePar=list(pch = c(1,NA), cex=0.8, lab.cex = 0.8), sub=mysub)
}
dev.off()
if (par2 != 'ALL'){
if (par3 == 'TRUE'){
ylab = 'cluster'
} else {
xlab = 'cluster'
}
par2 <- as.numeric(par2)
memb <- cutree(hc, k = par2)
cent <- NULL
for(k in 1:par2){
cent <- rbind(cent, colMeans(x[memb == k, , drop = FALSE]))
}
hc1 <- hclust(dist(cent),method=par1, members = table(memb))
de <- as.dendrogram(hc1)
bitmap(file='test2.png')
if (par4 == 'TRUE'){
plot(de,main=main,ylab=ylab,xlab=xlab,horiz=par3, nodePar=list(pch = c(1,NA), cex=0.8, lab.cex = 0.8),type='t',center=T, sub=mysub)
} else {
plot(de,main=main,ylab=ylab,xlab=xlab,horiz=par3, nodePar=list(pch = c(1,NA), cex=0.8, lab.cex = 0.8), sub=mysub)
}
dev.off()
str(de)
}
load(file='createtable')
a<-table.start()
a<-table.row.start(a)
a<-table.element(a,'Summary of Dendrogram',2,TRUE)
a<-table.row.end(a)
a<-table.row.start(a)
a<-table.element(a,'Label',header=TRUE)
a<-table.element(a,'Height',header=TRUE)
a<-table.row.end(a)
num <- length(x[,1])-1
for (i in 1:num)
{
a<-table.row.start(a)
a<-table.element(a,hc$labels[i])
a<-table.element(a,hc$height[i])
a<-table.row.end(a)
}
a<-table.end(a)
table.save(a,file='mytable1.tab')
if (par2 != 'ALL'){
a<-table.start()
a<-table.row.start(a)
a<-table.element(a,'Summary of Cut Dendrogram',2,TRUE)
a<-table.row.end(a)
a<-table.row.start(a)
a<-table.element(a,'Label',header=TRUE)
a<-table.element(a,'Height',header=TRUE)
a<-table.row.end(a)
num <- par2-1
for (i in 1:num)
{
a<-table.row.start(a)
a<-table.element(a,i)
a<-table.element(a,hc1$height[i])
a<-table.row.end(a)
}
a<-table.end(a)
table.save(a,file='mytable2.tab')
}