Free Statistics

of Irreproducible Research!

Author's title

Author*Unverified author*
R Software Modulerwasp_boxcoxlin.wasp
Title produced by softwareBox-Cox Linearity Plot
Date of computationThu, 13 Nov 2008 11:14:04 -0700
Cite this page as followsStatistical Computations at FreeStatistics.org, Office for Research Development and Education, URL https://freestatistics.org/blog/index.php?v=date/2008/Nov/13/t1226600109w6sv8khutjwz8jw.htm/, Retrieved Sun, 19 May 2024 12:40:11 +0000
Statistical Computations at FreeStatistics.org, Office for Research Development and Education, URL https://freestatistics.org/blog/index.php?pk=24745, Retrieved Sun, 19 May 2024 12:40:11 +0000
QR Codes:

Original text written by user:
IsPrivate?No (this computation is public)
User-defined keywords
Estimated Impact152
Family? (F = Feedback message, R = changed R code, M = changed R Module, P = changed Parameters, D = changed Data)
F       [Box-Cox Linearity Plot] [] [2008-11-13 18:14:04] [cae3b9b084628ae4df84563390017721] [Current]
Feedback Forum
2008-11-20 13:03:36 [Steven Vanhooreweghe] [reply
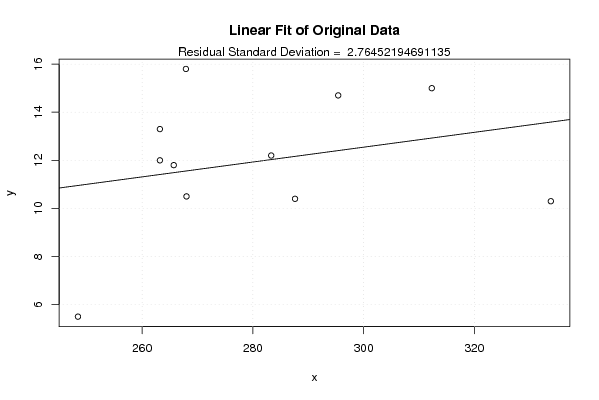
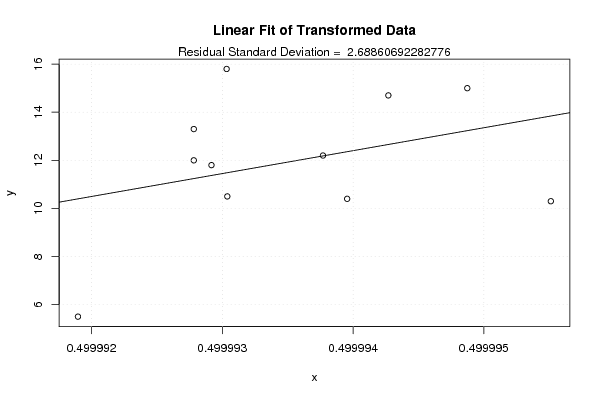
De transformatie heeft niet veel effect aangezien er niet veel verschil is tussen de oude scatterplot en de nieuwe scatterplot
2008-11-22 17:39:22 [Peter Van Doninck] [reply
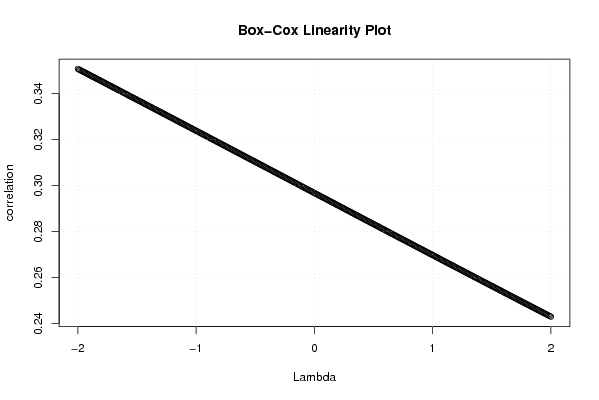
Eerst en vooral dient ook hier de opmerkig gemaakt te worden dat de dataset te klein is, en er bijgevolg niets uit af te leiden is. Indien de dataset voldoende groot zou zijn, kan de box-cox linearity plot getekend worden. Nadien kan er dan gekeken worden of de transformatie iets uitgehaald heeft. In dit voorbeeld zien we een dalende rechte, wat er op wijst dat de toegepaste transformatie van de student geen effect had.
2008-11-24 19:04:27 [Liese Drijkoningen] [reply
Volgende aanvullingen op de student zijn mogelijk.
Het box-cox linearity plot probeert 2 variabelen met elkaar in verband te brengen d.m.v. scatterplots.
Deze module transformeert de variabelen zodat de scatterplots lineair worden.
De vraag die we ons dan moeten stellen is ofdat we na de transformatie een maximum hebben bereikt. Dit kunnen we onderzoeken aan de hand van de parabool. We weten dat het box-cox linearity plot tot -2 loopt, dus is de vraag of dit de optimale waarde is. In dit geval denk ik dat dat niet het geval is. De lijn vertoont nog geen vormen die wijzen op een parabool, het maximum is dus nog niet bereikt.
2008-11-24 19:05:41 [Liese Drijkoningen] [reply
Ik moet hier nog aan toevoegen dat de tranformatie weinig effect heeft, want het verschil tussen het scatterplot voor transformatie en hetgeen erna is vrij liniem.
2008-11-24 19:09:21 [Liese Drijkoningen] [reply
De student heeft voor vraag 4 dezelfde link toegevoegd, maar voor deze opdracht moet een andere module gebruikt worden, namelijk degene die terug te vinden is onder deze link. De student moet dan wel zijn eigen tijdreeks gebruiken als input.
2008-11-24 19:09:47 [Liese Drijkoningen] [reply
Dit is dus de link di emoet gebruikt worden voor vraag 4: http://www.freestatistics.org/blog/index.php?v=date/2008/Nov/12/t1226509457rt7qfgmfi12s8qz.htm

Post a new message
Dataseries X:
248,4
268
267,9
263,2
263,2
333,8
312,3
295,4
283,3
287,6
265,7
Dataseries Y:
5,5
10,5
15,8
13,3
12
10,3
15
14,7
12,2
10,4
11,8


Summary of computational transaction
Raw Inputview raw input (R code)
Raw Outputview raw output of R engine
Computing time2 seconds
R Server'George Udny Yule' @ 72.249.76.132

\begin{tabular}{lllllllll}
\hline
Summary of computational transaction \tabularnewline
Raw Input & view raw input (R code)  \tabularnewline
Raw Output & view raw output of R engine  \tabularnewline
Computing time & 2 seconds \tabularnewline
R Server & 'George Udny Yule' @ 72.249.76.132 \tabularnewline
\hline
\end{tabular}
%Source: https://freestatistics.org/blog/index.php?pk=24745&T=0

[TABLE]
[ROW][C]Summary of computational transaction[/C][/ROW]
[ROW][C]Raw Input[/C][C]view raw input (R code) [/C][/ROW]
[ROW][C]Raw Output[/C][C]view raw output of R engine [/C][/ROW]
[ROW][C]Computing time[/C][C]2 seconds[/C][/ROW]
[ROW][C]R Server[/C][C]'George Udny Yule' @ 72.249.76.132[/C][/ROW]
[/TABLE]
Source: https://freestatistics.org/blog/index.php?pk=24745&T=0

Globally Unique Identifier (entire table): ba.freestatistics.org/blog/index.php?pk=24745&T=0

As an alternative you can also use a QR Code:  

The GUIDs for individual cells are displayed in the table below:

Summary of computational transaction
Raw Inputview raw input (R code)
Raw Outputview raw output of R engine
Computing time2 seconds
R Server'George Udny Yule' @ 72.249.76.132


Box-Cox Linearity Plot
# observations x11
maximum correlation0.350759326259946
optimal lambda(x)-2
Residual SD (orginial)2.76452194691135
Residual SD (transformed)2.68860692282776

\begin{tabular}{lllllllll}
\hline
Box-Cox Linearity Plot \tabularnewline
# observations x & 11 \tabularnewline
maximum correlation & 0.350759326259946 \tabularnewline
optimal lambda(x) & -2 \tabularnewline
Residual SD (orginial) & 2.76452194691135 \tabularnewline
Residual SD (transformed) & 2.68860692282776 \tabularnewline
\hline
\end{tabular}
%Source: https://freestatistics.org/blog/index.php?pk=24745&T=1

[TABLE]
[ROW][C]Box-Cox Linearity Plot[/C][/ROW]
[ROW][C]# observations x[/C][C]11[/C][/ROW]
[ROW][C]maximum correlation[/C][C]0.350759326259946[/C][/ROW]
[ROW][C]optimal lambda(x)[/C][C]-2[/C][/ROW]
[ROW][C]Residual SD (orginial)[/C][C]2.76452194691135[/C][/ROW]
[ROW][C]Residual SD (transformed)[/C][C]2.68860692282776[/C][/ROW]
[/TABLE]
Source: https://freestatistics.org/blog/index.php?pk=24745&T=1

Globally Unique Identifier (entire table): ba.freestatistics.org/blog/index.php?pk=24745&T=1

As an alternative you can also use a QR Code:  

The GUIDs for individual cells are displayed in the table below:

Box-Cox Linearity Plot
# observations x11
maximum correlation0.350759326259946
optimal lambda(x)-2
Residual SD (orginial)2.76452194691135
Residual SD (transformed)2.68860692282776


Parameters (Session):
Parameters (R input):
R code (references can be found in the software module):
n <- length(x)
c <- array(NA,dim=c(401))
l <- array(NA,dim=c(401))
mx <- 0
mxli <- -999
for (i in 1:401)
{
l[i] <- (i-201)/100
if (l[i] != 0)
{
x1 <- (x^l[i] - 1) / l[i]
} else {
x1 <- log(x)
}
c[i] <- cor(x1,y)
if (mx < abs(c[i]))
{
mx <- abs(c[i])
mxli <- l[i]
}
}
c
mx
mxli
if (mxli != 0)
{
x1 <- (x^mxli - 1) / mxli
} else {
x1 <- log(x)
}
r<-lm(y~x)
se <- sqrt(var(r$residuals))
r1 <- lm(y~x1)
se1 <- sqrt(var(r1$residuals))
bitmap(file='test1.png')
plot(l,c,main='Box-Cox Linearity Plot',xlab='Lambda',ylab='correlation')
grid()
dev.off()
bitmap(file='test2.png')
plot(x,y,main='Linear Fit of Original Data',xlab='x',ylab='y')
abline(r)
grid()
mtext(paste('Residual Standard Deviation = ',se))
dev.off()
bitmap(file='test3.png')
plot(x1,y,main='Linear Fit of Transformed Data',xlab='x',ylab='y')
abline(r1)
grid()
mtext(paste('Residual Standard Deviation = ',se1))
dev.off()
load(file='createtable')
a<-table.start()
a<-table.row.start(a)
a<-table.element(a,'Box-Cox Linearity Plot',2,TRUE)
a<-table.row.end(a)
a<-table.row.start(a)
a<-table.element(a,'# observations x',header=TRUE)
a<-table.element(a,n)
a<-table.row.end(a)
a<-table.row.start(a)
a<-table.element(a,'maximum correlation',header=TRUE)
a<-table.element(a,mx)
a<-table.row.end(a)
a<-table.row.start(a)
a<-table.element(a,'optimal lambda(x)',header=TRUE)
a<-table.element(a,mxli)
a<-table.row.end(a)
a<-table.row.start(a)
a<-table.element(a,'Residual SD (orginial)',header=TRUE)
a<-table.element(a,se)
a<-table.row.end(a)
a<-table.row.start(a)
a<-table.element(a,'Residual SD (transformed)',header=TRUE)
a<-table.element(a,se1)
a<-table.row.end(a)
a<-table.end(a)
table.save(a,file='mytable.tab')