Free Statistics

of Irreproducible Research!

Author's title

Author*The author of this computation has been verified*
R Software Modulerwasp_hierarchicalclustering.wasp
Title produced by softwareHierarchical Clustering
Date of computationThu, 13 Nov 2008 11:06:40 -0700
Cite this page as followsStatistical Computations at FreeStatistics.org, Office for Research Development and Education, URL https://freestatistics.org/blog/index.php?v=date/2008/Nov/13/t1226599692gtqjkjayggmv5gk.htm/, Retrieved Sun, 19 May 2024 09:38:25 +0000
Statistical Computations at FreeStatistics.org, Office for Research Development and Education, URL https://freestatistics.org/blog/index.php?pk=24744, Retrieved Sun, 19 May 2024 09:38:25 +0000
QR Codes:

Original text written by user:
IsPrivate?No (this computation is public)
User-defined keywords
Estimated Impact141
Family? (F = Feedback message, R = changed R code, M = changed R Module, P = changed Parameters, D = changed Data)
F     [Hierarchical Clustering] [Various EDA Topic...] [2008-11-12 18:52:57] [8094ad203a218aaca2d1cea2c78c2d6e]
F    D    [Hierarchical Clustering] [Blok 8 q2 hierarc...] [2008-11-13 18:06:40] [1237f4df7e9be807e4c0a07b90c45721] [Current]
Feedback Forum
2008-11-22 14:48:15 [Peter Van Doninck] [reply
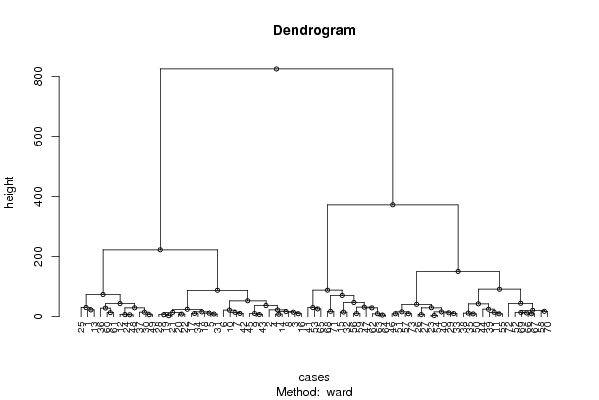
Het klopt dat het dendogram pas in de les besporken werd. Het is echter wel juist getekend. Het dendogram deeldt de gegevens in op basis dat er gelijkenissen zijn. Zoals de link laat zien, worden er op het einde enorm veel categorieën gemaakt. Hieruit kunnen we onderzoeksvragen opstellen om nieuwe inzichten te verkrijgen.
2008-11-22 19:33:07 [c97d2ae59c98cf77a04815c1edffab5a] [reply
Aangzien de grafiek nog niet was besproken in de les, kon ik hier nog geen conclusie over vormen. Bij deze mijn oplossing:
Theorie Dendrogram:
Kunnen er in periodes groepen gemaakt worden die gelijkaardig zijn? De tijdsreeks wordt allereerst opgesplitst in 2 delen (2 vertakkingen vanuit 1 knooppunt), elke vertakking/cluster geeft periodes weer de gelijkaardig zijn. Vb huwelijken: in eerste vertakking zitten alle maanden tot maand 18 en in de tweede vertakking alle volgende maanden. Hieruit kunnen we vaststellen dat er toch een verandering heeft plaats gevonden tussen de 2 clusters en we een patroon kunnen zoeken voor de periodes die zich in dezelfde vertakking bevinden en dus gelijkaardig zijn.
Conclusie:
We kunnen geen opmerkelijk verschil waarnemen tussen de verschillende vertakkingen/clusters. Vb: van periodes in de 20 zitten er zowel in de 1ste (22 en 28) als in de 2de cluster (23 en 29). De periodes zijn eerder op een afwisselende manier verdeeld, waardoor we kunnen dus geen echt patroon kunnen vinden met behulp van de clustering. Dit wil zeggen dat de periodes sterk van elkaar veschillen. Enkel voor de periodes 71,72,73,74 kunnen we besluiten dat deze zich allemaal in de tweede vertakking bevinden en dus allemaal gelijken op elkaar.

Post a new message
Dataseries X:
81.1	92.3	95.5	79.3
96.9	95.5	98.7	117.2
104.3	92.5	115.9	116.9
97.7	89.6	110.4	120.8
102.6	84.3	109.5	96.1
89.9	76.3	92.3	100.8
96	80.7	102.1	105.3
112.7	96.3	112.8	116.1
107.1	81	110.2	112.8
106.2	82.9	98.9	114.5
121	90.3	119	117.2
101.2	74.8	104.3	77.1
83.2	70.1	98.8	80.1
105.1	86.7	109.4	120.3
113.3	86.4	170.3	133.4
99.1	89.9	118	109.4
100.3	88.1	116.9	93.2
93.5	78.8	111.7	91.2
98.8	81.1	116.8	99.2
106.2	85.4	116.1	108.2
98.3	82.6	114.8	101.5
102.1	80.3	110.8	106.9
117.1	81.2	122.8	104.4
101.5	68	104.7	77.9
80.5	67.4	86	60
105.9	91.3	127.2	99.5
109.5	94.9	126.1	95
97.2	82.8	114.6	105.6
114.5	88.6	127.8	102.5
93.5	73.1	105.2	93.3
100.9	76.7	113.1	97.3
121.1	93.2	161	127
116.5	84.9	126.9	111.7
109.3	83.8	117.7	96.4
118.1	93.5	144.9	133
108.3	91.9	119.4	72.2
105.4	69.6	107.1	95.8
116.2	87	142.8	124.1
111.2	90.2	126.2	127.6
105.8	82.7	126.9	110.7
122.7	91.4	179.2	104.6
99.5	74.6	105.3	112.7
107.9	76.1	114.8	115.3
124.6	87.1	125.4	139.4
115	78.4	113.2	119
110.3	81.3	134.4	97.4
132.7	99.3	150	154
99.7	71	100.9	81.5
96.5	73.2	101.8	88.8
118.7	95.6	137.7	127.7
112.9	84	138.7	105.1
130.5	90.8	135.4	114.9
137.9	93.6	153.8	106.4
115	80.9	119.5	104.5
116.8	84.4	123.3	121.6
140.9	97.3	166.4	141.4
120.7	83.5	137.5	99
134.2	88.8	142.2	126.7
147.3	100.7	167	134.1
112.4	69.4	112.3	81.3
107.1	74.6	120.6	88.6
128.4	96.6	154.9	132.7
137.7	96.6	153.4	132.9
135	93.1	156.2	134.4
151	91.8	175.8	103.7
137.4	85.7	131.7	119.7
132.4	79.1	130.1	115
161.3	91.3	161.1	132.9
139.8	84.2	128.2	108.5
146	85.8	140.3	113.9
166.5	94.6	174.9	142
143.3	77.1	111.8	97.7
121	76.5	136.6	92.2


Summary of computational transaction
Raw Inputview raw input (R code)
Raw Outputview raw output of R engine
Computing time2 seconds
R Server'George Udny Yule' @ 72.249.76.132

\begin{tabular}{lllllllll}
\hline
Summary of computational transaction \tabularnewline
Raw Input & view raw input (R code)  \tabularnewline
Raw Output & view raw output of R engine  \tabularnewline
Computing time & 2 seconds \tabularnewline
R Server & 'George Udny Yule' @ 72.249.76.132 \tabularnewline
\hline
\end{tabular}
%Source: https://freestatistics.org/blog/index.php?pk=24744&T=0

[TABLE]
[ROW][C]Summary of computational transaction[/C][/ROW]
[ROW][C]Raw Input[/C][C]view raw input (R code) [/C][/ROW]
[ROW][C]Raw Output[/C][C]view raw output of R engine [/C][/ROW]
[ROW][C]Computing time[/C][C]2 seconds[/C][/ROW]
[ROW][C]R Server[/C][C]'George Udny Yule' @ 72.249.76.132[/C][/ROW]
[/TABLE]
Source: https://freestatistics.org/blog/index.php?pk=24744&T=0

Globally Unique Identifier (entire table): ba.freestatistics.org/blog/index.php?pk=24744&T=0

As an alternative you can also use a QR Code:  

The GUIDs for individual cells are displayed in the table below:

Summary of computational transaction
Raw Inputview raw input (R code)
Raw Outputview raw output of R engine
Computing time2 seconds
R Server'George Udny Yule' @ 72.249.76.132


Summary of Dendrogram
LabelHeight
13.43365694267788
23.92428337406971
35.44334456010272
46.29603049547887
56.38905313798532
66.4643276916905
76.88331315574121
87.07807601999635
97.21526160301898
108.02620707432844
118.52056336165632
128.66314030822541
139.20326029187484
149.50263121456367
159.5827970864461
169.64782797933012
179.65453261426985
189.71905345185425
199.80510071340422
2010.1557865278865
2110.3038827633082
2210.4488765363889
2310.5057127316522
2410.6985980389956
2511.6651205867286
2611.7961713539548
2712.3309058630512
2812.8359134687778
2913.3157801123329
3013.7124045820179
3114.2433681473618
3214.329442128041
3314.4734468895443
3414.7722768289781
3515.0738541527919
3615.3143723345098
3715.7853633822361
3815.8324965218668
3915.9553431340328
4017.0400070818705
4117.6402947821174
4217.7676672638813
4321.175076601454
4422.0116310525778
4522.3608808547375
4622.5561521541242
4724.5392516742178
4824.7426288670359
4925.809688103501
5028.5722657955422
5129.3010750020238
5229.3188961397423
5329.637081652184
5430.2350138060015
5530.5107647041646
5631.5788413617875
5737.1592855235147
5841.1026523861353
5942.6072937177633
6043.6016258266556
6144.5971306721788
6247.1644635738112
6352.8070735794771
6470.6672846101821
6573.8131078854509
6687.7772186638722
6788.2456640827598
6891.3729454667284
69150.640997487375
70222.730657120609
71372.614554672102
72825.031411230738

\begin{tabular}{lllllllll}
\hline
Summary of Dendrogram \tabularnewline
Label & Height \tabularnewline
1 & 3.43365694267788 \tabularnewline
2 & 3.92428337406971 \tabularnewline
3 & 5.44334456010272 \tabularnewline
4 & 6.29603049547887 \tabularnewline
5 & 6.38905313798532 \tabularnewline
6 & 6.4643276916905 \tabularnewline
7 & 6.88331315574121 \tabularnewline
8 & 7.07807601999635 \tabularnewline
9 & 7.21526160301898 \tabularnewline
10 & 8.02620707432844 \tabularnewline
11 & 8.52056336165632 \tabularnewline
12 & 8.66314030822541 \tabularnewline
13 & 9.20326029187484 \tabularnewline
14 & 9.50263121456367 \tabularnewline
15 & 9.5827970864461 \tabularnewline
16 & 9.64782797933012 \tabularnewline
17 & 9.65453261426985 \tabularnewline
18 & 9.71905345185425 \tabularnewline
19 & 9.80510071340422 \tabularnewline
20 & 10.1557865278865 \tabularnewline
21 & 10.3038827633082 \tabularnewline
22 & 10.4488765363889 \tabularnewline
23 & 10.5057127316522 \tabularnewline
24 & 10.6985980389956 \tabularnewline
25 & 11.6651205867286 \tabularnewline
26 & 11.7961713539548 \tabularnewline
27 & 12.3309058630512 \tabularnewline
28 & 12.8359134687778 \tabularnewline
29 & 13.3157801123329 \tabularnewline
30 & 13.7124045820179 \tabularnewline
31 & 14.2433681473618 \tabularnewline
32 & 14.329442128041 \tabularnewline
33 & 14.4734468895443 \tabularnewline
34 & 14.7722768289781 \tabularnewline
35 & 15.0738541527919 \tabularnewline
36 & 15.3143723345098 \tabularnewline
37 & 15.7853633822361 \tabularnewline
38 & 15.8324965218668 \tabularnewline
39 & 15.9553431340328 \tabularnewline
40 & 17.0400070818705 \tabularnewline
41 & 17.6402947821174 \tabularnewline
42 & 17.7676672638813 \tabularnewline
43 & 21.175076601454 \tabularnewline
44 & 22.0116310525778 \tabularnewline
45 & 22.3608808547375 \tabularnewline
46 & 22.5561521541242 \tabularnewline
47 & 24.5392516742178 \tabularnewline
48 & 24.7426288670359 \tabularnewline
49 & 25.809688103501 \tabularnewline
50 & 28.5722657955422 \tabularnewline
51 & 29.3010750020238 \tabularnewline
52 & 29.3188961397423 \tabularnewline
53 & 29.637081652184 \tabularnewline
54 & 30.2350138060015 \tabularnewline
55 & 30.5107647041646 \tabularnewline
56 & 31.5788413617875 \tabularnewline
57 & 37.1592855235147 \tabularnewline
58 & 41.1026523861353 \tabularnewline
59 & 42.6072937177633 \tabularnewline
60 & 43.6016258266556 \tabularnewline
61 & 44.5971306721788 \tabularnewline
62 & 47.1644635738112 \tabularnewline
63 & 52.8070735794771 \tabularnewline
64 & 70.6672846101821 \tabularnewline
65 & 73.8131078854509 \tabularnewline
66 & 87.7772186638722 \tabularnewline
67 & 88.2456640827598 \tabularnewline
68 & 91.3729454667284 \tabularnewline
69 & 150.640997487375 \tabularnewline
70 & 222.730657120609 \tabularnewline
71 & 372.614554672102 \tabularnewline
72 & 825.031411230738 \tabularnewline
\hline
\end{tabular}
%Source: https://freestatistics.org/blog/index.php?pk=24744&T=1

[TABLE]
[ROW][C]Summary of Dendrogram[/C][/ROW]
[ROW][C]Label[/C][C]Height[/C][/ROW]
[ROW][C]1[/C][C]3.43365694267788[/C][/ROW]
[ROW][C]2[/C][C]3.92428337406971[/C][/ROW]
[ROW][C]3[/C][C]5.44334456010272[/C][/ROW]
[ROW][C]4[/C][C]6.29603049547887[/C][/ROW]
[ROW][C]5[/C][C]6.38905313798532[/C][/ROW]
[ROW][C]6[/C][C]6.4643276916905[/C][/ROW]
[ROW][C]7[/C][C]6.88331315574121[/C][/ROW]
[ROW][C]8[/C][C]7.07807601999635[/C][/ROW]
[ROW][C]9[/C][C]7.21526160301898[/C][/ROW]
[ROW][C]10[/C][C]8.02620707432844[/C][/ROW]
[ROW][C]11[/C][C]8.52056336165632[/C][/ROW]
[ROW][C]12[/C][C]8.66314030822541[/C][/ROW]
[ROW][C]13[/C][C]9.20326029187484[/C][/ROW]
[ROW][C]14[/C][C]9.50263121456367[/C][/ROW]
[ROW][C]15[/C][C]9.5827970864461[/C][/ROW]
[ROW][C]16[/C][C]9.64782797933012[/C][/ROW]
[ROW][C]17[/C][C]9.65453261426985[/C][/ROW]
[ROW][C]18[/C][C]9.71905345185425[/C][/ROW]
[ROW][C]19[/C][C]9.80510071340422[/C][/ROW]
[ROW][C]20[/C][C]10.1557865278865[/C][/ROW]
[ROW][C]21[/C][C]10.3038827633082[/C][/ROW]
[ROW][C]22[/C][C]10.4488765363889[/C][/ROW]
[ROW][C]23[/C][C]10.5057127316522[/C][/ROW]
[ROW][C]24[/C][C]10.6985980389956[/C][/ROW]
[ROW][C]25[/C][C]11.6651205867286[/C][/ROW]
[ROW][C]26[/C][C]11.7961713539548[/C][/ROW]
[ROW][C]27[/C][C]12.3309058630512[/C][/ROW]
[ROW][C]28[/C][C]12.8359134687778[/C][/ROW]
[ROW][C]29[/C][C]13.3157801123329[/C][/ROW]
[ROW][C]30[/C][C]13.7124045820179[/C][/ROW]
[ROW][C]31[/C][C]14.2433681473618[/C][/ROW]
[ROW][C]32[/C][C]14.329442128041[/C][/ROW]
[ROW][C]33[/C][C]14.4734468895443[/C][/ROW]
[ROW][C]34[/C][C]14.7722768289781[/C][/ROW]
[ROW][C]35[/C][C]15.0738541527919[/C][/ROW]
[ROW][C]36[/C][C]15.3143723345098[/C][/ROW]
[ROW][C]37[/C][C]15.7853633822361[/C][/ROW]
[ROW][C]38[/C][C]15.8324965218668[/C][/ROW]
[ROW][C]39[/C][C]15.9553431340328[/C][/ROW]
[ROW][C]40[/C][C]17.0400070818705[/C][/ROW]
[ROW][C]41[/C][C]17.6402947821174[/C][/ROW]
[ROW][C]42[/C][C]17.7676672638813[/C][/ROW]
[ROW][C]43[/C][C]21.175076601454[/C][/ROW]
[ROW][C]44[/C][C]22.0116310525778[/C][/ROW]
[ROW][C]45[/C][C]22.3608808547375[/C][/ROW]
[ROW][C]46[/C][C]22.5561521541242[/C][/ROW]
[ROW][C]47[/C][C]24.5392516742178[/C][/ROW]
[ROW][C]48[/C][C]24.7426288670359[/C][/ROW]
[ROW][C]49[/C][C]25.809688103501[/C][/ROW]
[ROW][C]50[/C][C]28.5722657955422[/C][/ROW]
[ROW][C]51[/C][C]29.3010750020238[/C][/ROW]
[ROW][C]52[/C][C]29.3188961397423[/C][/ROW]
[ROW][C]53[/C][C]29.637081652184[/C][/ROW]
[ROW][C]54[/C][C]30.2350138060015[/C][/ROW]
[ROW][C]55[/C][C]30.5107647041646[/C][/ROW]
[ROW][C]56[/C][C]31.5788413617875[/C][/ROW]
[ROW][C]57[/C][C]37.1592855235147[/C][/ROW]
[ROW][C]58[/C][C]41.1026523861353[/C][/ROW]
[ROW][C]59[/C][C]42.6072937177633[/C][/ROW]
[ROW][C]60[/C][C]43.6016258266556[/C][/ROW]
[ROW][C]61[/C][C]44.5971306721788[/C][/ROW]
[ROW][C]62[/C][C]47.1644635738112[/C][/ROW]
[ROW][C]63[/C][C]52.8070735794771[/C][/ROW]
[ROW][C]64[/C][C]70.6672846101821[/C][/ROW]
[ROW][C]65[/C][C]73.8131078854509[/C][/ROW]
[ROW][C]66[/C][C]87.7772186638722[/C][/ROW]
[ROW][C]67[/C][C]88.2456640827598[/C][/ROW]
[ROW][C]68[/C][C]91.3729454667284[/C][/ROW]
[ROW][C]69[/C][C]150.640997487375[/C][/ROW]
[ROW][C]70[/C][C]222.730657120609[/C][/ROW]
[ROW][C]71[/C][C]372.614554672102[/C][/ROW]
[ROW][C]72[/C][C]825.031411230738[/C][/ROW]
[/TABLE]
Source: https://freestatistics.org/blog/index.php?pk=24744&T=1

Globally Unique Identifier (entire table): ba.freestatistics.org/blog/index.php?pk=24744&T=1

As an alternative you can also use a QR Code:  

The GUIDs for individual cells are displayed in the table below:

Summary of Dendrogram
LabelHeight
13.43365694267788
23.92428337406971
35.44334456010272
46.29603049547887
56.38905313798532
66.4643276916905
76.88331315574121
87.07807601999635
97.21526160301898
108.02620707432844
118.52056336165632
128.66314030822541
139.20326029187484
149.50263121456367
159.5827970864461
169.64782797933012
179.65453261426985
189.71905345185425
199.80510071340422
2010.1557865278865
2110.3038827633082
2210.4488765363889
2310.5057127316522
2410.6985980389956
2511.6651205867286
2611.7961713539548
2712.3309058630512
2812.8359134687778
2913.3157801123329
3013.7124045820179
3114.2433681473618
3214.329442128041
3314.4734468895443
3414.7722768289781
3515.0738541527919
3615.3143723345098
3715.7853633822361
3815.8324965218668
3915.9553431340328
4017.0400070818705
4117.6402947821174
4217.7676672638813
4321.175076601454
4422.0116310525778
4522.3608808547375
4622.5561521541242
4724.5392516742178
4824.7426288670359
4925.809688103501
5028.5722657955422
5129.3010750020238
5229.3188961397423
5329.637081652184
5430.2350138060015
5530.5107647041646
5631.5788413617875
5737.1592855235147
5841.1026523861353
5942.6072937177633
6043.6016258266556
6144.5971306721788
6247.1644635738112
6352.8070735794771
6470.6672846101821
6573.8131078854509
6687.7772186638722
6788.2456640827598
6891.3729454667284
69150.640997487375
70222.730657120609
71372.614554672102
72825.031411230738


Parameters (Session):
par1 = ward ; par2 = ALL ; par3 = FALSE ; par4 = FALSE ;
Parameters (R input):
par1 = ward ; par2 = ALL ; par3 = FALSE ; par4 = FALSE ;
R code (references can be found in the software module):
par3 <- as.logical(par3)
par4 <- as.logical(par4)
if (par3 == 'TRUE'){
dum = xlab
xlab = ylab
ylab = dum
}
x <- t(y)
hc <- hclust(dist(x),method=par1)
d <- as.dendrogram(hc)
str(d)
mysub <- paste('Method: ',par1)
bitmap(file='test1.png')
if (par4 == 'TRUE'){
plot(d,main=main,ylab=ylab,xlab=xlab,horiz=par3, nodePar=list(pch = c(1,NA), cex=0.8, lab.cex = 0.8),type='t',center=T, sub=mysub)
} else {
plot(d,main=main,ylab=ylab,xlab=xlab,horiz=par3, nodePar=list(pch = c(1,NA), cex=0.8, lab.cex = 0.8), sub=mysub)
}
dev.off()
if (par2 != 'ALL'){
if (par3 == 'TRUE'){
ylab = 'cluster'
} else {
xlab = 'cluster'
}
par2 <- as.numeric(par2)
memb <- cutree(hc, k = par2)
cent <- NULL
for(k in 1:par2){
cent <- rbind(cent, colMeans(x[memb == k, , drop = FALSE]))
}
hc1 <- hclust(dist(cent),method=par1, members = table(memb))
de <- as.dendrogram(hc1)
bitmap(file='test2.png')
if (par4 == 'TRUE'){
plot(de,main=main,ylab=ylab,xlab=xlab,horiz=par3, nodePar=list(pch = c(1,NA), cex=0.8, lab.cex = 0.8),type='t',center=T, sub=mysub)
} else {
plot(de,main=main,ylab=ylab,xlab=xlab,horiz=par3, nodePar=list(pch = c(1,NA), cex=0.8, lab.cex = 0.8), sub=mysub)
}
dev.off()
str(de)
}
load(file='createtable')
a<-table.start()
a<-table.row.start(a)
a<-table.element(a,'Summary of Dendrogram',2,TRUE)
a<-table.row.end(a)
a<-table.row.start(a)
a<-table.element(a,'Label',header=TRUE)
a<-table.element(a,'Height',header=TRUE)
a<-table.row.end(a)
num <- length(x[,1])-1
for (i in 1:num)
{
a<-table.row.start(a)
a<-table.element(a,hc$labels[i])
a<-table.element(a,hc$height[i])
a<-table.row.end(a)
}
a<-table.end(a)
table.save(a,file='mytable1.tab')
if (par2 != 'ALL'){
a<-table.start()
a<-table.row.start(a)
a<-table.element(a,'Summary of Cut Dendrogram',2,TRUE)
a<-table.row.end(a)
a<-table.row.start(a)
a<-table.element(a,'Label',header=TRUE)
a<-table.element(a,'Height',header=TRUE)
a<-table.row.end(a)
num <- par2-1
for (i in 1:num)
{
a<-table.row.start(a)
a<-table.element(a,i)
a<-table.element(a,hc1$height[i])
a<-table.row.end(a)
}
a<-table.end(a)
table.save(a,file='mytable2.tab')
}