Free Statistics

of Irreproducible Research!

Author's title

Author*Unverified author*
R Software Modulerwasp_hierarchicalclustering.wasp
Title produced by softwareHierarchical Clustering
Date of computationThu, 13 Nov 2008 10:35:51 -0700
Cite this page as followsStatistical Computations at FreeStatistics.org, Office for Research Development and Education, URL https://freestatistics.org/blog/index.php?v=date/2008/Nov/13/t1226597853e97jj9jxlae0he0.htm/, Retrieved Sun, 19 May 2024 12:42:20 +0000
Statistical Computations at FreeStatistics.org, Office for Research Development and Education, URL https://freestatistics.org/blog/index.php?pk=24727, Retrieved Sun, 19 May 2024 12:42:20 +0000
QR Codes:

Original text written by user:
IsPrivate?No (this computation is public)
User-defined keywords
Estimated Impact114
Family? (F = Feedback message, R = changed R code, M = changed R Module, P = changed Parameters, D = changed Data)
-       [Hierarchical Clustering] [EDA Topics] [2008-11-13 17:35:51] [51c0bf2e8d2e36d7824d95d26ff0a48d] [Current]
Feedback Forum

Post a new message
Dataseries X:
96,2	100,4	105,4	61,1	112,3
103,4	123,3	115,2	65,1	123,2
117,1	156,6	124,5	72,5	132,6
110,3	136,2	112,3	70,6	118,6
116,3	147,5	127,5	81,9	134,4
112,5	143,8	120,6	72	128,2
111,8	135,8	117,5	70,9	124,8
112,1	121,6	117,7	71,1	124,9
93,3	128	120,4	65,1	129,2
109,1	129,7	125	78,1	132,2
118,1	136,2	131,6	92	137,4
108,1	130,5	121,1	77,8	127,7
99,9	99,2	114,2	63,3	122,2


Summary of computational transaction
Raw Inputview raw input (R code)
Raw Outputview raw output of R engine
Computing time2 seconds
R Server'Gwilym Jenkins' @ 72.249.127.135

\begin{tabular}{lllllllll}
\hline
Summary of computational transaction \tabularnewline
Raw Input & view raw input (R code)  \tabularnewline
Raw Output & view raw output of R engine  \tabularnewline
Computing time & 2 seconds \tabularnewline
R Server & 'Gwilym Jenkins' @ 72.249.127.135 \tabularnewline
\hline
\end{tabular}
%Source: https://freestatistics.org/blog/index.php?pk=24727&T=0

[TABLE]
[ROW][C]Summary of computational transaction[/C][/ROW]
[ROW][C]Raw Input[/C][C]view raw input (R code) [/C][/ROW]
[ROW][C]Raw Output[/C][C]view raw output of R engine [/C][/ROW]
[ROW][C]Computing time[/C][C]2 seconds[/C][/ROW]
[ROW][C]R Server[/C][C]'Gwilym Jenkins' @ 72.249.127.135[/C][/ROW]
[/TABLE]
Source: https://freestatistics.org/blog/index.php?pk=24727&T=0

Globally Unique Identifier (entire table): ba.freestatistics.org/blog/index.php?pk=24727&T=0

As an alternative you can also use a QR Code:  

The GUIDs for individual cells are displayed in the table below:

Summary of computational transaction
Raw Inputview raw input (R code)
Raw Outputview raw output of R engine
Computing time2 seconds
R Server'Gwilym Jenkins' @ 72.249.127.135


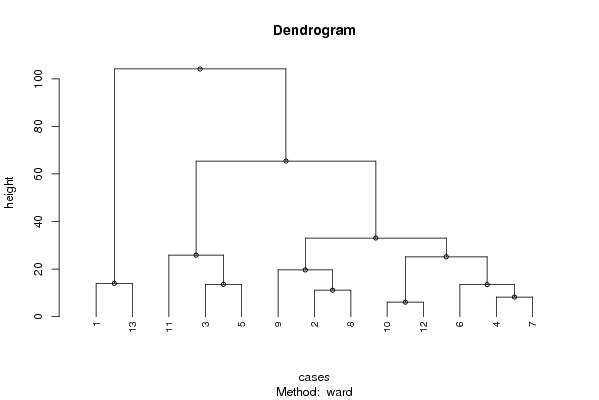
Summary of Dendrogram
LabelHeight
16.09836043539572
28.24499848392952
311.1229492491875
413.4788186966273
513.5665028655140
613.9792703672259
719.6512055868037
825.1872891400443
925.8751957875344
1033.0667276682364
1165.4231671448975
12104.165751896366

\begin{tabular}{lllllllll}
\hline
Summary of Dendrogram \tabularnewline
Label & Height \tabularnewline
1 & 6.09836043539572 \tabularnewline
2 & 8.24499848392952 \tabularnewline
3 & 11.1229492491875 \tabularnewline
4 & 13.4788186966273 \tabularnewline
5 & 13.5665028655140 \tabularnewline
6 & 13.9792703672259 \tabularnewline
7 & 19.6512055868037 \tabularnewline
8 & 25.1872891400443 \tabularnewline
9 & 25.8751957875344 \tabularnewline
10 & 33.0667276682364 \tabularnewline
11 & 65.4231671448975 \tabularnewline
12 & 104.165751896366 \tabularnewline
\hline
\end{tabular}
%Source: https://freestatistics.org/blog/index.php?pk=24727&T=1

[TABLE]
[ROW][C]Summary of Dendrogram[/C][/ROW]
[ROW][C]Label[/C][C]Height[/C][/ROW]
[ROW][C]1[/C][C]6.09836043539572[/C][/ROW]
[ROW][C]2[/C][C]8.24499848392952[/C][/ROW]
[ROW][C]3[/C][C]11.1229492491875[/C][/ROW]
[ROW][C]4[/C][C]13.4788186966273[/C][/ROW]
[ROW][C]5[/C][C]13.5665028655140[/C][/ROW]
[ROW][C]6[/C][C]13.9792703672259[/C][/ROW]
[ROW][C]7[/C][C]19.6512055868037[/C][/ROW]
[ROW][C]8[/C][C]25.1872891400443[/C][/ROW]
[ROW][C]9[/C][C]25.8751957875344[/C][/ROW]
[ROW][C]10[/C][C]33.0667276682364[/C][/ROW]
[ROW][C]11[/C][C]65.4231671448975[/C][/ROW]
[ROW][C]12[/C][C]104.165751896366[/C][/ROW]
[/TABLE]
Source: https://freestatistics.org/blog/index.php?pk=24727&T=1

Globally Unique Identifier (entire table): ba.freestatistics.org/blog/index.php?pk=24727&T=1

As an alternative you can also use a QR Code:  

The GUIDs for individual cells are displayed in the table below:

Summary of Dendrogram
LabelHeight
16.09836043539572
28.24499848392952
311.1229492491875
413.4788186966273
513.5665028655140
613.9792703672259
719.6512055868037
825.1872891400443
925.8751957875344
1033.0667276682364
1165.4231671448975
12104.165751896366


Parameters (Session):
par1 = ward ; par2 = ALL ; par3 = FALSE ; par4 = FALSE ;
Parameters (R input):
par1 = ward ; par2 = ALL ; par3 = FALSE ; par4 = FALSE ;
R code (references can be found in the software module):
par3 <- as.logical(par3)
par4 <- as.logical(par4)
if (par3 == 'TRUE'){
dum = xlab
xlab = ylab
ylab = dum
}
x <- t(y)
hc <- hclust(dist(x),method=par1)
d <- as.dendrogram(hc)
str(d)
mysub <- paste('Method: ',par1)
bitmap(file='test1.png')
if (par4 == 'TRUE'){
plot(d,main=main,ylab=ylab,xlab=xlab,horiz=par3, nodePar=list(pch = c(1,NA), cex=0.8, lab.cex = 0.8),type='t',center=T, sub=mysub)
} else {
plot(d,main=main,ylab=ylab,xlab=xlab,horiz=par3, nodePar=list(pch = c(1,NA), cex=0.8, lab.cex = 0.8), sub=mysub)
}
dev.off()
if (par2 != 'ALL'){
if (par3 == 'TRUE'){
ylab = 'cluster'
} else {
xlab = 'cluster'
}
par2 <- as.numeric(par2)
memb <- cutree(hc, k = par2)
cent <- NULL
for(k in 1:par2){
cent <- rbind(cent, colMeans(x[memb == k, , drop = FALSE]))
}
hc1 <- hclust(dist(cent),method=par1, members = table(memb))
de <- as.dendrogram(hc1)
bitmap(file='test2.png')
if (par4 == 'TRUE'){
plot(de,main=main,ylab=ylab,xlab=xlab,horiz=par3, nodePar=list(pch = c(1,NA), cex=0.8, lab.cex = 0.8),type='t',center=T, sub=mysub)
} else {
plot(de,main=main,ylab=ylab,xlab=xlab,horiz=par3, nodePar=list(pch = c(1,NA), cex=0.8, lab.cex = 0.8), sub=mysub)
}
dev.off()
str(de)
}
load(file='createtable')
a<-table.start()
a<-table.row.start(a)
a<-table.element(a,'Summary of Dendrogram',2,TRUE)
a<-table.row.end(a)
a<-table.row.start(a)
a<-table.element(a,'Label',header=TRUE)
a<-table.element(a,'Height',header=TRUE)
a<-table.row.end(a)
num <- length(x[,1])-1
for (i in 1:num)
{
a<-table.row.start(a)
a<-table.element(a,hc$labels[i])
a<-table.element(a,hc$height[i])
a<-table.row.end(a)
}
a<-table.end(a)
table.save(a,file='mytable1.tab')
if (par2 != 'ALL'){
a<-table.start()
a<-table.row.start(a)
a<-table.element(a,'Summary of Cut Dendrogram',2,TRUE)
a<-table.row.end(a)
a<-table.row.start(a)
a<-table.element(a,'Label',header=TRUE)
a<-table.element(a,'Height',header=TRUE)
a<-table.row.end(a)
num <- par2-1
for (i in 1:num)
{
a<-table.row.start(a)
a<-table.element(a,i)
a<-table.element(a,hc1$height[i])
a<-table.row.end(a)
}
a<-table.end(a)
table.save(a,file='mytable2.tab')
}