Free Statistics

of Irreproducible Research!

Author's title

Author*Unverified author*
R Software Modulerwasp_boxcoxlin.wasp
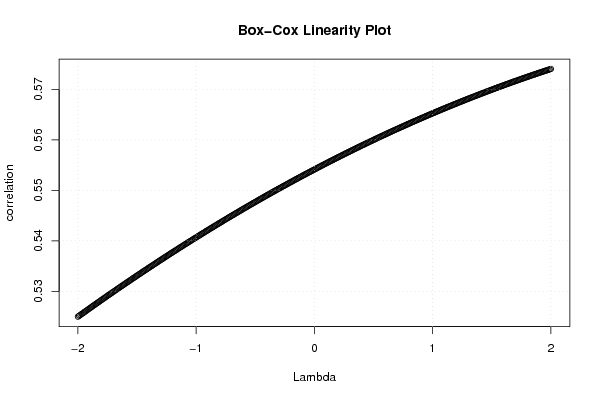
Title produced by softwareBox-Cox Linearity Plot
Date of computationThu, 13 Nov 2008 10:03:45 -0700
Cite this page as followsStatistical Computations at FreeStatistics.org, Office for Research Development and Education, URL https://freestatistics.org/blog/index.php?v=date/2008/Nov/13/t1226595853z4x7p4egg2z0qvh.htm/, Retrieved Sun, 19 May 2024 11:36:48 +0000
Statistical Computations at FreeStatistics.org, Office for Research Development and Education, URL https://freestatistics.org/blog/index.php?pk=24709, Retrieved Sun, 19 May 2024 11:36:48 +0000
QR Codes:

Original text written by user:
IsPrivate?No (this computation is public)
User-defined keywords
Estimated Impact165
Family? (F = Feedback message, R = changed R code, M = changed R Module, P = changed Parameters, D = changed Data)
F     [Box-Cox Linearity Plot] [Toon Wouters] [2008-11-11 18:55:52] [6610d6fd8f463fb18a844c14dc2c3579]
F R       [Box-Cox Linearity Plot] [various EDA Q3 Ya...] [2008-11-13 17:03:45] [51254d789fff0741e6503951f574c682] [Current]
Feedback Forum
2008-11-15 14:31:26 [Maarten Van Gucht] [reply
De student heeft hier een goede conclusie. Met de box-cox linearity plot kun je inderdaad de X transformeren om een betere fit te krijgen. In de box-cox linearity plot krijg je ofwel een stijgende of een dalende lijn.
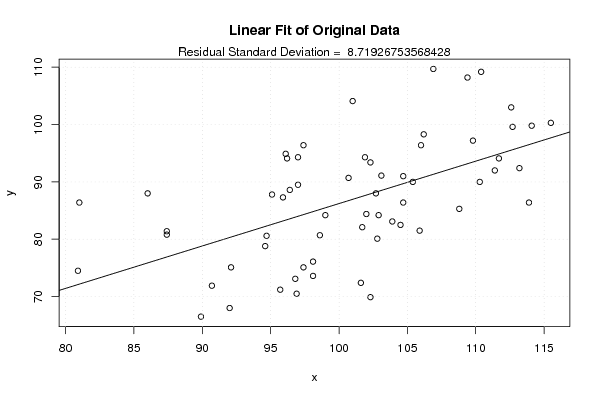
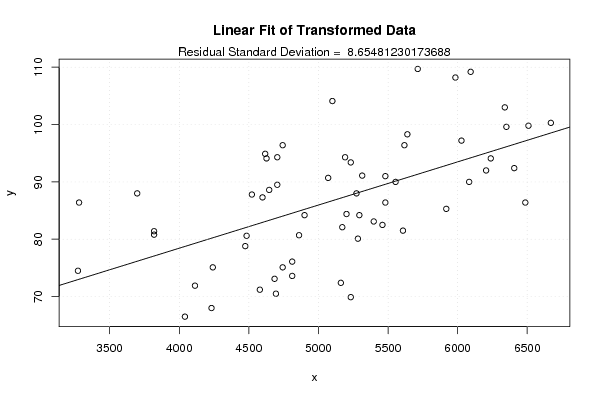
In een scatterplot krijg je meestal 1 rechte door de waarnemingen heen. Deze is de regressilijn (de optimale lijn door de punten) maar deze is altijd recht. De box-cox transponeert! => voor een beter verband. dit is ook bewezen door de student. Wat we meestal hopen te zien is een stijgende kromme. Dit wil zeggen dat er een maximum is (meestal in 2).
De waarden op de X-as varieren tussen de -2 en de 2. Op de Y-as staat de correlatie. hoe kleiner de correlatie, des te minder wijziging in de getransponeerde scatterplot.
2008-11-20 14:57:03 [Hannes Van Hoof] [reply
Goede grafieken en een correcte conclusie, er had eventueel nog wel kunnen bijstaan dat de transformatie hier niet echt nuttig is aangezien de ze niet veel wijzigt.
2008-11-22 12:25:36 [Peter Van Doninck] [reply
De student heeft de box-cox correct toegepast. Er kan nog toegevoegd worden dat de transformatie niet echt veel aan de gegevens wijzigt, waardoor deze eigenlijk zinloos is. Dit wordt ook weerspiegeld in de quasi rechte die we verkrijgen. In de les werd daarover gezegd dat dan een transformatie zinloos is, hoewel er hier zeker dient gezegd te worden dat de rechte niet volledig recht is!!! Er is dus zeer weinig effect door het toepassen van de box-cox. Wel is er, zoals de student opmerkt, een positief verband.

Post a new message
Dataseries X:
110.40
96.40
101.90
106.20
81.00
94.70
101.00
109.40
102.30
90.70
96.20
96.10
106.00
103.10
102.00
104.70
86.00
92.10
106.90
112.60
101.70
92.00
97.40
97.00
105.40
102.70
98.10
104.50
87.40
89.90
109.80
111.70
98.60
96.90
95.10
97.00
112.70
102.90
97.40
111.40
87.40
96.80
114.10
110.30
103.90
101.60
94.60
95.90
104.70
102.80
98.10
113.90
80.90
95.70
113.20
105.90
108.80
102.30
99.00
100.70
115.50
Dataseries Y:
109.20
88.60
94.30
98.30
86.40
80.60
104.10
108.20
93.40
71.90
94.10
94.90
96.40
91.10
84.40
86.40
88.00
75.10
109.70
103.00
82.10
68.00
96.40
94.30
90.00
88.00
76.10
82.50
81.40
66.50
97.20
94.10
80.70
70.50
87.80
89.50
99.60
84.20
75.10
92.00
80.80
73.10
99.80
90.00
83.10
72.40
78.80
87.30
91.00
80.10
73.60
86.40
74.50
71.20
92.40
81.50
85.30
69.90
84.20
90.70
100.30


Summary of computational transaction
Raw Inputview raw input (R code)
Raw Outputview raw output of R engine
Computing time2 seconds
R Server'George Udny Yule' @ 72.249.76.132

\begin{tabular}{lllllllll}
\hline
Summary of computational transaction \tabularnewline
Raw Input & view raw input (R code)  \tabularnewline
Raw Output & view raw output of R engine  \tabularnewline
Computing time & 2 seconds \tabularnewline
R Server & 'George Udny Yule' @ 72.249.76.132 \tabularnewline
\hline
\end{tabular}
%Source: https://freestatistics.org/blog/index.php?pk=24709&T=0

[TABLE]
[ROW][C]Summary of computational transaction[/C][/ROW]
[ROW][C]Raw Input[/C][C]view raw input (R code) [/C][/ROW]
[ROW][C]Raw Output[/C][C]view raw output of R engine [/C][/ROW]
[ROW][C]Computing time[/C][C]2 seconds[/C][/ROW]
[ROW][C]R Server[/C][C]'George Udny Yule' @ 72.249.76.132[/C][/ROW]
[/TABLE]
Source: https://freestatistics.org/blog/index.php?pk=24709&T=0

Globally Unique Identifier (entire table): ba.freestatistics.org/blog/index.php?pk=24709&T=0

As an alternative you can also use a QR Code:  

The GUIDs for individual cells are displayed in the table below:

Summary of computational transaction
Raw Inputview raw input (R code)
Raw Outputview raw output of R engine
Computing time2 seconds
R Server'George Udny Yule' @ 72.249.76.132


Box-Cox Linearity Plot
# observations x61
maximum correlation0.574057467611171
optimal lambda(x)2
Residual SD (orginial)8.71926753568428
Residual SD (transformed)8.65481230173688

\begin{tabular}{lllllllll}
\hline
Box-Cox Linearity Plot \tabularnewline
# observations x & 61 \tabularnewline
maximum correlation & 0.574057467611171 \tabularnewline
optimal lambda(x) & 2 \tabularnewline
Residual SD (orginial) & 8.71926753568428 \tabularnewline
Residual SD (transformed) & 8.65481230173688 \tabularnewline
\hline
\end{tabular}
%Source: https://freestatistics.org/blog/index.php?pk=24709&T=1

[TABLE]
[ROW][C]Box-Cox Linearity Plot[/C][/ROW]
[ROW][C]# observations x[/C][C]61[/C][/ROW]
[ROW][C]maximum correlation[/C][C]0.574057467611171[/C][/ROW]
[ROW][C]optimal lambda(x)[/C][C]2[/C][/ROW]
[ROW][C]Residual SD (orginial)[/C][C]8.71926753568428[/C][/ROW]
[ROW][C]Residual SD (transformed)[/C][C]8.65481230173688[/C][/ROW]
[/TABLE]
Source: https://freestatistics.org/blog/index.php?pk=24709&T=1

Globally Unique Identifier (entire table): ba.freestatistics.org/blog/index.php?pk=24709&T=1

As an alternative you can also use a QR Code:  

The GUIDs for individual cells are displayed in the table below:

Box-Cox Linearity Plot
# observations x61
maximum correlation0.574057467611171
optimal lambda(x)2
Residual SD (orginial)8.71926753568428
Residual SD (transformed)8.65481230173688


Parameters (Session):
Parameters (R input):
R code (references can be found in the software module):
n <- length(x)
c <- array(NA,dim=c(401))
l <- array(NA,dim=c(401))
mx <- 0
mxli <- -999
for (i in 1:401)
{
l[i] <- (i-201)/100
if (l[i] != 0)
{
x1 <- (x^l[i] - 1) / l[i]
} else {
x1 <- log(x)
}
c[i] <- cor(x1,y)
if (mx < abs(c[i]))
{
mx <- abs(c[i])
mxli <- l[i]
}
}
c
mx
mxli
if (mxli != 0)
{
x1 <- (x^mxli - 1) / mxli
} else {
x1 <- log(x)
}
r<-lm(y~x)
se <- sqrt(var(r$residuals))
r1 <- lm(y~x1)
se1 <- sqrt(var(r1$residuals))
bitmap(file='test1.png')
plot(l,c,main='Box-Cox Linearity Plot',xlab='Lambda',ylab='correlation')
grid()
dev.off()
bitmap(file='test2.png')
plot(x,y,main='Linear Fit of Original Data',xlab='x',ylab='y')
abline(r)
grid()
mtext(paste('Residual Standard Deviation = ',se))
dev.off()
bitmap(file='test3.png')
plot(x1,y,main='Linear Fit of Transformed Data',xlab='x',ylab='y')
abline(r1)
grid()
mtext(paste('Residual Standard Deviation = ',se1))
dev.off()
load(file='createtable')
a<-table.start()
a<-table.row.start(a)
a<-table.element(a,'Box-Cox Linearity Plot',2,TRUE)
a<-table.row.end(a)
a<-table.row.start(a)
a<-table.element(a,'# observations x',header=TRUE)
a<-table.element(a,n)
a<-table.row.end(a)
a<-table.row.start(a)
a<-table.element(a,'maximum correlation',header=TRUE)
a<-table.element(a,mx)
a<-table.row.end(a)
a<-table.row.start(a)
a<-table.element(a,'optimal lambda(x)',header=TRUE)
a<-table.element(a,mxli)
a<-table.row.end(a)
a<-table.row.start(a)
a<-table.element(a,'Residual SD (orginial)',header=TRUE)
a<-table.element(a,se)
a<-table.row.end(a)
a<-table.row.start(a)
a<-table.element(a,'Residual SD (transformed)',header=TRUE)
a<-table.element(a,se1)
a<-table.row.end(a)
a<-table.end(a)
table.save(a,file='mytable.tab')