Free Statistics

of Irreproducible Research!

Author's title

Author*Unverified author*
R Software Modulerwasp_cloud.wasp
Title produced by softwareTrivariate Scatterplots
Date of computationThu, 13 Nov 2008 09:58:37 -0700
Cite this page as followsStatistical Computations at FreeStatistics.org, Office for Research Development and Education, URL https://freestatistics.org/blog/index.php?v=date/2008/Nov/13/t12265955522jy95n0y9nzhxdv.htm/, Retrieved Sun, 19 May 2024 12:18:42 +0000
Statistical Computations at FreeStatistics.org, Office for Research Development and Education, URL https://freestatistics.org/blog/index.php?pk=24706, Retrieved Sun, 19 May 2024 12:18:42 +0000
QR Codes:

Original text written by user:
IsPrivate?No (this computation is public)
User-defined keywords
Estimated Impact150
Family? (F = Feedback message, R = changed R code, M = changed R Module, P = changed Parameters, D = changed Data)
F     [Trivariate Scatterplots] [Toon Wouters] [2008-11-11 17:08:50] [6610d6fd8f463fb18a844c14dc2c3579]
F         [Trivariate Scatterplots] [various EDA Q1.2 ...] [2008-11-13 16:58:37] [51254d789fff0741e6503951f574c682] [Current]
Feedback Forum
2008-11-15 14:24:06 [Maarten Van Gucht] [reply
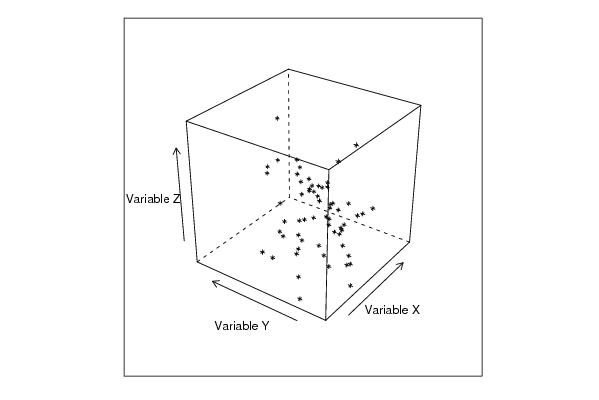
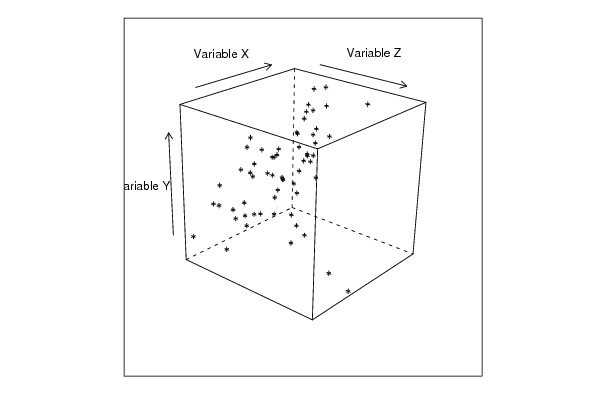
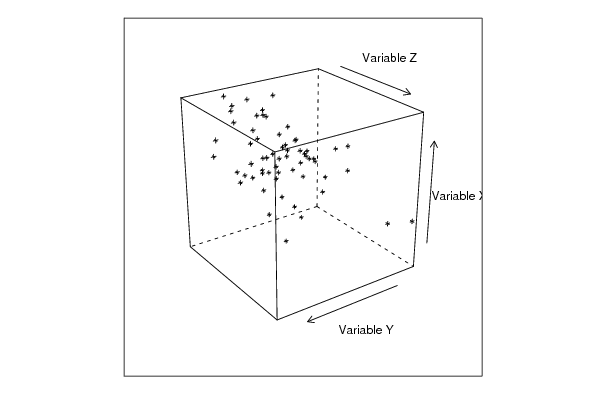
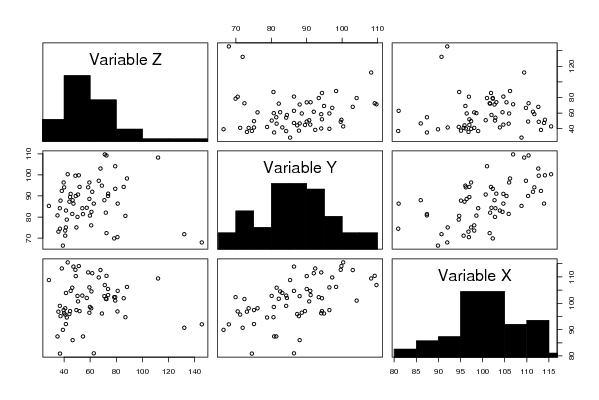
Zoals de student het ook vermeld in zijn conclusie is de Trivariate Scatterplot een 3dimensionele voorstelling. Dankzij de Trivariate Scatterplot kunnen we de correlaties tussen drie verschillende variabelen bekijken. De eerste figuren die men ziet zijn de 3D kubussen. deze stellen de 3 variabelen voor en de waarnemingen liggen geconcentreerd in de kubus. Naargelang hoe men de kubus draait, kan je veranderingen waarnemen in de ligging van de punten. Zo kan je dingen zien, die je voorheen waarschijnlijk niet had kunnen zien door 1 projectie van de kubus. Bij trivariate scatterplot gaat men de kubus projecteren op een 2D vlak, maar er gaat dan informatie verloren (1dimensie). In de figuur met de 6 rechthoeken zie je de diagonaal (dat zijn de histogrammen). De figuren naast de histograms zijn scatterplots. Als deze waarnemingen op de scatterplots in 1 rechte lijn liggen dan is er een hoge correlatie. In de figuur van de studente zien we dat de correlatie tussen Y en X een sterke correlatie heeft. De student zegt ook: 'Als de variabele op de x-as vergroot zal de variabele op de y-as verkleinen.' dit is niet altijd waar.
2008-11-20 15:10:12 [Hannes Van Hoof] [reply
Bij de trivariat scatterplots had nog kunnen staan dat deze steeds een vertekent beeld weergeven door de verschillende dimensies.
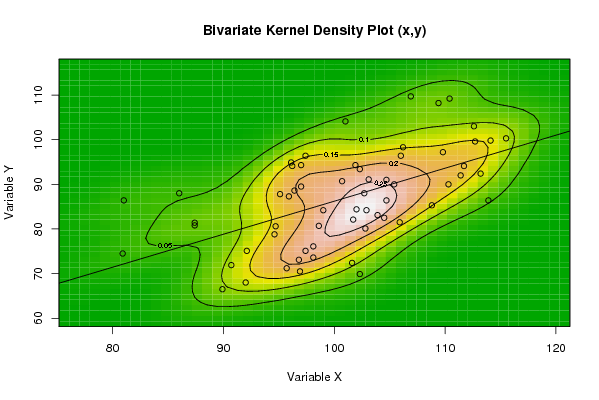
Er wordt hier tot de juiste conclusie gekomen dat er een sterk positief verband is tussen de x en de y variabele.
2008-11-22 12:13:25 [Peter Van Doninck] [reply
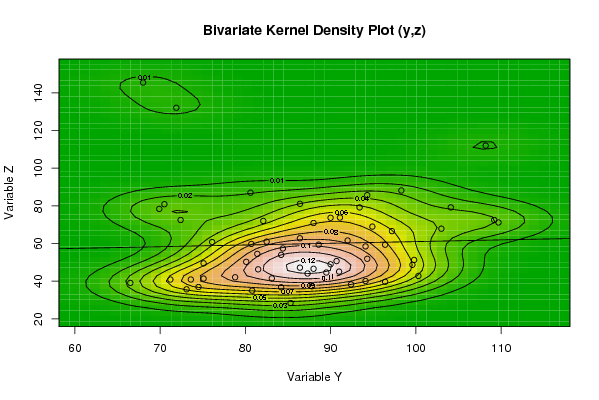
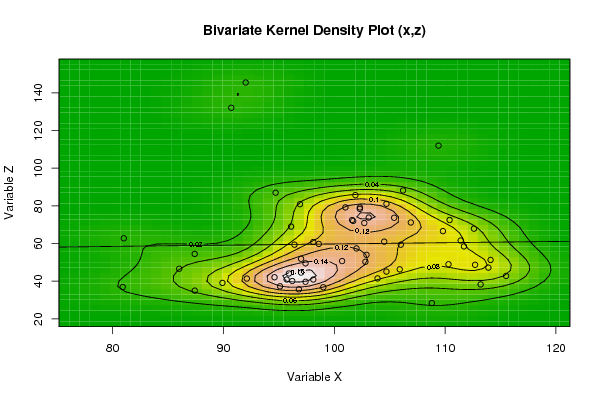
De student merkt correct op dat de trivariate scatterplot een voorstelling is voor 3 variabelen in de ruimte. Op de scatterplots kan men al min of meer iets waarnemen, wat de student zegt over het verband tussen x en y. Toch is het de Bivariate Kernel Density die meer informatie geeft over de variabelen. Het verband tussen y en z is eerder 'horizontaal', wat men mag besluiten omdat er ellipsen aanwezig zijn. Over het verband tussen x en z wordt er echter niets gezegd. Hier zijn er wel 2 ellipsen aanwezig. Wel is het spijtig dat hij het verband tussen x en y, waarvan hij beweert dat er een positief verband is, niet vermeld heeft door gebruik te maken van de Kernel Density.

Post a new message
Dataseries X:
110.40
96.40
101.90
106.20
81.00
94.70
101.00
109.40
102.30
90.70
96.20
96.10
106.00
103.10
102.00
104.70
86.00
92.10
106.90
112.60
101.70
92.00
97.40
97.00
105.40
102.70
98.10
104.50
87.40
89.90
109.80
111.70
98.60
96.90
95.10
97.00
112.70
102.90
97.40
111.40
87.40
96.80
114.10
110.30
103.90
101.60
94.60
95.90
104.70
102.80
98.10
113.90
80.90
95.70
113.20
105.90
108.80
102.30
99.00
100.70
115.50
Dataseries Y:
109.20
88.60
94.30
98.30
86.40
80.60
104.10
108.20
93.40
71.90
94.10
94.90
96.40
91.10
84.40
86.40
88.00
75.10
109.70
103.00
82.10
68.00
96.40
94.30
90.00
88.00
76.10
82.50
81.40
66.50
97.20
94.10
80.70
70.50
87.80
89.50
99.60
84.20
75.10
92.00
80.80
73.10
99.80
90.00
83.10
72.40
78.80
87.30
91.00
80.10
73.60
86.40
74.50
71.20
92.40
81.50
85.30
69.90
84.20
90.70
100.30
Dataseries Z:
72.50
59.40
85.70
88.20
62.80
87.00
79.20
112.00
79.20
132.10
40.10
69.00
59.40
73.80
57.40
81.10
46.60
41.40
71.20
67.90
72.00
145.50
39.70
51.90
73.70
70.90
60.80
61.00
54.50
39.10
66.60
58.50
59.80
80.90
37.30
44.60
48.70
54.00
49.50
61.60
35.00
35.70
51.30
49.00
41.50
72.50
42.10
44.10
45.10
50.30
40.90
47.20
36.90
40.90
38.30
46.30
28.40
78.40
36.80
50.70
42.80


Summary of computational transaction
Raw Inputview raw input (R code)
Raw Outputview raw output of R engine
Computing time3 seconds
R Server'George Udny Yule' @ 72.249.76.132

\begin{tabular}{lllllllll}
\hline
Summary of computational transaction \tabularnewline
Raw Input & view raw input (R code)  \tabularnewline
Raw Output & view raw output of R engine  \tabularnewline
Computing time & 3 seconds \tabularnewline
R Server & 'George Udny Yule' @ 72.249.76.132 \tabularnewline
\hline
\end{tabular}
%Source: https://freestatistics.org/blog/index.php?pk=24706&T=0

[TABLE]
[ROW][C]Summary of computational transaction[/C][/ROW]
[ROW][C]Raw Input[/C][C]view raw input (R code) [/C][/ROW]
[ROW][C]Raw Output[/C][C]view raw output of R engine [/C][/ROW]
[ROW][C]Computing time[/C][C]3 seconds[/C][/ROW]
[ROW][C]R Server[/C][C]'George Udny Yule' @ 72.249.76.132[/C][/ROW]
[/TABLE]
Source: https://freestatistics.org/blog/index.php?pk=24706&T=0

Globally Unique Identifier (entire table): ba.freestatistics.org/blog/index.php?pk=24706&T=0

As an alternative you can also use a QR Code:  

The GUIDs for individual cells are displayed in the table below:

Summary of computational transaction
Raw Inputview raw input (R code)
Raw Outputview raw output of R engine
Computing time3 seconds
R Server'George Udny Yule' @ 72.249.76.132


Parameters (Session):
par1 = 50 ; par2 = 50 ; par3 = Y ; par4 = Y ; par5 = Variable X ; par6 = Variable Y ; par7 = Variable Z ;
Parameters (R input):
par1 = 50 ; par2 = 50 ; par3 = Y ; par4 = Y ; par5 = Variable X ; par6 = Variable Y ; par7 = Variable Z ;
R code (references can be found in the software module):
x <- array(x,dim=c(length(x),1))
colnames(x) <- par5
y <- array(y,dim=c(length(y),1))
colnames(y) <- par6
z <- array(z,dim=c(length(z),1))
colnames(z) <- par7
d <- data.frame(cbind(z,y,x))
colnames(d) <- list(par7,par6,par5)
par1 <- as.numeric(par1)
par2 <- as.numeric(par2)
if (par1>500) par1 <- 500
if (par2>500) par2 <- 500
if (par1<10) par1 <- 10
if (par2<10) par2 <- 10
library(GenKern)
library(lattice)
panel.hist <- function(x, ...)
{
usr <- par('usr'); on.exit(par(usr))
par(usr = c(usr[1:2], 0, 1.5) )
h <- hist(x, plot = FALSE)
breaks <- h$breaks; nB <- length(breaks)
y <- h$counts; y <- y/max(y)
rect(breaks[-nB], 0, breaks[-1], y, col='black', ...)
}
bitmap(file='cloud1.png')
cloud(z~x*y, screen = list(x=-45, y=45, z=35),xlab=par5,ylab=par6,zlab=par7)
dev.off()
bitmap(file='cloud2.png')
cloud(z~x*y, screen = list(x=35, y=45, z=25),xlab=par5,ylab=par6,zlab=par7)
dev.off()
bitmap(file='cloud3.png')
cloud(z~x*y, screen = list(x=35, y=-25, z=90),xlab=par5,ylab=par6,zlab=par7)
dev.off()
bitmap(file='pairs.png')
pairs(d,diag.panel=panel.hist)
dev.off()
x <- as.vector(x)
y <- as.vector(y)
z <- as.vector(z)
bitmap(file='bidensity1.png')
op <- KernSur(x,y, xgridsize=par1, ygridsize=par2, correlation=cor(x,y), xbandwidth=dpik(x), ybandwidth=dpik(y))
image(op$xords, op$yords, op$zden, col=terrain.colors(100), axes=TRUE,main='Bivariate Kernel Density Plot (x,y)',xlab=par5,ylab=par6)
if (par3=='Y') contour(op$xords, op$yords, op$zden, add=TRUE)
if (par4=='Y') points(x,y)
(r<-lm(y ~ x))
abline(r)
box()
dev.off()
bitmap(file='bidensity2.png')
op <- KernSur(y,z, xgridsize=par1, ygridsize=par2, correlation=cor(y,z), xbandwidth=dpik(y), ybandwidth=dpik(z))
op
image(op$xords, op$yords, op$zden, col=terrain.colors(100), axes=TRUE,main='Bivariate Kernel Density Plot (y,z)',xlab=par6,ylab=par7)
if (par3=='Y') contour(op$xords, op$yords, op$zden, add=TRUE)
if (par4=='Y') points(y,z)
(r<-lm(z ~ y))
abline(r)
box()
dev.off()
bitmap(file='bidensity3.png')
op <- KernSur(x,z, xgridsize=par1, ygridsize=par2, correlation=cor(x,z), xbandwidth=dpik(x), ybandwidth=dpik(z))
op
image(op$xords, op$yords, op$zden, col=terrain.colors(100), axes=TRUE,main='Bivariate Kernel Density Plot (x,z)',xlab=par5,ylab=par7)
if (par3=='Y') contour(op$xords, op$yords, op$zden, add=TRUE)
if (par4=='Y') points(x,z)
(r<-lm(z ~ x))
abline(r)
box()
dev.off()