Free Statistics

of Irreproducible Research!

Author's title

Author*The author of this computation has been verified*
R Software Modulerwasp_hierarchicalclustering.wasp
Title produced by softwareHierarchical Clustering
Date of computationThu, 13 Nov 2008 04:42:26 -0700
Cite this page as followsStatistical Computations at FreeStatistics.org, Office for Research Development and Education, URL https://freestatistics.org/blog/index.php?v=date/2008/Nov/13/t1226576625t9v9x82o1cev6pm.htm/, Retrieved Sun, 19 May 2024 11:11:54 +0000
Statistical Computations at FreeStatistics.org, Office for Research Development and Education, URL https://freestatistics.org/blog/index.php?pk=24582, Retrieved Sun, 19 May 2024 11:11:54 +0000
QR Codes:

Original text written by user:
IsPrivate?No (this computation is public)
User-defined keywords
Estimated Impact128
Family? (F = Feedback message, R = changed R code, M = changed R Module, P = changed Parameters, D = changed Data)
-       [Hierarchical Clustering] [Q2] [2008-11-13 11:42:26] [bca67c46bcf35400430db40e8c261de9] [Current]
Feedback Forum

Post a new message
Dataseries X:
0,9059	109,86	7,4367
0,8883	108,68	7,4452
0,8924	113,38	7,4431
0,8833	117,12	7,4329
0,8700	116,23	7,4299
0,8758	114,75	7,4324
0,8858	115,81	7,4341
0,9170	115,86	7,4356
0,9554	117,80	7,4330
0,9922	117,11	7,4301
0,9778	116,31	7,4270
0,9808	118,38	7,4271
0,9811	121,57	7,4297
1,0014	121,65	7,4280
1,0183	124,20	7,4264


Summary of computational transaction
Raw Inputview raw input (R code)
Raw Outputview raw output of R engine
Computing time1 seconds
R Server'Gwilym Jenkins' @ 72.249.127.135
R Framework error message
The field 'Names of X columns' contains a hard return which cannot be interpreted.
Please, resubmit your request without hard returns in the 'Names of X columns'.

\begin{tabular}{lllllllll}
\hline
Summary of computational transaction \tabularnewline
Raw Input & view raw input (R code)  \tabularnewline
Raw Output & view raw output of R engine  \tabularnewline
Computing time & 1 seconds \tabularnewline
R Server & 'Gwilym Jenkins' @ 72.249.127.135 \tabularnewline
R Framework error message & 
The field 'Names of X columns' contains a hard return which cannot be interpreted.
Please, resubmit your request without hard returns in the 'Names of X columns'.
\tabularnewline \hline \end{tabular} %Source: https://freestatistics.org/blog/index.php?pk=24582&T=0

[TABLE]
[ROW][C]Summary of computational transaction[/C][/ROW]
[ROW][C]Raw Input[/C][C]view raw input (R code) [/C][/ROW]
[ROW][C]Raw Output[/C][C]view raw output of R engine [/C][/ROW]
[ROW][C]Computing time[/C][C]1 seconds[/C][/ROW]
[ROW][C]R Server[/C][C]'Gwilym Jenkins' @ 72.249.127.135[/C][/ROW]
[ROW][C]R Framework error message[/C][C]
The field 'Names of X columns' contains a hard return which cannot be interpreted.
Please, resubmit your request without hard returns in the 'Names of X columns'.
[/C][/ROW] [/TABLE] Source: https://freestatistics.org/blog/index.php?pk=24582&T=0

Globally Unique Identifier (entire table): ba.freestatistics.org/blog/index.php?pk=24582&T=0

As an alternative you can also use a QR Code:  

The GUIDs for individual cells are displayed in the table below:

Summary of computational transaction
Raw Inputview raw input (R code)
Raw Outputview raw output of R engine
Computing time1 seconds
R Server'Gwilym Jenkins' @ 72.249.127.135
R Framework error message
The field 'Names of X columns' contains a hard return which cannot be interpreted.
Please, resubmit your request without hard returns in the 'Names of X columns'.


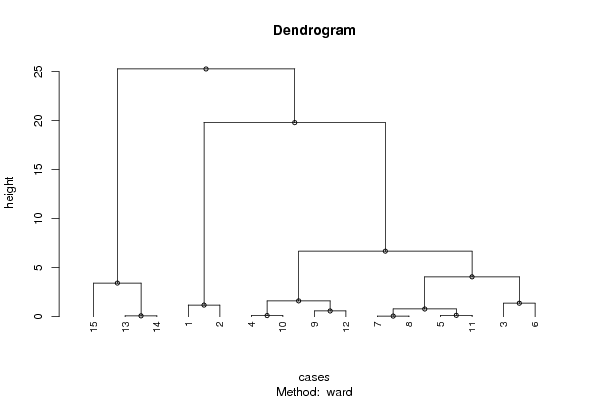
Summary of Dendrogram
LabelHeight
10.0589549828258792
20.0825528921359028
30.109394012633234
40.134273042715207
50.580585885119504
60.781360071406344
71.18016185754327
81.37014234661951
91.60932660849046
103.42603013443799
114.06362154927621
126.68485938342996
1319.8017437094780
1425.2770766014930

\begin{tabular}{lllllllll}
\hline
Summary of Dendrogram \tabularnewline
Label & Height \tabularnewline
1 & 0.0589549828258792 \tabularnewline
2 & 0.0825528921359028 \tabularnewline
3 & 0.109394012633234 \tabularnewline
4 & 0.134273042715207 \tabularnewline
5 & 0.580585885119504 \tabularnewline
6 & 0.781360071406344 \tabularnewline
7 & 1.18016185754327 \tabularnewline
8 & 1.37014234661951 \tabularnewline
9 & 1.60932660849046 \tabularnewline
10 & 3.42603013443799 \tabularnewline
11 & 4.06362154927621 \tabularnewline
12 & 6.68485938342996 \tabularnewline
13 & 19.8017437094780 \tabularnewline
14 & 25.2770766014930 \tabularnewline
\hline
\end{tabular}
%Source: https://freestatistics.org/blog/index.php?pk=24582&T=1

[TABLE]
[ROW][C]Summary of Dendrogram[/C][/ROW]
[ROW][C]Label[/C][C]Height[/C][/ROW]
[ROW][C]1[/C][C]0.0589549828258792[/C][/ROW]
[ROW][C]2[/C][C]0.0825528921359028[/C][/ROW]
[ROW][C]3[/C][C]0.109394012633234[/C][/ROW]
[ROW][C]4[/C][C]0.134273042715207[/C][/ROW]
[ROW][C]5[/C][C]0.580585885119504[/C][/ROW]
[ROW][C]6[/C][C]0.781360071406344[/C][/ROW]
[ROW][C]7[/C][C]1.18016185754327[/C][/ROW]
[ROW][C]8[/C][C]1.37014234661951[/C][/ROW]
[ROW][C]9[/C][C]1.60932660849046[/C][/ROW]
[ROW][C]10[/C][C]3.42603013443799[/C][/ROW]
[ROW][C]11[/C][C]4.06362154927621[/C][/ROW]
[ROW][C]12[/C][C]6.68485938342996[/C][/ROW]
[ROW][C]13[/C][C]19.8017437094780[/C][/ROW]
[ROW][C]14[/C][C]25.2770766014930[/C][/ROW]
[/TABLE]
Source: https://freestatistics.org/blog/index.php?pk=24582&T=1

Globally Unique Identifier (entire table): ba.freestatistics.org/blog/index.php?pk=24582&T=1

As an alternative you can also use a QR Code:  

The GUIDs for individual cells are displayed in the table below:

Summary of Dendrogram
LabelHeight
10.0589549828258792
20.0825528921359028
30.109394012633234
40.134273042715207
50.580585885119504
60.781360071406344
71.18016185754327
81.37014234661951
91.60932660849046
103.42603013443799
114.06362154927621
126.68485938342996
1319.8017437094780
1425.2770766014930


Parameters (Session):
par1 = ward ; par2 = ALL ; par3 = FALSE ; par4 = FALSE ;
Parameters (R input):
par1 = ward ; par2 = ALL ; par3 = FALSE ; par4 = FALSE ;
R code (references can be found in the software module):
par3 <- as.logical(par3)
par4 <- as.logical(par4)
if (par3 == 'TRUE'){
dum = xlab
xlab = ylab
ylab = dum
}
x <- t(y)
hc <- hclust(dist(x),method=par1)
d <- as.dendrogram(hc)
str(d)
mysub <- paste('Method: ',par1)
bitmap(file='test1.png')
if (par4 == 'TRUE'){
plot(d,main=main,ylab=ylab,xlab=xlab,horiz=par3, nodePar=list(pch = c(1,NA), cex=0.8, lab.cex = 0.8),type='t',center=T, sub=mysub)
} else {
plot(d,main=main,ylab=ylab,xlab=xlab,horiz=par3, nodePar=list(pch = c(1,NA), cex=0.8, lab.cex = 0.8), sub=mysub)
}
dev.off()
if (par2 != 'ALL'){
if (par3 == 'TRUE'){
ylab = 'cluster'
} else {
xlab = 'cluster'
}
par2 <- as.numeric(par2)
memb <- cutree(hc, k = par2)
cent <- NULL
for(k in 1:par2){
cent <- rbind(cent, colMeans(x[memb == k, , drop = FALSE]))
}
hc1 <- hclust(dist(cent),method=par1, members = table(memb))
de <- as.dendrogram(hc1)
bitmap(file='test2.png')
if (par4 == 'TRUE'){
plot(de,main=main,ylab=ylab,xlab=xlab,horiz=par3, nodePar=list(pch = c(1,NA), cex=0.8, lab.cex = 0.8),type='t',center=T, sub=mysub)
} else {
plot(de,main=main,ylab=ylab,xlab=xlab,horiz=par3, nodePar=list(pch = c(1,NA), cex=0.8, lab.cex = 0.8), sub=mysub)
}
dev.off()
str(de)
}
load(file='createtable')
a<-table.start()
a<-table.row.start(a)
a<-table.element(a,'Summary of Dendrogram',2,TRUE)
a<-table.row.end(a)
a<-table.row.start(a)
a<-table.element(a,'Label',header=TRUE)
a<-table.element(a,'Height',header=TRUE)
a<-table.row.end(a)
num <- length(x[,1])-1
for (i in 1:num)
{
a<-table.row.start(a)
a<-table.element(a,hc$labels[i])
a<-table.element(a,hc$height[i])
a<-table.row.end(a)
}
a<-table.end(a)
table.save(a,file='mytable1.tab')
if (par2 != 'ALL'){
a<-table.start()
a<-table.row.start(a)
a<-table.element(a,'Summary of Cut Dendrogram',2,TRUE)
a<-table.row.end(a)
a<-table.row.start(a)
a<-table.element(a,'Label',header=TRUE)
a<-table.element(a,'Height',header=TRUE)
a<-table.row.end(a)
num <- par2-1
for (i in 1:num)
{
a<-table.row.start(a)
a<-table.element(a,i)
a<-table.element(a,hc1$height[i])
a<-table.row.end(a)
}
a<-table.end(a)
table.save(a,file='mytable2.tab')
}