Free Statistics

of Irreproducible Research!

Author's title

Author*The author of this computation has been verified*
R Software Modulerwasp_hierarchicalclustering.wasp
Title produced by softwareHierarchical Clustering
Date of computationThu, 13 Nov 2008 03:54:44 -0700
Cite this page as followsStatistical Computations at FreeStatistics.org, Office for Research Development and Education, URL https://freestatistics.org/blog/index.php?v=date/2008/Nov/13/t122657381280z6qyhx7rpcotq.htm/, Retrieved Sun, 19 May 2024 12:04:12 +0000
Statistical Computations at FreeStatistics.org, Office for Research Development and Education, URL https://freestatistics.org/blog/index.php?pk=24566, Retrieved Sun, 19 May 2024 12:04:12 +0000
QR Codes:

Original text written by user:
IsPrivate?No (this computation is public)
User-defined keywordsEigen tijdreeksen H8
Estimated Impact124
Family? (F = Feedback message, R = changed R code, M = changed R Module, P = changed Parameters, D = changed Data)
F       [Hierarchical Clustering] [loïqueverhasselt] [2008-11-13 10:54:44] [6440ec5a21e5d35520cb2ae6b4b70e45] [Current]
Feedback Forum
2008-11-18 12:04:37 [Loïque Verhasselt] [reply
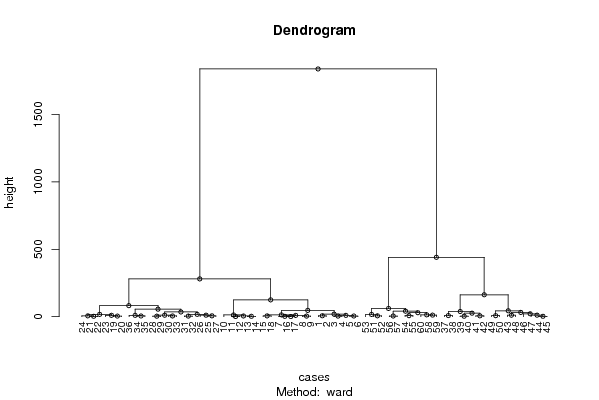
Juiste berekening uitgevoerd. Een dendrogram dient werkelijk om waar te nemen waar de clusters van observaties zich bevinden. Opsplitsen van de perioden, makkelijke visuele interpretatie voor groepen van observaties te herkennen. Men ziet duidelijk dat de groepen heel klein worden door een langdurende opsplitsing waardoor het nogal onduidelijk wordt.
2008-11-20 11:40:37 [Thomas Plasschaert] [reply
Goede figuur, maar korte uitleg. Een dendogram geeft inderdaad een onderverdeling van de gegevens in verschillende clusters. Deze opsplitsing gaat voort toch in elke groep slechts 1 waarneming meer zit. De verschillende groepen bevatten gelijkaardige gegevens, zo kunnen we zien dat de waarnemingen in de eerste grote cluster kleinere waarden bevat dan die van de 2de cluster.

Post a new message
Dataseries X:
99.4	97.4	100.3	93
97.5	95.3	98.5	98.4
94.6	93.6	95.1	92.6
92.6	91.5	93.1	94.6
92.5	93.1	92.2	99.5
89.8	91.7	89	97.6
88.8	94.3	86.4	91.3
87.4	93.9	84.5	93.6
85.2	90.9	82.7	93.1
83.1	88.3	80.8	78.4
84.7	91.3	81.8	70.2
84.8	91.7	81.8	69.3
85.8	92.4	82.9	71.1
86.3	92	83.8	73.5
89	95.6	86.2	85.9
89	95.8	86.1	91.5
89.3	96.4	86.2	91.8
91.9	99	88.8	88.3
94.9	107	89.6	91.3
94.4	109.7	87.8	94
96.8	116.2	88.3	99.3
96.9	115.9	88.6	96.7
98	113.8	91	88
97.9	112.6	91.5	96.7
100.9	113.7	95.4	106.8
103.9	115.9	98.7	114.3
103.1	110.3	99.9	105.7
102.5	111.3	98.6	90.1
104.3	113.4	100.3	91.6
102.6	108.2	100.2	97.7
101.7	104.8	100.4	100.8
102.8	106	101.4	104.6
105.4	110.9	103	95.9
110.9	115	109.1	102.7
113.5	118.4	111.4	104
116.3	121.4	114.1	107.9
124	128.8	121.8	113.8
128.8	131.7	127.6	113.8
133.5	141.7	129.9	123.1
132.6	142.9	128	125.1
128.4	139.4	123.5	137.6
127.3	134.7	124	134
126.7	125	127.4	140.3
123.3	113.6	127.6	152.1
123.2	111.5	128.4	150.6
124.4	108.5	131.4	167.3
128.2	112.3	135.1	153.2
128.7	116.6	134	142
135.7	115.5	144.5	154.4
139	120.1	147.3	158.5
145.4	132.9	150.9	180.9
142.4	128.1	148.7	181.3
137.7	129.3	141.4	172.4
137	132.5	138.9	192
137.1	131	139.8	199.3
139.3	124.9	145.6	215.4
139.6	120.8	147.9	214.3
140.4	122	148.5	201.5
142.3	122.1	151.1	190.5
148.3	127.4	157.5	196


Summary of computational transaction
Raw Inputview raw input (R code)
Raw Outputview raw output of R engine
Computing time5 seconds
R Server'Herman Ole Andreas Wold' @ 193.190.124.10:1001
R Framework error message
The field 'Names of X columns' contains a hard return which cannot be interpreted.
Please, resubmit your request without hard returns in the 'Names of X columns'.

\begin{tabular}{lllllllll}
\hline
Summary of computational transaction \tabularnewline
Raw Input & view raw input (R code)  \tabularnewline
Raw Output & view raw output of R engine  \tabularnewline
Computing time & 5 seconds \tabularnewline
R Server & 'Herman Ole Andreas Wold' @ 193.190.124.10:1001 \tabularnewline
R Framework error message & 
The field 'Names of X columns' contains a hard return which cannot be interpreted.
Please, resubmit your request without hard returns in the 'Names of X columns'.
\tabularnewline \hline \end{tabular} %Source: https://freestatistics.org/blog/index.php?pk=24566&T=0

[TABLE]
[ROW][C]Summary of computational transaction[/C][/ROW]
[ROW][C]Raw Input[/C][C]view raw input (R code) [/C][/ROW]
[ROW][C]Raw Output[/C][C]view raw output of R engine [/C][/ROW]
[ROW][C]Computing time[/C][C]5 seconds[/C][/ROW]
[ROW][C]R Server[/C][C]'Herman Ole Andreas Wold' @ 193.190.124.10:1001[/C][/ROW]
[ROW][C]R Framework error message[/C][C]
The field 'Names of X columns' contains a hard return which cannot be interpreted.
Please, resubmit your request without hard returns in the 'Names of X columns'.
[/C][/ROW] [/TABLE] Source: https://freestatistics.org/blog/index.php?pk=24566&T=0

Globally Unique Identifier (entire table): ba.freestatistics.org/blog/index.php?pk=24566&T=0

As an alternative you can also use a QR Code:  

The GUIDs for individual cells are displayed in the table below:

Summary of computational transaction
Raw Inputview raw input (R code)
Raw Outputview raw output of R engine
Computing time5 seconds
R Server'Herman Ole Andreas Wold' @ 193.190.124.10:1001
R Framework error message
The field 'Names of X columns' contains a hard return which cannot be interpreted.
Please, resubmit your request without hard returns in the 'Names of X columns'.


Summary of Dendrogram
LabelHeight
10.741619848709572
20.989949493661173
32.27312302692289
42.63628526529281
52.64196896272458
62.70370116691915
73.14006369362153
83.57631094844954
94.05092582010582
104.16293165929973
114.25088226136646
124.25323406362734
134.80624593627917
144.83735464897914
155.02246267558159
165.02991053598372
175.11957029446809
185.7
195.84694629244285
206.04235053600833
216.08604962188119
226.15304802516606
236.35767253010094
247.5073297516494
257.52994023880668
268.06783738061198
279.27323844265063
289.69848884776358
299.87320463196887
309.92098439393896
3110.7368561930187
3210.8571746227571
3311.0004545360635
3411.0392220335418
3511.4621114983235
3612.4434829058183
3713.1195422767703
3813.4281905039626
3916.5131503568809
4016.706895299161
4117.093228829301
4218.6316780354627
4321.2254050174915
4425.6608146432002
4529.2937507231387
4631.3747581577148
4734.8451748418413
4838.4031946139162
4940.6976280502828
5043.4476365791452
5146.5632203509392
5255.6229063899552
5360.7894047086249
5481.6562849690992
55124.422764543159
56162.381441883586
57280.14674650219
58440.368766520779
591838.04819271594

\begin{tabular}{lllllllll}
\hline
Summary of Dendrogram \tabularnewline
Label & Height \tabularnewline
1 & 0.741619848709572 \tabularnewline
2 & 0.989949493661173 \tabularnewline
3 & 2.27312302692289 \tabularnewline
4 & 2.63628526529281 \tabularnewline
5 & 2.64196896272458 \tabularnewline
6 & 2.70370116691915 \tabularnewline
7 & 3.14006369362153 \tabularnewline
8 & 3.57631094844954 \tabularnewline
9 & 4.05092582010582 \tabularnewline
10 & 4.16293165929973 \tabularnewline
11 & 4.25088226136646 \tabularnewline
12 & 4.25323406362734 \tabularnewline
13 & 4.80624593627917 \tabularnewline
14 & 4.83735464897914 \tabularnewline
15 & 5.02246267558159 \tabularnewline
16 & 5.02991053598372 \tabularnewline
17 & 5.11957029446809 \tabularnewline
18 & 5.7 \tabularnewline
19 & 5.84694629244285 \tabularnewline
20 & 6.04235053600833 \tabularnewline
21 & 6.08604962188119 \tabularnewline
22 & 6.15304802516606 \tabularnewline
23 & 6.35767253010094 \tabularnewline
24 & 7.5073297516494 \tabularnewline
25 & 7.52994023880668 \tabularnewline
26 & 8.06783738061198 \tabularnewline
27 & 9.27323844265063 \tabularnewline
28 & 9.69848884776358 \tabularnewline
29 & 9.87320463196887 \tabularnewline
30 & 9.92098439393896 \tabularnewline
31 & 10.7368561930187 \tabularnewline
32 & 10.8571746227571 \tabularnewline
33 & 11.0004545360635 \tabularnewline
34 & 11.0392220335418 \tabularnewline
35 & 11.4621114983235 \tabularnewline
36 & 12.4434829058183 \tabularnewline
37 & 13.1195422767703 \tabularnewline
38 & 13.4281905039626 \tabularnewline
39 & 16.5131503568809 \tabularnewline
40 & 16.706895299161 \tabularnewline
41 & 17.093228829301 \tabularnewline
42 & 18.6316780354627 \tabularnewline
43 & 21.2254050174915 \tabularnewline
44 & 25.6608146432002 \tabularnewline
45 & 29.2937507231387 \tabularnewline
46 & 31.3747581577148 \tabularnewline
47 & 34.8451748418413 \tabularnewline
48 & 38.4031946139162 \tabularnewline
49 & 40.6976280502828 \tabularnewline
50 & 43.4476365791452 \tabularnewline
51 & 46.5632203509392 \tabularnewline
52 & 55.6229063899552 \tabularnewline
53 & 60.7894047086249 \tabularnewline
54 & 81.6562849690992 \tabularnewline
55 & 124.422764543159 \tabularnewline
56 & 162.381441883586 \tabularnewline
57 & 280.14674650219 \tabularnewline
58 & 440.368766520779 \tabularnewline
59 & 1838.04819271594 \tabularnewline
\hline
\end{tabular}
%Source: https://freestatistics.org/blog/index.php?pk=24566&T=1

[TABLE]
[ROW][C]Summary of Dendrogram[/C][/ROW]
[ROW][C]Label[/C][C]Height[/C][/ROW]
[ROW][C]1[/C][C]0.741619848709572[/C][/ROW]
[ROW][C]2[/C][C]0.989949493661173[/C][/ROW]
[ROW][C]3[/C][C]2.27312302692289[/C][/ROW]
[ROW][C]4[/C][C]2.63628526529281[/C][/ROW]
[ROW][C]5[/C][C]2.64196896272458[/C][/ROW]
[ROW][C]6[/C][C]2.70370116691915[/C][/ROW]
[ROW][C]7[/C][C]3.14006369362153[/C][/ROW]
[ROW][C]8[/C][C]3.57631094844954[/C][/ROW]
[ROW][C]9[/C][C]4.05092582010582[/C][/ROW]
[ROW][C]10[/C][C]4.16293165929973[/C][/ROW]
[ROW][C]11[/C][C]4.25088226136646[/C][/ROW]
[ROW][C]12[/C][C]4.25323406362734[/C][/ROW]
[ROW][C]13[/C][C]4.80624593627917[/C][/ROW]
[ROW][C]14[/C][C]4.83735464897914[/C][/ROW]
[ROW][C]15[/C][C]5.02246267558159[/C][/ROW]
[ROW][C]16[/C][C]5.02991053598372[/C][/ROW]
[ROW][C]17[/C][C]5.11957029446809[/C][/ROW]
[ROW][C]18[/C][C]5.7[/C][/ROW]
[ROW][C]19[/C][C]5.84694629244285[/C][/ROW]
[ROW][C]20[/C][C]6.04235053600833[/C][/ROW]
[ROW][C]21[/C][C]6.08604962188119[/C][/ROW]
[ROW][C]22[/C][C]6.15304802516606[/C][/ROW]
[ROW][C]23[/C][C]6.35767253010094[/C][/ROW]
[ROW][C]24[/C][C]7.5073297516494[/C][/ROW]
[ROW][C]25[/C][C]7.52994023880668[/C][/ROW]
[ROW][C]26[/C][C]8.06783738061198[/C][/ROW]
[ROW][C]27[/C][C]9.27323844265063[/C][/ROW]
[ROW][C]28[/C][C]9.69848884776358[/C][/ROW]
[ROW][C]29[/C][C]9.87320463196887[/C][/ROW]
[ROW][C]30[/C][C]9.92098439393896[/C][/ROW]
[ROW][C]31[/C][C]10.7368561930187[/C][/ROW]
[ROW][C]32[/C][C]10.8571746227571[/C][/ROW]
[ROW][C]33[/C][C]11.0004545360635[/C][/ROW]
[ROW][C]34[/C][C]11.0392220335418[/C][/ROW]
[ROW][C]35[/C][C]11.4621114983235[/C][/ROW]
[ROW][C]36[/C][C]12.4434829058183[/C][/ROW]
[ROW][C]37[/C][C]13.1195422767703[/C][/ROW]
[ROW][C]38[/C][C]13.4281905039626[/C][/ROW]
[ROW][C]39[/C][C]16.5131503568809[/C][/ROW]
[ROW][C]40[/C][C]16.706895299161[/C][/ROW]
[ROW][C]41[/C][C]17.093228829301[/C][/ROW]
[ROW][C]42[/C][C]18.6316780354627[/C][/ROW]
[ROW][C]43[/C][C]21.2254050174915[/C][/ROW]
[ROW][C]44[/C][C]25.6608146432002[/C][/ROW]
[ROW][C]45[/C][C]29.2937507231387[/C][/ROW]
[ROW][C]46[/C][C]31.3747581577148[/C][/ROW]
[ROW][C]47[/C][C]34.8451748418413[/C][/ROW]
[ROW][C]48[/C][C]38.4031946139162[/C][/ROW]
[ROW][C]49[/C][C]40.6976280502828[/C][/ROW]
[ROW][C]50[/C][C]43.4476365791452[/C][/ROW]
[ROW][C]51[/C][C]46.5632203509392[/C][/ROW]
[ROW][C]52[/C][C]55.6229063899552[/C][/ROW]
[ROW][C]53[/C][C]60.7894047086249[/C][/ROW]
[ROW][C]54[/C][C]81.6562849690992[/C][/ROW]
[ROW][C]55[/C][C]124.422764543159[/C][/ROW]
[ROW][C]56[/C][C]162.381441883586[/C][/ROW]
[ROW][C]57[/C][C]280.14674650219[/C][/ROW]
[ROW][C]58[/C][C]440.368766520779[/C][/ROW]
[ROW][C]59[/C][C]1838.04819271594[/C][/ROW]
[/TABLE]
Source: https://freestatistics.org/blog/index.php?pk=24566&T=1

Globally Unique Identifier (entire table): ba.freestatistics.org/blog/index.php?pk=24566&T=1

As an alternative you can also use a QR Code:  

The GUIDs for individual cells are displayed in the table below:

Summary of Dendrogram
LabelHeight
10.741619848709572
20.989949493661173
32.27312302692289
42.63628526529281
52.64196896272458
62.70370116691915
73.14006369362153
83.57631094844954
94.05092582010582
104.16293165929973
114.25088226136646
124.25323406362734
134.80624593627917
144.83735464897914
155.02246267558159
165.02991053598372
175.11957029446809
185.7
195.84694629244285
206.04235053600833
216.08604962188119
226.15304802516606
236.35767253010094
247.5073297516494
257.52994023880668
268.06783738061198
279.27323844265063
289.69848884776358
299.87320463196887
309.92098439393896
3110.7368561930187
3210.8571746227571
3311.0004545360635
3411.0392220335418
3511.4621114983235
3612.4434829058183
3713.1195422767703
3813.4281905039626
3916.5131503568809
4016.706895299161
4117.093228829301
4218.6316780354627
4321.2254050174915
4425.6608146432002
4529.2937507231387
4631.3747581577148
4734.8451748418413
4838.4031946139162
4940.6976280502828
5043.4476365791452
5146.5632203509392
5255.6229063899552
5360.7894047086249
5481.6562849690992
55124.422764543159
56162.381441883586
57280.14674650219
58440.368766520779
591838.04819271594


Parameters (Session):
par1 = ward ; par2 = ALL ; par3 = FALSE ; par4 = FALSE ;
Parameters (R input):
par1 = ward ; par2 = ALL ; par3 = FALSE ; par4 = FALSE ;
R code (references can be found in the software module):
par3 <- as.logical(par3)
par4 <- as.logical(par4)
if (par3 == 'TRUE'){
dum = xlab
xlab = ylab
ylab = dum
}
x <- t(y)
hc <- hclust(dist(x),method=par1)
d <- as.dendrogram(hc)
str(d)
mysub <- paste('Method: ',par1)
bitmap(file='test1.png')
if (par4 == 'TRUE'){
plot(d,main=main,ylab=ylab,xlab=xlab,horiz=par3, nodePar=list(pch = c(1,NA), cex=0.8, lab.cex = 0.8),type='t',center=T, sub=mysub)
} else {
plot(d,main=main,ylab=ylab,xlab=xlab,horiz=par3, nodePar=list(pch = c(1,NA), cex=0.8, lab.cex = 0.8), sub=mysub)
}
dev.off()
if (par2 != 'ALL'){
if (par3 == 'TRUE'){
ylab = 'cluster'
} else {
xlab = 'cluster'
}
par2 <- as.numeric(par2)
memb <- cutree(hc, k = par2)
cent <- NULL
for(k in 1:par2){
cent <- rbind(cent, colMeans(x[memb == k, , drop = FALSE]))
}
hc1 <- hclust(dist(cent),method=par1, members = table(memb))
de <- as.dendrogram(hc1)
bitmap(file='test2.png')
if (par4 == 'TRUE'){
plot(de,main=main,ylab=ylab,xlab=xlab,horiz=par3, nodePar=list(pch = c(1,NA), cex=0.8, lab.cex = 0.8),type='t',center=T, sub=mysub)
} else {
plot(de,main=main,ylab=ylab,xlab=xlab,horiz=par3, nodePar=list(pch = c(1,NA), cex=0.8, lab.cex = 0.8), sub=mysub)
}
dev.off()
str(de)
}
load(file='createtable')
a<-table.start()
a<-table.row.start(a)
a<-table.element(a,'Summary of Dendrogram',2,TRUE)
a<-table.row.end(a)
a<-table.row.start(a)
a<-table.element(a,'Label',header=TRUE)
a<-table.element(a,'Height',header=TRUE)
a<-table.row.end(a)
num <- length(x[,1])-1
for (i in 1:num)
{
a<-table.row.start(a)
a<-table.element(a,hc$labels[i])
a<-table.element(a,hc$height[i])
a<-table.row.end(a)
}
a<-table.end(a)
table.save(a,file='mytable1.tab')
if (par2 != 'ALL'){
a<-table.start()
a<-table.row.start(a)
a<-table.element(a,'Summary of Cut Dendrogram',2,TRUE)
a<-table.row.end(a)
a<-table.row.start(a)
a<-table.element(a,'Label',header=TRUE)
a<-table.element(a,'Height',header=TRUE)
a<-table.row.end(a)
num <- par2-1
for (i in 1:num)
{
a<-table.row.start(a)
a<-table.element(a,i)
a<-table.element(a,hc1$height[i])
a<-table.row.end(a)
}
a<-table.end(a)
table.save(a,file='mytable2.tab')
}