Free Statistics

of Irreproducible Research!

Author's title

Author*Unverified author*
R Software Modulerwasp_hierarchicalclustering.wasp
Title produced by softwareHierarchical Clustering
Date of computationThu, 13 Nov 2008 03:10:00 -0700
Cite this page as followsStatistical Computations at FreeStatistics.org, Office for Research Development and Education, URL https://freestatistics.org/blog/index.php?v=date/2008/Nov/13/t1226571087te72604yg4vdztt.htm/, Retrieved Sun, 19 May 2024 11:40:24 +0000
Statistical Computations at FreeStatistics.org, Office for Research Development and Education, URL https://freestatistics.org/blog/index.php?pk=24542, Retrieved Sun, 19 May 2024 11:40:24 +0000
QR Codes:

Original text written by user:
IsPrivate?No (this computation is public)
User-defined keywords
Estimated Impact142
Family? (F = Feedback message, R = changed R code, M = changed R Module, P = changed Parameters, D = changed Data)
F       [Hierarchical Clustering] [dendogram2] [2008-11-13 10:10:00] [80e37024345c6a903bf645806b7fbe14] [Current]
Feedback Forum
2008-11-19 15:14:45 [Glenn Maras] [reply
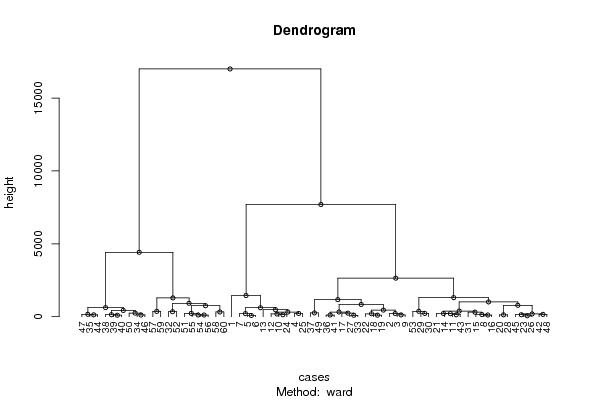
Een dendrogram wordt gebruikt om weer te geven hoe en waar de clusters zich bevinden ofwel zijn geplaatst. Er is niet echt een besluit getrokken uit de figuur. Wat mij wel opvalt is dat de latere maanden vanaf 30 in de eerste cluster liggen en de lagere maanden tot 30 in de 2de cluster.

Post a new message
Dataseries X:
1846.5	1530.9	2225.4	1163.9
2796.3	2220.6	2713.9	1467.9
2895.6	2161.5	2923.3	1433.7
2472.2	1863.6	2707	1362.2
2584.4	1955.1	2473.9	1299
2630.4	1907.4	2521	1291.5
2663.1	1889.4	2531.8	1452.7
3176.2	2246.3	3068.8	1555.4
2856.7	2213	2826.9	1402.5
2551.4	1965	2674.2	1242.9
3088.7	2285.6	2966.6	1514.6
2628.3	1983.8	2798.8	1308.6
2226.2	1872.4	2629.6	1239.3
3023.6	2371.4	3124.6	1519.9
3077.9	2287	3115.7	1659.4
3084.1	2198.2	3083	1597.6
2990.3	2330.4	2863.9	1340.6
2949.6	2014.4	2728.7	1427.2
3014.7	2066.1	2789.4	1438.1
3517.7	2355.8	3225.7	1616.2
3121.2	2232.5	3148.2	1392.8
3067.4	2091.7	2836.5	1318.7
3174.6	2376.5	3153.5	1420.9
2676.3	1931.9	2656.9	1221
2424	2025.7	2834.7	1310
3195.1	2404.9	3172.5	1466.7
3146.6	2316.1	2998.8	1299.3
3506.7	2368.1	3103.1	1640
3528.5	2282.5	2735.6	1506.3
3365.1	2158.6	2818.1	1530.2
3153	2174.8	2874.4	1661.9
3843.3	2594.1	3438.5	1880.3
3123.2	2281.4	2949.1	1230.8
3361.1	2547.9	3306.8	1406.5
3481.9	2606.3	3530	1523.5
2970.5	2190.8	3003.8	1323.2
2537	2262.3	3206.4	1319.2
3257.6	2423.8	3514.6	1500.7
3301.3	2520.4	3522.6	1483
3391.6	2482.9	3525.5	1497
2933.6	2215.9	2996.2	1219.8
3283.2	2441.9	3231.1	1472.9
3139.7	2333.8	3030	1423.9
3486.4	2670.2	3541.7	1629.6
3202.2	2431	3113.2	1353.4
3294.4	2559.3	3390.8	1366.8
3550.3	2661.4	3424.2	1527.1
3279.3	2404.6	3079.8	1487.6
2678.6	2378.3	3123.4	1478.6
3451.4	2489.2	3317.1	1536.7
3977.1	2959	3611.6	1682.1
3814.8	2713.5	3341.1	1576.5
3310.5	2341.3	2684.9	1280.5
3971.8	2833.2	3747.8	1756.5
4051.9	2849.7	3677.8	1698.8
4057.6	2871.7	3787.8	1709.3
4391.4	3058.3	4171.2	1741
3628.9	2855.1	3774	1493
4092.2	3083.6	4053.7	1577.5
3822.5	2828.3	4000.9	1609.3


Summary of computational transaction
Raw Inputview raw input (R code)
Raw Outputview raw output of R engine
Computing time1 seconds
R Server'Gwilym Jenkins' @ 72.249.127.135

\begin{tabular}{lllllllll}
\hline
Summary of computational transaction \tabularnewline
Raw Input & view raw input (R code)  \tabularnewline
Raw Output & view raw output of R engine  \tabularnewline
Computing time & 1 seconds \tabularnewline
R Server & 'Gwilym Jenkins' @ 72.249.127.135 \tabularnewline
\hline
\end{tabular}
%Source: https://freestatistics.org/blog/index.php?pk=24542&T=0

[TABLE]
[ROW][C]Summary of computational transaction[/C][/ROW]
[ROW][C]Raw Input[/C][C]view raw input (R code) [/C][/ROW]
[ROW][C]Raw Output[/C][C]view raw output of R engine [/C][/ROW]
[ROW][C]Computing time[/C][C]1 seconds[/C][/ROW]
[ROW][C]R Server[/C][C]'Gwilym Jenkins' @ 72.249.127.135[/C][/ROW]
[/TABLE]
Source: https://freestatistics.org/blog/index.php?pk=24542&T=0

Globally Unique Identifier (entire table): ba.freestatistics.org/blog/index.php?pk=24542&T=0

As an alternative you can also use a QR Code:  

The GUIDs for individual cells are displayed in the table below:

Summary of computational transaction
Raw Inputview raw input (R code)
Raw Outputview raw output of R engine
Computing time1 seconds
R Server'Gwilym Jenkins' @ 72.249.127.135


Summary of Dendrogram
LabelHeight
160.7079072279716
281.6452693056981
394.4139290571048
498.816749592364
5103.509419861189
6112.568778975344
7112.875772422606
8113.042027582665
9114.938853309053
10119.110591328309
11120.132676653773
12124.489196318395
13125.974164017865
14131.035453217822
15132.191225124817
16133.277622419026
17136.857828605059
18141.778443778745
19156.570367566791
20162.699689515062
21184.408818180781
22184.865851210601
23198.195865184544
24205.060598281125
25212.405588989292
26216.251919565285
27217.060677092381
28218.247061835893
29222.324605026075
30223.614874717416
31241.515449192728
32243.015875564718
33256.522747529337
34306.629589649213
35316.363544778956
36317.601502413238
37321.260797483913
38341.833014789385
39361.52348471434
40368.941455959642
41382.816684657272
42426.154810732356
43449.080113042925
44481.076693248871
45613.203209458876
46620.656691647729
47751.086741999513
48779.539280382058
49834.860499381507
50916.405313437702
511011.78763229961
521167.87294568267
531286.68446586160
541305.8631807257
551451.03580794201
562643.92770683996
574416.22745262789
587696.8443754616
5916999.7672280781

\begin{tabular}{lllllllll}
\hline
Summary of Dendrogram \tabularnewline
Label & Height \tabularnewline
1 & 60.7079072279716 \tabularnewline
2 & 81.6452693056981 \tabularnewline
3 & 94.4139290571048 \tabularnewline
4 & 98.816749592364 \tabularnewline
5 & 103.509419861189 \tabularnewline
6 & 112.568778975344 \tabularnewline
7 & 112.875772422606 \tabularnewline
8 & 113.042027582665 \tabularnewline
9 & 114.938853309053 \tabularnewline
10 & 119.110591328309 \tabularnewline
11 & 120.132676653773 \tabularnewline
12 & 124.489196318395 \tabularnewline
13 & 125.974164017865 \tabularnewline
14 & 131.035453217822 \tabularnewline
15 & 132.191225124817 \tabularnewline
16 & 133.277622419026 \tabularnewline
17 & 136.857828605059 \tabularnewline
18 & 141.778443778745 \tabularnewline
19 & 156.570367566791 \tabularnewline
20 & 162.699689515062 \tabularnewline
21 & 184.408818180781 \tabularnewline
22 & 184.865851210601 \tabularnewline
23 & 198.195865184544 \tabularnewline
24 & 205.060598281125 \tabularnewline
25 & 212.405588989292 \tabularnewline
26 & 216.251919565285 \tabularnewline
27 & 217.060677092381 \tabularnewline
28 & 218.247061835893 \tabularnewline
29 & 222.324605026075 \tabularnewline
30 & 223.614874717416 \tabularnewline
31 & 241.515449192728 \tabularnewline
32 & 243.015875564718 \tabularnewline
33 & 256.522747529337 \tabularnewline
34 & 306.629589649213 \tabularnewline
35 & 316.363544778956 \tabularnewline
36 & 317.601502413238 \tabularnewline
37 & 321.260797483913 \tabularnewline
38 & 341.833014789385 \tabularnewline
39 & 361.52348471434 \tabularnewline
40 & 368.941455959642 \tabularnewline
41 & 382.816684657272 \tabularnewline
42 & 426.154810732356 \tabularnewline
43 & 449.080113042925 \tabularnewline
44 & 481.076693248871 \tabularnewline
45 & 613.203209458876 \tabularnewline
46 & 620.656691647729 \tabularnewline
47 & 751.086741999513 \tabularnewline
48 & 779.539280382058 \tabularnewline
49 & 834.860499381507 \tabularnewline
50 & 916.405313437702 \tabularnewline
51 & 1011.78763229961 \tabularnewline
52 & 1167.87294568267 \tabularnewline
53 & 1286.68446586160 \tabularnewline
54 & 1305.8631807257 \tabularnewline
55 & 1451.03580794201 \tabularnewline
56 & 2643.92770683996 \tabularnewline
57 & 4416.22745262789 \tabularnewline
58 & 7696.8443754616 \tabularnewline
59 & 16999.7672280781 \tabularnewline
\hline
\end{tabular}
%Source: https://freestatistics.org/blog/index.php?pk=24542&T=1

[TABLE]
[ROW][C]Summary of Dendrogram[/C][/ROW]
[ROW][C]Label[/C][C]Height[/C][/ROW]
[ROW][C]1[/C][C]60.7079072279716[/C][/ROW]
[ROW][C]2[/C][C]81.6452693056981[/C][/ROW]
[ROW][C]3[/C][C]94.4139290571048[/C][/ROW]
[ROW][C]4[/C][C]98.816749592364[/C][/ROW]
[ROW][C]5[/C][C]103.509419861189[/C][/ROW]
[ROW][C]6[/C][C]112.568778975344[/C][/ROW]
[ROW][C]7[/C][C]112.875772422606[/C][/ROW]
[ROW][C]8[/C][C]113.042027582665[/C][/ROW]
[ROW][C]9[/C][C]114.938853309053[/C][/ROW]
[ROW][C]10[/C][C]119.110591328309[/C][/ROW]
[ROW][C]11[/C][C]120.132676653773[/C][/ROW]
[ROW][C]12[/C][C]124.489196318395[/C][/ROW]
[ROW][C]13[/C][C]125.974164017865[/C][/ROW]
[ROW][C]14[/C][C]131.035453217822[/C][/ROW]
[ROW][C]15[/C][C]132.191225124817[/C][/ROW]
[ROW][C]16[/C][C]133.277622419026[/C][/ROW]
[ROW][C]17[/C][C]136.857828605059[/C][/ROW]
[ROW][C]18[/C][C]141.778443778745[/C][/ROW]
[ROW][C]19[/C][C]156.570367566791[/C][/ROW]
[ROW][C]20[/C][C]162.699689515062[/C][/ROW]
[ROW][C]21[/C][C]184.408818180781[/C][/ROW]
[ROW][C]22[/C][C]184.865851210601[/C][/ROW]
[ROW][C]23[/C][C]198.195865184544[/C][/ROW]
[ROW][C]24[/C][C]205.060598281125[/C][/ROW]
[ROW][C]25[/C][C]212.405588989292[/C][/ROW]
[ROW][C]26[/C][C]216.251919565285[/C][/ROW]
[ROW][C]27[/C][C]217.060677092381[/C][/ROW]
[ROW][C]28[/C][C]218.247061835893[/C][/ROW]
[ROW][C]29[/C][C]222.324605026075[/C][/ROW]
[ROW][C]30[/C][C]223.614874717416[/C][/ROW]
[ROW][C]31[/C][C]241.515449192728[/C][/ROW]
[ROW][C]32[/C][C]243.015875564718[/C][/ROW]
[ROW][C]33[/C][C]256.522747529337[/C][/ROW]
[ROW][C]34[/C][C]306.629589649213[/C][/ROW]
[ROW][C]35[/C][C]316.363544778956[/C][/ROW]
[ROW][C]36[/C][C]317.601502413238[/C][/ROW]
[ROW][C]37[/C][C]321.260797483913[/C][/ROW]
[ROW][C]38[/C][C]341.833014789385[/C][/ROW]
[ROW][C]39[/C][C]361.52348471434[/C][/ROW]
[ROW][C]40[/C][C]368.941455959642[/C][/ROW]
[ROW][C]41[/C][C]382.816684657272[/C][/ROW]
[ROW][C]42[/C][C]426.154810732356[/C][/ROW]
[ROW][C]43[/C][C]449.080113042925[/C][/ROW]
[ROW][C]44[/C][C]481.076693248871[/C][/ROW]
[ROW][C]45[/C][C]613.203209458876[/C][/ROW]
[ROW][C]46[/C][C]620.656691647729[/C][/ROW]
[ROW][C]47[/C][C]751.086741999513[/C][/ROW]
[ROW][C]48[/C][C]779.539280382058[/C][/ROW]
[ROW][C]49[/C][C]834.860499381507[/C][/ROW]
[ROW][C]50[/C][C]916.405313437702[/C][/ROW]
[ROW][C]51[/C][C]1011.78763229961[/C][/ROW]
[ROW][C]52[/C][C]1167.87294568267[/C][/ROW]
[ROW][C]53[/C][C]1286.68446586160[/C][/ROW]
[ROW][C]54[/C][C]1305.8631807257[/C][/ROW]
[ROW][C]55[/C][C]1451.03580794201[/C][/ROW]
[ROW][C]56[/C][C]2643.92770683996[/C][/ROW]
[ROW][C]57[/C][C]4416.22745262789[/C][/ROW]
[ROW][C]58[/C][C]7696.8443754616[/C][/ROW]
[ROW][C]59[/C][C]16999.7672280781[/C][/ROW]
[/TABLE]
Source: https://freestatistics.org/blog/index.php?pk=24542&T=1

Globally Unique Identifier (entire table): ba.freestatistics.org/blog/index.php?pk=24542&T=1

As an alternative you can also use a QR Code:  

The GUIDs for individual cells are displayed in the table below:

Summary of Dendrogram
LabelHeight
160.7079072279716
281.6452693056981
394.4139290571048
498.816749592364
5103.509419861189
6112.568778975344
7112.875772422606
8113.042027582665
9114.938853309053
10119.110591328309
11120.132676653773
12124.489196318395
13125.974164017865
14131.035453217822
15132.191225124817
16133.277622419026
17136.857828605059
18141.778443778745
19156.570367566791
20162.699689515062
21184.408818180781
22184.865851210601
23198.195865184544
24205.060598281125
25212.405588989292
26216.251919565285
27217.060677092381
28218.247061835893
29222.324605026075
30223.614874717416
31241.515449192728
32243.015875564718
33256.522747529337
34306.629589649213
35316.363544778956
36317.601502413238
37321.260797483913
38341.833014789385
39361.52348471434
40368.941455959642
41382.816684657272
42426.154810732356
43449.080113042925
44481.076693248871
45613.203209458876
46620.656691647729
47751.086741999513
48779.539280382058
49834.860499381507
50916.405313437702
511011.78763229961
521167.87294568267
531286.68446586160
541305.8631807257
551451.03580794201
562643.92770683996
574416.22745262789
587696.8443754616
5916999.7672280781


Parameters (Session):
par1 = ward ; par2 = ALL ; par3 = FALSE ; par4 = FALSE ;
Parameters (R input):
par1 = ward ; par2 = ALL ; par3 = FALSE ; par4 = FALSE ;
R code (references can be found in the software module):
par3 <- as.logical(par3)
par4 <- as.logical(par4)
if (par3 == 'TRUE'){
dum = xlab
xlab = ylab
ylab = dum
}
x <- t(y)
hc <- hclust(dist(x),method=par1)
d <- as.dendrogram(hc)
str(d)
mysub <- paste('Method: ',par1)
bitmap(file='test1.png')
if (par4 == 'TRUE'){
plot(d,main=main,ylab=ylab,xlab=xlab,horiz=par3, nodePar=list(pch = c(1,NA), cex=0.8, lab.cex = 0.8),type='t',center=T, sub=mysub)
} else {
plot(d,main=main,ylab=ylab,xlab=xlab,horiz=par3, nodePar=list(pch = c(1,NA), cex=0.8, lab.cex = 0.8), sub=mysub)
}
dev.off()
if (par2 != 'ALL'){
if (par3 == 'TRUE'){
ylab = 'cluster'
} else {
xlab = 'cluster'
}
par2 <- as.numeric(par2)
memb <- cutree(hc, k = par2)
cent <- NULL
for(k in 1:par2){
cent <- rbind(cent, colMeans(x[memb == k, , drop = FALSE]))
}
hc1 <- hclust(dist(cent),method=par1, members = table(memb))
de <- as.dendrogram(hc1)
bitmap(file='test2.png')
if (par4 == 'TRUE'){
plot(de,main=main,ylab=ylab,xlab=xlab,horiz=par3, nodePar=list(pch = c(1,NA), cex=0.8, lab.cex = 0.8),type='t',center=T, sub=mysub)
} else {
plot(de,main=main,ylab=ylab,xlab=xlab,horiz=par3, nodePar=list(pch = c(1,NA), cex=0.8, lab.cex = 0.8), sub=mysub)
}
dev.off()
str(de)
}
load(file='createtable')
a<-table.start()
a<-table.row.start(a)
a<-table.element(a,'Summary of Dendrogram',2,TRUE)
a<-table.row.end(a)
a<-table.row.start(a)
a<-table.element(a,'Label',header=TRUE)
a<-table.element(a,'Height',header=TRUE)
a<-table.row.end(a)
num <- length(x[,1])-1
for (i in 1:num)
{
a<-table.row.start(a)
a<-table.element(a,hc$labels[i])
a<-table.element(a,hc$height[i])
a<-table.row.end(a)
}
a<-table.end(a)
table.save(a,file='mytable1.tab')
if (par2 != 'ALL'){
a<-table.start()
a<-table.row.start(a)
a<-table.element(a,'Summary of Cut Dendrogram',2,TRUE)
a<-table.row.end(a)
a<-table.row.start(a)
a<-table.element(a,'Label',header=TRUE)
a<-table.element(a,'Height',header=TRUE)
a<-table.row.end(a)
num <- par2-1
for (i in 1:num)
{
a<-table.row.start(a)
a<-table.element(a,i)
a<-table.element(a,hc1$height[i])
a<-table.row.end(a)
}
a<-table.end(a)
table.save(a,file='mytable2.tab')
}