Free Statistics

of Irreproducible Research!

Author's title

Author*Unverified author*
R Software Modulerwasp_boxcoxlin.wasp
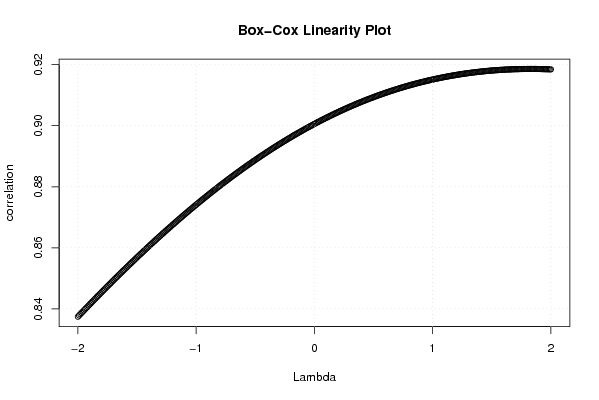
Title produced by softwareBox-Cox Linearity Plot
Date of computationThu, 13 Nov 2008 02:35:35 -0700
Cite this page as followsStatistical Computations at FreeStatistics.org, Office for Research Development and Education, URL https://freestatistics.org/blog/index.php?v=date/2008/Nov/13/t1226569020wowq8w1ksjqvf9b.htm/, Retrieved Sun, 19 May 2024 12:13:46 +0000
Statistical Computations at FreeStatistics.org, Office for Research Development and Education, URL https://freestatistics.org/blog/index.php?pk=24518, Retrieved Sun, 19 May 2024 12:13:46 +0000
QR Codes:

Original text written by user:
IsPrivate?No (this computation is public)
User-defined keywords
Estimated Impact139
Family? (F = Feedback message, R = changed R code, M = changed R Module, P = changed Parameters, D = changed Data)
F       [Box-Cox Linearity Plot] [workshop 3 Q3] [2008-11-13 09:35:35] [1a15026c70cce1c14dcfcc267c5d8133] [Current]
Feedback Forum
2008-11-15 13:23:13 [Ken Wright] [reply
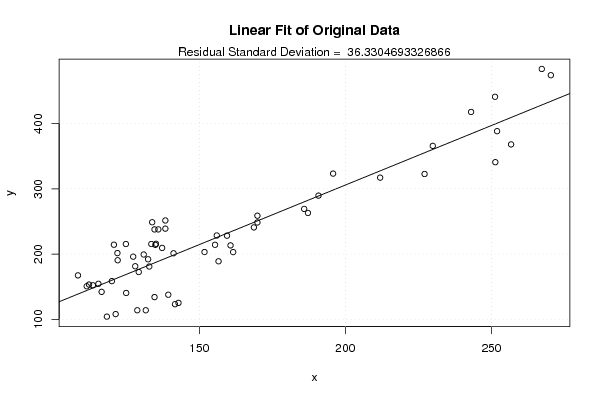
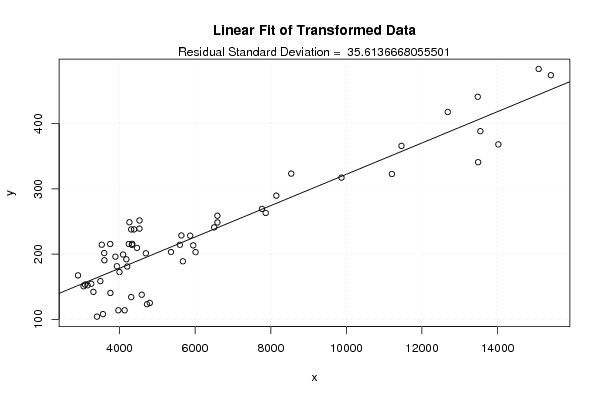
De eerste grafiek stelt de waarde van lambda voor die de maximale oplossing geeft om het verloop van de gegevens meer lineair te maken. In de berekening laat het programma lambda verschillende waarde aannemen tussen -2 en 2 en de grafiek stelt dan voor welke waarde lambda het beste is. In jouw voorbeeld dus 2. Maar de transformatie heeft in jouw voorbeeld maar weining invloed, dit kan je zien aan de puntenwolk die niet echt veranderd en ook de standaardafwijking die maar een klein beetje kleinder wordt.
2008-11-17 08:24:38 [006ad2c49b6a7c2ad6ab685cfc1dae56] [reply
De box-cox linearity ploty geeft de lambda-waarde weer die optimaal is om de gegevens te transformeren. In dit geval is die optimale waarde gelijk aan 2. Dat kan je zien doordat er een maximum is in de grafiek bij lambda=2.
2008-11-20 09:02:59 [Angelique Van de Vijver] [reply
Juiste conclusie: Er is inderdaad weinig verschil tussen de grafieken van de originele data en de getransformeerde data wat er op wijst dat de transformatie hier geen zin heeft. De puntenwolk ligt min of meer rond de diagonaal wat op een positieve correlatie wijst.
Extra uitleg: Op de box cox linearity plot worden verschillende correlaties voorgesteld doordat je telkens een ander lambda aanneemt. De lambda neemt waarden aan tussen -2 en 2. Op de grafiek zie je dan welke lambda het beste resultaat geeft(de optimale lambda-waarde) om de gegevens meer lineair te maken. In dit voorbeeld is de beste lambda-waarde dus 2 omdat hier de maximale oplossing is.
De transformatie heeft hier duidelijk maar weinig invloed aangezien de grafieken van de originele date en de getransformeerde data amper verschillen. Je ziet ook dat de originele standaardafwijking(36.33) maar weinig verschilt met de standaardafwijking van de getransformeerde data(35.61)
2008-11-24 12:13:38 [Anouk Greeve] [reply
Correcte interpretatie! We gaan hier op zoek naar de beste transformatie van een niet zo lineaire rechte naar een lineaire rechte. De Box-Cox Linearity plot is een plot dat de correlatie tussen Y en de veranderlijke X weergeeft, voor gegeven waarden van de lambda. De waarde die het best beantwoordt aan de maximumcorrelatie (of minimum voor negatieve correlatie) in de plot is de optimale keuze voor de lambda. Er is hier effectief weinig verschil tussen de grafieken wat aanduidt dat de transformatie hier weinig zin heeft.

Post a new message
Dataseries X:
118,4
121,4
128,8
131,7
141,7
142,9
139,4
134,7
125,0
113,6
111,5
108,5
112,3
116,6
115,5
120,1
132,9
128,1
129,3
132,5
131,0
124,9
120,8
122,0
122,1
127,4
135,2
137,3
135,0
136,0
138,4
134,7
138,4
133,9
133,6
141,2
151,8
155,4
156,6
161,6
160,7
156,0
159,5
168,7
169,9
169,9
185,9
190,8
195,8
211,9
227,1
251,3
256,7
251,9
251,2
270,3
267,2
243,0
229,9
187,2
Dataseries Y:
104,0
107,9
113,8
113,8
123,1
125,1
137,6
134,0
140,3
152,1
150,6
167,3
153,2
142,0
154,4
158,5
180,9
181,3
172,4
192,0
199,3
215,4
214,3
201,5
190,5
196,0
215,7
209,4
214,1
237,8
239,0
237,8
251,5
248,8
215,4
201,2
203,1
214,2
188,9
203,0
213,3
228,5
228,2
240,9
258,8
248,5
269,2
289,6
323,4
317,2
322,8
340,9
368,2
388,5
441,2
474,3
483,9
417,9
365,9
263,0


Summary of computational transaction
Raw Inputview raw input (R code)
Raw Outputview raw output of R engine
Computing time1 seconds
R Server'Gwilym Jenkins' @ 72.249.127.135

\begin{tabular}{lllllllll}
\hline
Summary of computational transaction \tabularnewline
Raw Input & view raw input (R code)  \tabularnewline
Raw Output & view raw output of R engine  \tabularnewline
Computing time & 1 seconds \tabularnewline
R Server & 'Gwilym Jenkins' @ 72.249.127.135 \tabularnewline
\hline
\end{tabular}
%Source: https://freestatistics.org/blog/index.php?pk=24518&T=0

[TABLE]
[ROW][C]Summary of computational transaction[/C][/ROW]
[ROW][C]Raw Input[/C][C]view raw input (R code) [/C][/ROW]
[ROW][C]Raw Output[/C][C]view raw output of R engine [/C][/ROW]
[ROW][C]Computing time[/C][C]1 seconds[/C][/ROW]
[ROW][C]R Server[/C][C]'Gwilym Jenkins' @ 72.249.127.135[/C][/ROW]
[/TABLE]
Source: https://freestatistics.org/blog/index.php?pk=24518&T=0

Globally Unique Identifier (entire table): ba.freestatistics.org/blog/index.php?pk=24518&T=0

As an alternative you can also use a QR Code:  

The GUIDs for individual cells are displayed in the table below:

Summary of computational transaction
Raw Inputview raw input (R code)
Raw Outputview raw output of R engine
Computing time1 seconds
R Server'Gwilym Jenkins' @ 72.249.127.135


Box-Cox Linearity Plot
# observations x60
maximum correlation0.918594637483828
optimal lambda(x)1.83
Residual SD (orginial)36.3304693326866
Residual SD (transformed)35.6136668055501

\begin{tabular}{lllllllll}
\hline
Box-Cox Linearity Plot \tabularnewline
# observations x & 60 \tabularnewline
maximum correlation & 0.918594637483828 \tabularnewline
optimal lambda(x) & 1.83 \tabularnewline
Residual SD (orginial) & 36.3304693326866 \tabularnewline
Residual SD (transformed) & 35.6136668055501 \tabularnewline
\hline
\end{tabular}
%Source: https://freestatistics.org/blog/index.php?pk=24518&T=1

[TABLE]
[ROW][C]Box-Cox Linearity Plot[/C][/ROW]
[ROW][C]# observations x[/C][C]60[/C][/ROW]
[ROW][C]maximum correlation[/C][C]0.918594637483828[/C][/ROW]
[ROW][C]optimal lambda(x)[/C][C]1.83[/C][/ROW]
[ROW][C]Residual SD (orginial)[/C][C]36.3304693326866[/C][/ROW]
[ROW][C]Residual SD (transformed)[/C][C]35.6136668055501[/C][/ROW]
[/TABLE]
Source: https://freestatistics.org/blog/index.php?pk=24518&T=1

Globally Unique Identifier (entire table): ba.freestatistics.org/blog/index.php?pk=24518&T=1

As an alternative you can also use a QR Code:  

The GUIDs for individual cells are displayed in the table below:

Box-Cox Linearity Plot
# observations x60
maximum correlation0.918594637483828
optimal lambda(x)1.83
Residual SD (orginial)36.3304693326866
Residual SD (transformed)35.6136668055501


Parameters (Session):
Parameters (R input):
R code (references can be found in the software module):
n <- length(x)
c <- array(NA,dim=c(401))
l <- array(NA,dim=c(401))
mx <- 0
mxli <- -999
for (i in 1:401)
{
l[i] <- (i-201)/100
if (l[i] != 0)
{
x1 <- (x^l[i] - 1) / l[i]
} else {
x1 <- log(x)
}
c[i] <- cor(x1,y)
if (mx < abs(c[i]))
{
mx <- abs(c[i])
mxli <- l[i]
}
}
c
mx
mxli
if (mxli != 0)
{
x1 <- (x^mxli - 1) / mxli
} else {
x1 <- log(x)
}
r<-lm(y~x)
se <- sqrt(var(r$residuals))
r1 <- lm(y~x1)
se1 <- sqrt(var(r1$residuals))
bitmap(file='test1.png')
plot(l,c,main='Box-Cox Linearity Plot',xlab='Lambda',ylab='correlation')
grid()
dev.off()
bitmap(file='test2.png')
plot(x,y,main='Linear Fit of Original Data',xlab='x',ylab='y')
abline(r)
grid()
mtext(paste('Residual Standard Deviation = ',se))
dev.off()
bitmap(file='test3.png')
plot(x1,y,main='Linear Fit of Transformed Data',xlab='x',ylab='y')
abline(r1)
grid()
mtext(paste('Residual Standard Deviation = ',se1))
dev.off()
load(file='createtable')
a<-table.start()
a<-table.row.start(a)
a<-table.element(a,'Box-Cox Linearity Plot',2,TRUE)
a<-table.row.end(a)
a<-table.row.start(a)
a<-table.element(a,'# observations x',header=TRUE)
a<-table.element(a,n)
a<-table.row.end(a)
a<-table.row.start(a)
a<-table.element(a,'maximum correlation',header=TRUE)
a<-table.element(a,mx)
a<-table.row.end(a)
a<-table.row.start(a)
a<-table.element(a,'optimal lambda(x)',header=TRUE)
a<-table.element(a,mxli)
a<-table.row.end(a)
a<-table.row.start(a)
a<-table.element(a,'Residual SD (orginial)',header=TRUE)
a<-table.element(a,se)
a<-table.row.end(a)
a<-table.row.start(a)
a<-table.element(a,'Residual SD (transformed)',header=TRUE)
a<-table.element(a,se1)
a<-table.row.end(a)
a<-table.end(a)
table.save(a,file='mytable.tab')