Free Statistics

of Irreproducible Research!

Author's title

Author*The author of this computation has been verified*
R Software Modulerwasp_boxcoxlin.wasp
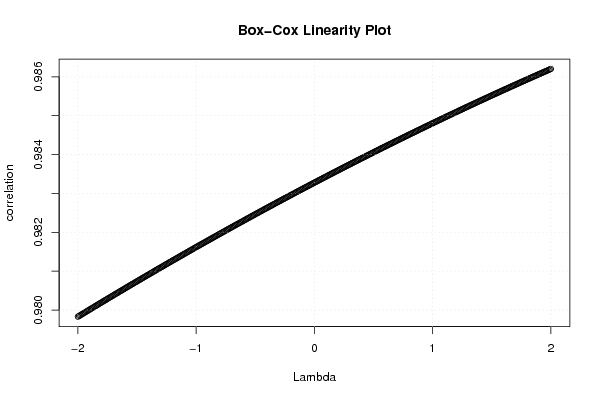
Title produced by softwareBox-Cox Linearity Plot
Date of computationThu, 13 Nov 2008 01:52:41 -0700
Cite this page as followsStatistical Computations at FreeStatistics.org, Office for Research Development and Education, URL https://freestatistics.org/blog/index.php?v=date/2008/Nov/13/t1226566431hd2zqqe7ykrnhch.htm/, Retrieved Sun, 19 May 2024 12:36:30 +0000
Statistical Computations at FreeStatistics.org, Office for Research Development and Education, URL https://freestatistics.org/blog/index.php?pk=24490, Retrieved Sun, 19 May 2024 12:36:30 +0000
QR Codes:

Original text written by user:
IsPrivate?No (this computation is public)
User-defined keywords
Estimated Impact177
Family? (F = Feedback message, R = changed R code, M = changed R Module, P = changed Parameters, D = changed Data)
F       [Box-Cox Linearity Plot] [Box-Cox linear plot] [2008-11-13 08:52:41] [c5d6d05aee6be5527ac4a30a8c3b8fe5] [Current]
Feedback Forum
2008-11-18 13:37:53 [Julie Govaerts] [reply
er worden 2 variabelen voorgesteld dmv een scatterplot en dan gaan we kijken hoe lineair zij zijn.
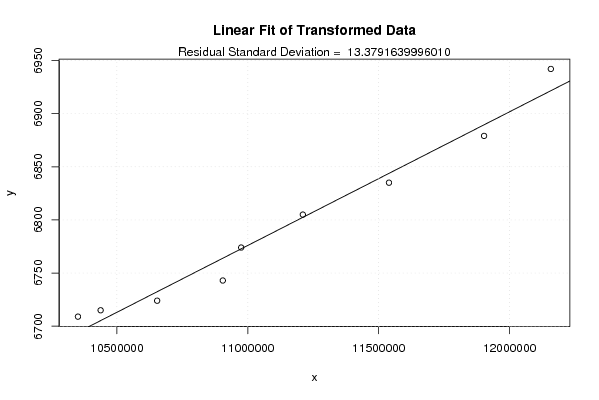
Doel: De transformatie vinden van de X-variabele die de correlatie tussen Y en een X-variabele verbetert = meer lineair = zodanig dat de scatterplot tss. x en y zo dicht mogelijk op een rechte ligt

λ (lambda) is de transformatieparameter die schommelt tussen -2 en 2 = wordt toegepast op X --> de optimale waarde van lambda zoeken (!kan ook soms niet de moeite zijn = niet veel verbeterd!)

hier zie je dat de correlatie stijgt als lambda stijgt, maar na de transformatie is er niet direct een verbetering te zien
2008-11-22 14:47:30 [c00776cbed2786c9c4960950021bd861] [reply
De Box-cox linearity plot = plot van de correlatie tussen Y en getransformeerde x-variabelen voor bepaalde waarden van lambda.
We zien dat voor lambda = 2, de hoogste correlatie bestaat.
We zien ook dat er een vrij lineair verband wordt weergegeven in deze grafiek.
Bij de linear Fit kunnen we concluderen dat de transformatie niet veel heeft geholpen, er is maar weinig verbetering. Dit kunnen we ook merken aan de Residual Standard Deviation --> er is maar een kleine daling, wat wil zeggen dat de transformatie niet echt voor een verbetering heeft gezorgd.
2008-11-24 14:45:20 [Ellen Van den Broeck] [reply
In een box-cox linearityplot worden 2 variabelen in verband gebracht.
De X variabelen worden getransformeerd aan de hand van de Lamba die varieert tussen -2 en 2. Deze transformaties worden uitgevoerd om de scatterplot lineairder te maken. De lijn die je bekomt moet ergens een maximum bekomen. Bij de student is dit niet het geval. Dus je hoopt een bergparabool te bekomen.
2008-11-24 22:03:19 [Erik Geysen] [reply
Bij de Box-cox linearity plot worden de x-variabelen getransformeerd voor bepaalde lambdawaarden.
De hoogste correlatie is er wnn lambda = 2. Er is een lineair verband te zien op de grafiek. De transformatie heeft dus niet veel geholpen. Dit zien we ook aan de Residual Standard Deviation die maar lichtjes daalt.

Post a new message
Dataseries X:
4931
4879
4804
4735
4685
4670
4616
4569
4550
Dataseries Y:
6942
6879
6835
6805
6774
6743
6724
6715
6709


Summary of computational transaction
Raw Inputview raw input (R code)
Raw Outputview raw output of R engine
Computing time2 seconds
R Server'George Udny Yule' @ 72.249.76.132

\begin{tabular}{lllllllll}
\hline
Summary of computational transaction \tabularnewline
Raw Input & view raw input (R code)  \tabularnewline
Raw Output & view raw output of R engine  \tabularnewline
Computing time & 2 seconds \tabularnewline
R Server & 'George Udny Yule' @ 72.249.76.132 \tabularnewline
\hline
\end{tabular}
%Source: https://freestatistics.org/blog/index.php?pk=24490&T=0

[TABLE]
[ROW][C]Summary of computational transaction[/C][/ROW]
[ROW][C]Raw Input[/C][C]view raw input (R code) [/C][/ROW]
[ROW][C]Raw Output[/C][C]view raw output of R engine [/C][/ROW]
[ROW][C]Computing time[/C][C]2 seconds[/C][/ROW]
[ROW][C]R Server[/C][C]'George Udny Yule' @ 72.249.76.132[/C][/ROW]
[/TABLE]
Source: https://freestatistics.org/blog/index.php?pk=24490&T=0

Globally Unique Identifier (entire table): ba.freestatistics.org/blog/index.php?pk=24490&T=0

As an alternative you can also use a QR Code:  

The GUIDs for individual cells are displayed in the table below:

Summary of computational transaction
Raw Inputview raw input (R code)
Raw Outputview raw output of R engine
Computing time2 seconds
R Server'George Udny Yule' @ 72.249.76.132


Box-Cox Linearity Plot
# observations x9
maximum correlation0.986202238699077
optimal lambda(x)2
Residual SD (orginial)14.0352095240071
Residual SD (transformed)13.3791639996010

\begin{tabular}{lllllllll}
\hline
Box-Cox Linearity Plot \tabularnewline
# observations x & 9 \tabularnewline
maximum correlation & 0.986202238699077 \tabularnewline
optimal lambda(x) & 2 \tabularnewline
Residual SD (orginial) & 14.0352095240071 \tabularnewline
Residual SD (transformed) & 13.3791639996010 \tabularnewline
\hline
\end{tabular}
%Source: https://freestatistics.org/blog/index.php?pk=24490&T=1

[TABLE]
[ROW][C]Box-Cox Linearity Plot[/C][/ROW]
[ROW][C]# observations x[/C][C]9[/C][/ROW]
[ROW][C]maximum correlation[/C][C]0.986202238699077[/C][/ROW]
[ROW][C]optimal lambda(x)[/C][C]2[/C][/ROW]
[ROW][C]Residual SD (orginial)[/C][C]14.0352095240071[/C][/ROW]
[ROW][C]Residual SD (transformed)[/C][C]13.3791639996010[/C][/ROW]
[/TABLE]
Source: https://freestatistics.org/blog/index.php?pk=24490&T=1

Globally Unique Identifier (entire table): ba.freestatistics.org/blog/index.php?pk=24490&T=1

As an alternative you can also use a QR Code:  

The GUIDs for individual cells are displayed in the table below:

Box-Cox Linearity Plot
# observations x9
maximum correlation0.986202238699077
optimal lambda(x)2
Residual SD (orginial)14.0352095240071
Residual SD (transformed)13.3791639996010


Parameters (Session):
Parameters (R input):
R code (references can be found in the software module):
n <- length(x)
c <- array(NA,dim=c(401))
l <- array(NA,dim=c(401))
mx <- 0
mxli <- -999
for (i in 1:401)
{
l[i] <- (i-201)/100
if (l[i] != 0)
{
x1 <- (x^l[i] - 1) / l[i]
} else {
x1 <- log(x)
}
c[i] <- cor(x1,y)
if (mx < abs(c[i]))
{
mx <- abs(c[i])
mxli <- l[i]
}
}
c
mx
mxli
if (mxli != 0)
{
x1 <- (x^mxli - 1) / mxli
} else {
x1 <- log(x)
}
r<-lm(y~x)
se <- sqrt(var(r$residuals))
r1 <- lm(y~x1)
se1 <- sqrt(var(r1$residuals))
bitmap(file='test1.png')
plot(l,c,main='Box-Cox Linearity Plot',xlab='Lambda',ylab='correlation')
grid()
dev.off()
bitmap(file='test2.png')
plot(x,y,main='Linear Fit of Original Data',xlab='x',ylab='y')
abline(r)
grid()
mtext(paste('Residual Standard Deviation = ',se))
dev.off()
bitmap(file='test3.png')
plot(x1,y,main='Linear Fit of Transformed Data',xlab='x',ylab='y')
abline(r1)
grid()
mtext(paste('Residual Standard Deviation = ',se1))
dev.off()
load(file='createtable')
a<-table.start()
a<-table.row.start(a)
a<-table.element(a,'Box-Cox Linearity Plot',2,TRUE)
a<-table.row.end(a)
a<-table.row.start(a)
a<-table.element(a,'# observations x',header=TRUE)
a<-table.element(a,n)
a<-table.row.end(a)
a<-table.row.start(a)
a<-table.element(a,'maximum correlation',header=TRUE)
a<-table.element(a,mx)
a<-table.row.end(a)
a<-table.row.start(a)
a<-table.element(a,'optimal lambda(x)',header=TRUE)
a<-table.element(a,mxli)
a<-table.row.end(a)
a<-table.row.start(a)
a<-table.element(a,'Residual SD (orginial)',header=TRUE)
a<-table.element(a,se)
a<-table.row.end(a)
a<-table.row.start(a)
a<-table.element(a,'Residual SD (transformed)',header=TRUE)
a<-table.element(a,se1)
a<-table.row.end(a)
a<-table.end(a)
table.save(a,file='mytable.tab')