Free Statistics

of Irreproducible Research!

Author's title

Author*The author of this computation has been verified*
R Software Modulerwasp_hierarchicalclustering.wasp
Title produced by softwareHierarchical Clustering
Date of computationThu, 13 Nov 2008 01:23:58 -0700
Cite this page as followsStatistical Computations at FreeStatistics.org, Office for Research Development and Education, URL https://freestatistics.org/blog/index.php?v=date/2008/Nov/13/t12265646859phfukjnotj0jgg.htm/, Retrieved Sun, 19 May 2024 12:02:27 +0000
Statistical Computations at FreeStatistics.org, Office for Research Development and Education, URL https://freestatistics.org/blog/index.php?pk=24480, Retrieved Sun, 19 May 2024 12:02:27 +0000
QR Codes:

Original text written by user:
IsPrivate?No (this computation is public)
User-defined keywordsnatalie en evelyn
Estimated Impact212
Family? (F = Feedback message, R = changed R code, M = changed R Module, P = changed Parameters, D = changed Data)
-     [Bivariate Kernel Density Estimation] [Bivariate Kernel ...] [2008-11-11 14:08:00] [adb6b6905cde49db36d59ca44433140d]
F RMPD  [Hierarchical Clustering] [Hierarchical Clus...] [2008-11-11 23:34:50] [b591abfa820a394aeb0c5ebd9cfa1091]
F    D      [Hierarchical Clustering] [hierarchical clus...] [2008-11-13 08:23:58] [32a7b12f2bdf14b45f7a9a96ba1ab98d] [Current]
Feedback Forum
2008-11-15 13:16:21 [Hundra Smet] [reply
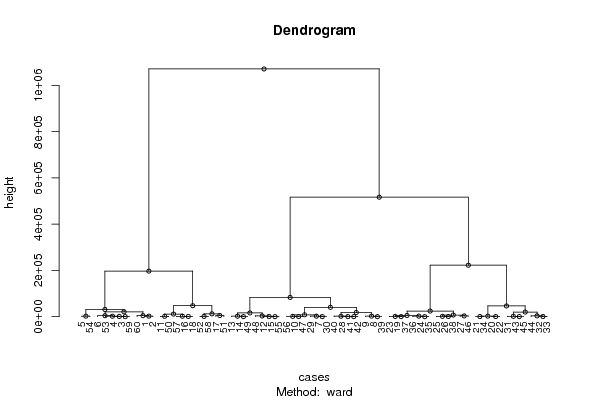
het nut van een dendrogram is dat we kunnen zien welke gegevens in 1 groep zitten en welke we dus anders moeten behandelen.

de periodes onder de linkertak zijn gelijkaardig => gegevens tot gegeven 51 (Xas) zitten in de linkercluster. de overige in de rechter. hieruit kunnen we afleiden dat er een opsplitsing moet worden gemaakt bij de behandeling van de verschillende gegevens.
  2008-11-17 08:56:59 [Katrijn Truyman] [reply
In de linkercluster zitten toch ook gegevens tot 60... ?

Bij het dendrogram wordt wordt te tijdreeks opgesplits in 2 delen. Elke cluster wordt opnieuw onderverdeel, tot je in 1 enkele periode terechtkomt.
2008-11-17 16:15:38 [Stefan Temmerman] [reply
Een dendrogram maakt op een visuele manier duidelijk welke observaties in 1 groep zitten. Hier kan men afleiden dat de observaties verspreid over de clusters verdeeld zijn. Wat wel opvalt is dat in het linkerdeel bijna uitzonderlijk bestaat uit de eerste en de laatste observaties.
2008-11-18 10:30:23 [72e979bcc364082694890d2eccc1a66f] [reply
Er is duidelijk te zien dat de gegevens worden opgedeeld in 2 clusters en dan verder worden opgedeeld. De gegevens die samen staan zijn gelijkaardig.
2008-11-18 13:45:41 [Julie Govaerts] [reply
Dendogram --> maakt in periodes groepen die gelijkaardig zijn = de tijdsreeks wordt gesplitst
eerder een exploratief instrument (bv voor in de marketing = welke producten horen samen in 1 groep?)
2008-11-24 16:24:07 [5faab2fc6fb120339944528a32d48a04] [reply
Door een dendogram te maken kunnen we clustergroepen opsplitsen. Eerst worden de gegevens opgesplitst in 2 groepen. Daarna worden deze 2 telkens opnieuw verder onderverdeeld. Je kan aan de getallen onderaan de dendogram afleiden welke data bij elkaar horen en die dus waarschijnlijk in dezelfde omstandigheden voorvallen. De gegevens in de clusters zijn hier zeer uiteenlopend.
2008-11-24 20:57:36 [Kevin Vermeiren] [reply
Hier heeft de student ook geen enkel idee waar de module voor staat. Het dendogram dient gebruikt te worden om te onderzoeken of er overeenkomsten zijn tussen groepen. Het dendogram werkt als volgt: de tijdreeksen worden eerst opgesplitst in 2 delen met in elk deel gelijke periodes. Bijvoorbeeld: lage volgnummers in de eerste cluster, hoge volgnummers in de 2de cluster of de eerste maanden in de eerste cluster en de andere maanden in de 2de cluster. Vervolgens worden de groepen steeds verder opgedeeld. Dit proces gaat verder tot er op een gegeven moment elke cluster slechts 1 element bevat.

Post a new message
Dataseries X:
3.253	11.836	345	6.06	519164
3.233	11.85	334	5.983	517009
3.196	11.897	345	6.11	509933
3.138	12.082	333	6.143	509127
3.091	11.936	336	6.093	500857
3.17	11.928	324	6.148	506971
3.378	12.646	320	6.464	569323
3.468	12.747	330	6.532	579714
3.33	12.447	313	6.321	577992
3.413	12.445	301	6.23	565464
3.356	12.257	288	6.176	547344
3.525	12.878	294	6.338	554788
3.633	13.69	302	6.462	562325
3.597	13.665	294	6.401	560854
3.6	13.78	293	6.46	555332
3.522	13.608	290	6.519	543599
3.503	13.375	283	6.542	536662
3.532	13.376	286	6.637	542722
3.686	13.918	293	7.114	593530
3.748	14.304	334	7.579	610763
3.672	13.877	329	7.408	612613
3.843	14.543	411	8.243	611324
3.905	14.291	416	8.243	594167
3.999	14.788	418	8.434	595454
4.07	15.241	408	8.576	590865
4.084	15.265	402	8.58	589379
4.042	15.322	401	8.645	584428
3.951	15.175	400	8.66	573100
3.933	14.817	389	8.72	567456
3.958	14.579	371	8.787	569028
4.147	15.247	364	9.162	620735
4.221	15.385	350	9.144	628884
4.058	14.891	332	8.806	628232
4.057	14.766	323	8.778	612117
4.089	14.42	316	8.66	595404
4.268	14.85	312	8.826	597141
4.309	15.117	315	8.609	593408
4.303	15.352	314	8.628	590072
4.177	15.099	313	8.619	579799
4.117	15.291	314	8.775	574205
4.065	15.208	317	8.84	572775
3.983	14.995	308	8.745	572942
4.091	15.454	312	9.092	619567
4.067	15.251	306	8.934	625809
4.024	14.975	304	8.749	619916
3.868	14.005	297	8.298	587625
3.8	13.55	284	8.067	565742
3.804	13.422	278	7.969	557274
3.862	13.848	273	7.999	560576
3.792	13.376	265	7.865	548854
3.674	13.038	259	7.746	531673
3.56	12.974	252	7.633	525919
3.489	12.554	245	7.458	511038
3.412	11.971	235	7.391	498662
3.674	12.916	232	7.856	555362
3.672	12.757	229	7.72	564591
3.463	11.924	219	7.297	541657
3.429	11.693	218	7.123	527070
3.4	11.382	215	7.004	509846
3.533	11.821	211	7.151	514258


Summary of computational transaction
Raw Inputview raw input (R code)
Raw Outputview raw output of R engine
Computing time1 seconds
R Server'Gwilym Jenkins' @ 72.249.127.135

\begin{tabular}{lllllllll}
\hline
Summary of computational transaction \tabularnewline
Raw Input & view raw input (R code)  \tabularnewline
Raw Output & view raw output of R engine  \tabularnewline
Computing time & 1 seconds \tabularnewline
R Server & 'Gwilym Jenkins' @ 72.249.127.135 \tabularnewline
\hline
\end{tabular}
%Source: https://freestatistics.org/blog/index.php?pk=24480&T=0

[TABLE]
[ROW][C]Summary of computational transaction[/C][/ROW]
[ROW][C]Raw Input[/C][C]view raw input (R code) [/C][/ROW]
[ROW][C]Raw Output[/C][C]view raw output of R engine [/C][/ROW]
[ROW][C]Computing time[/C][C]1 seconds[/C][/ROW]
[ROW][C]R Server[/C][C]'Gwilym Jenkins' @ 72.249.127.135[/C][/ROW]
[/TABLE]
Source: https://freestatistics.org/blog/index.php?pk=24480&T=0

Globally Unique Identifier (entire table): ba.freestatistics.org/blog/index.php?pk=24480&T=0

As an alternative you can also use a QR Code:  

The GUIDs for individual cells are displayed in the table below:

Summary of computational transaction
Raw Inputview raw input (R code)
Raw Outputview raw output of R engine
Computing time1 seconds
R Server'Gwilym Jenkins' @ 72.249.127.135


Summary of Dendrogram
LabelHeight
167.9977998761725
286.7432426993596
3113.596631112018
4123.984114930099
5156.429236643922
6167.242521859723
7278.527817933865
8278.796802919259
9289.762161891826
10299.39183224998
11349.092182065139
12496.039126930528
13566.260105465677
14652.248713949671
15698.564999004388
16724.895682673861
17877.009160640868
18901.644512415745
19970.996119145077
201151.50289544664
211210.53727415798
221259.34343342751
231290.18764759486
241510.17657741669
251714.60025740463
261786.42834098913
271825.60389537059
282053.90963877567
292115.61348767789
302155.02807557697
312193.78964305037
322197.32286864493
332247.02221327751
342323.81062735360
352972.10862885681
363198.69143325423
373448.21997348197
384234.56471482392
394389.37624872946
404989.05788625728
415205.10868100962
427076.79427013232
437999.42063392513
4411112.7154874694
4512275.9457534153
4616125.7519054347
4717934.1541164364
4819877.1778603823
4921068.8487006290
5024190.9911248107
5130990.7520222620
5240318.9888066459
5346212.8505912751
5447469.9915188774
5583355.6568679397
56197028.403986017
57222619.182020617
58516870.818754392
591071641.93582343

\begin{tabular}{lllllllll}
\hline
Summary of Dendrogram \tabularnewline
Label & Height \tabularnewline
1 & 67.9977998761725 \tabularnewline
2 & 86.7432426993596 \tabularnewline
3 & 113.596631112018 \tabularnewline
4 & 123.984114930099 \tabularnewline
5 & 156.429236643922 \tabularnewline
6 & 167.242521859723 \tabularnewline
7 & 278.527817933865 \tabularnewline
8 & 278.796802919259 \tabularnewline
9 & 289.762161891826 \tabularnewline
10 & 299.39183224998 \tabularnewline
11 & 349.092182065139 \tabularnewline
12 & 496.039126930528 \tabularnewline
13 & 566.260105465677 \tabularnewline
14 & 652.248713949671 \tabularnewline
15 & 698.564999004388 \tabularnewline
16 & 724.895682673861 \tabularnewline
17 & 877.009160640868 \tabularnewline
18 & 901.644512415745 \tabularnewline
19 & 970.996119145077 \tabularnewline
20 & 1151.50289544664 \tabularnewline
21 & 1210.53727415798 \tabularnewline
22 & 1259.34343342751 \tabularnewline
23 & 1290.18764759486 \tabularnewline
24 & 1510.17657741669 \tabularnewline
25 & 1714.60025740463 \tabularnewline
26 & 1786.42834098913 \tabularnewline
27 & 1825.60389537059 \tabularnewline
28 & 2053.90963877567 \tabularnewline
29 & 2115.61348767789 \tabularnewline
30 & 2155.02807557697 \tabularnewline
31 & 2193.78964305037 \tabularnewline
32 & 2197.32286864493 \tabularnewline
33 & 2247.02221327751 \tabularnewline
34 & 2323.81062735360 \tabularnewline
35 & 2972.10862885681 \tabularnewline
36 & 3198.69143325423 \tabularnewline
37 & 3448.21997348197 \tabularnewline
38 & 4234.56471482392 \tabularnewline
39 & 4389.37624872946 \tabularnewline
40 & 4989.05788625728 \tabularnewline
41 & 5205.10868100962 \tabularnewline
42 & 7076.79427013232 \tabularnewline
43 & 7999.42063392513 \tabularnewline
44 & 11112.7154874694 \tabularnewline
45 & 12275.9457534153 \tabularnewline
46 & 16125.7519054347 \tabularnewline
47 & 17934.1541164364 \tabularnewline
48 & 19877.1778603823 \tabularnewline
49 & 21068.8487006290 \tabularnewline
50 & 24190.9911248107 \tabularnewline
51 & 30990.7520222620 \tabularnewline
52 & 40318.9888066459 \tabularnewline
53 & 46212.8505912751 \tabularnewline
54 & 47469.9915188774 \tabularnewline
55 & 83355.6568679397 \tabularnewline
56 & 197028.403986017 \tabularnewline
57 & 222619.182020617 \tabularnewline
58 & 516870.818754392 \tabularnewline
59 & 1071641.93582343 \tabularnewline
\hline
\end{tabular}
%Source: https://freestatistics.org/blog/index.php?pk=24480&T=1

[TABLE]
[ROW][C]Summary of Dendrogram[/C][/ROW]
[ROW][C]Label[/C][C]Height[/C][/ROW]
[ROW][C]1[/C][C]67.9977998761725[/C][/ROW]
[ROW][C]2[/C][C]86.7432426993596[/C][/ROW]
[ROW][C]3[/C][C]113.596631112018[/C][/ROW]
[ROW][C]4[/C][C]123.984114930099[/C][/ROW]
[ROW][C]5[/C][C]156.429236643922[/C][/ROW]
[ROW][C]6[/C][C]167.242521859723[/C][/ROW]
[ROW][C]7[/C][C]278.527817933865[/C][/ROW]
[ROW][C]8[/C][C]278.796802919259[/C][/ROW]
[ROW][C]9[/C][C]289.762161891826[/C][/ROW]
[ROW][C]10[/C][C]299.39183224998[/C][/ROW]
[ROW][C]11[/C][C]349.092182065139[/C][/ROW]
[ROW][C]12[/C][C]496.039126930528[/C][/ROW]
[ROW][C]13[/C][C]566.260105465677[/C][/ROW]
[ROW][C]14[/C][C]652.248713949671[/C][/ROW]
[ROW][C]15[/C][C]698.564999004388[/C][/ROW]
[ROW][C]16[/C][C]724.895682673861[/C][/ROW]
[ROW][C]17[/C][C]877.009160640868[/C][/ROW]
[ROW][C]18[/C][C]901.644512415745[/C][/ROW]
[ROW][C]19[/C][C]970.996119145077[/C][/ROW]
[ROW][C]20[/C][C]1151.50289544664[/C][/ROW]
[ROW][C]21[/C][C]1210.53727415798[/C][/ROW]
[ROW][C]22[/C][C]1259.34343342751[/C][/ROW]
[ROW][C]23[/C][C]1290.18764759486[/C][/ROW]
[ROW][C]24[/C][C]1510.17657741669[/C][/ROW]
[ROW][C]25[/C][C]1714.60025740463[/C][/ROW]
[ROW][C]26[/C][C]1786.42834098913[/C][/ROW]
[ROW][C]27[/C][C]1825.60389537059[/C][/ROW]
[ROW][C]28[/C][C]2053.90963877567[/C][/ROW]
[ROW][C]29[/C][C]2115.61348767789[/C][/ROW]
[ROW][C]30[/C][C]2155.02807557697[/C][/ROW]
[ROW][C]31[/C][C]2193.78964305037[/C][/ROW]
[ROW][C]32[/C][C]2197.32286864493[/C][/ROW]
[ROW][C]33[/C][C]2247.02221327751[/C][/ROW]
[ROW][C]34[/C][C]2323.81062735360[/C][/ROW]
[ROW][C]35[/C][C]2972.10862885681[/C][/ROW]
[ROW][C]36[/C][C]3198.69143325423[/C][/ROW]
[ROW][C]37[/C][C]3448.21997348197[/C][/ROW]
[ROW][C]38[/C][C]4234.56471482392[/C][/ROW]
[ROW][C]39[/C][C]4389.37624872946[/C][/ROW]
[ROW][C]40[/C][C]4989.05788625728[/C][/ROW]
[ROW][C]41[/C][C]5205.10868100962[/C][/ROW]
[ROW][C]42[/C][C]7076.79427013232[/C][/ROW]
[ROW][C]43[/C][C]7999.42063392513[/C][/ROW]
[ROW][C]44[/C][C]11112.7154874694[/C][/ROW]
[ROW][C]45[/C][C]12275.9457534153[/C][/ROW]
[ROW][C]46[/C][C]16125.7519054347[/C][/ROW]
[ROW][C]47[/C][C]17934.1541164364[/C][/ROW]
[ROW][C]48[/C][C]19877.1778603823[/C][/ROW]
[ROW][C]49[/C][C]21068.8487006290[/C][/ROW]
[ROW][C]50[/C][C]24190.9911248107[/C][/ROW]
[ROW][C]51[/C][C]30990.7520222620[/C][/ROW]
[ROW][C]52[/C][C]40318.9888066459[/C][/ROW]
[ROW][C]53[/C][C]46212.8505912751[/C][/ROW]
[ROW][C]54[/C][C]47469.9915188774[/C][/ROW]
[ROW][C]55[/C][C]83355.6568679397[/C][/ROW]
[ROW][C]56[/C][C]197028.403986017[/C][/ROW]
[ROW][C]57[/C][C]222619.182020617[/C][/ROW]
[ROW][C]58[/C][C]516870.818754392[/C][/ROW]
[ROW][C]59[/C][C]1071641.93582343[/C][/ROW]
[/TABLE]
Source: https://freestatistics.org/blog/index.php?pk=24480&T=1

Globally Unique Identifier (entire table): ba.freestatistics.org/blog/index.php?pk=24480&T=1

As an alternative you can also use a QR Code:  

The GUIDs for individual cells are displayed in the table below:

Summary of Dendrogram
LabelHeight
167.9977998761725
286.7432426993596
3113.596631112018
4123.984114930099
5156.429236643922
6167.242521859723
7278.527817933865
8278.796802919259
9289.762161891826
10299.39183224998
11349.092182065139
12496.039126930528
13566.260105465677
14652.248713949671
15698.564999004388
16724.895682673861
17877.009160640868
18901.644512415745
19970.996119145077
201151.50289544664
211210.53727415798
221259.34343342751
231290.18764759486
241510.17657741669
251714.60025740463
261786.42834098913
271825.60389537059
282053.90963877567
292115.61348767789
302155.02807557697
312193.78964305037
322197.32286864493
332247.02221327751
342323.81062735360
352972.10862885681
363198.69143325423
373448.21997348197
384234.56471482392
394389.37624872946
404989.05788625728
415205.10868100962
427076.79427013232
437999.42063392513
4411112.7154874694
4512275.9457534153
4616125.7519054347
4717934.1541164364
4819877.1778603823
4921068.8487006290
5024190.9911248107
5130990.7520222620
5240318.9888066459
5346212.8505912751
5447469.9915188774
5583355.6568679397
56197028.403986017
57222619.182020617
58516870.818754392
591071641.93582343


Parameters (Session):
par1 = ward ; par2 = ALL ; par3 = FALSE ; par4 = FALSE ;
Parameters (R input):
par1 = ward ; par2 = ALL ; par3 = FALSE ; par4 = FALSE ;
R code (references can be found in the software module):
par3 <- as.logical(par3)
par4 <- as.logical(par4)
if (par3 == 'TRUE'){
dum = xlab
xlab = ylab
ylab = dum
}
x <- t(y)
hc <- hclust(dist(x),method=par1)
d <- as.dendrogram(hc)
str(d)
mysub <- paste('Method: ',par1)
bitmap(file='test1.png')
if (par4 == 'TRUE'){
plot(d,main=main,ylab=ylab,xlab=xlab,horiz=par3, nodePar=list(pch = c(1,NA), cex=0.8, lab.cex = 0.8),type='t',center=T, sub=mysub)
} else {
plot(d,main=main,ylab=ylab,xlab=xlab,horiz=par3, nodePar=list(pch = c(1,NA), cex=0.8, lab.cex = 0.8), sub=mysub)
}
dev.off()
if (par2 != 'ALL'){
if (par3 == 'TRUE'){
ylab = 'cluster'
} else {
xlab = 'cluster'
}
par2 <- as.numeric(par2)
memb <- cutree(hc, k = par2)
cent <- NULL
for(k in 1:par2){
cent <- rbind(cent, colMeans(x[memb == k, , drop = FALSE]))
}
hc1 <- hclust(dist(cent),method=par1, members = table(memb))
de <- as.dendrogram(hc1)
bitmap(file='test2.png')
if (par4 == 'TRUE'){
plot(de,main=main,ylab=ylab,xlab=xlab,horiz=par3, nodePar=list(pch = c(1,NA), cex=0.8, lab.cex = 0.8),type='t',center=T, sub=mysub)
} else {
plot(de,main=main,ylab=ylab,xlab=xlab,horiz=par3, nodePar=list(pch = c(1,NA), cex=0.8, lab.cex = 0.8), sub=mysub)
}
dev.off()
str(de)
}
load(file='createtable')
a<-table.start()
a<-table.row.start(a)
a<-table.element(a,'Summary of Dendrogram',2,TRUE)
a<-table.row.end(a)
a<-table.row.start(a)
a<-table.element(a,'Label',header=TRUE)
a<-table.element(a,'Height',header=TRUE)
a<-table.row.end(a)
num <- length(x[,1])-1
for (i in 1:num)
{
a<-table.row.start(a)
a<-table.element(a,hc$labels[i])
a<-table.element(a,hc$height[i])
a<-table.row.end(a)
}
a<-table.end(a)
table.save(a,file='mytable1.tab')
if (par2 != 'ALL'){
a<-table.start()
a<-table.row.start(a)
a<-table.element(a,'Summary of Cut Dendrogram',2,TRUE)
a<-table.row.end(a)
a<-table.row.start(a)
a<-table.element(a,'Label',header=TRUE)
a<-table.element(a,'Height',header=TRUE)
a<-table.row.end(a)
num <- par2-1
for (i in 1:num)
{
a<-table.row.start(a)
a<-table.element(a,i)
a<-table.element(a,hc1$height[i])
a<-table.row.end(a)
}
a<-table.end(a)
table.save(a,file='mytable2.tab')
}