Free Statistics

of Irreproducible Research!

Author's title

Author*The author of this computation has been verified*
R Software Modulerwasp_cloud.wasp
Title produced by softwareTrivariate Scatterplots
Date of computationWed, 12 Nov 2008 13:48:05 -0700
Cite this page as followsStatistical Computations at FreeStatistics.org, Office for Research Development and Education, URL https://freestatistics.org/blog/index.php?v=date/2008/Nov/12/t1226522985d8aj6oo1ntsb3eq.htm/, Retrieved Tue, 28 May 2024 12:25:54 +0000
Statistical Computations at FreeStatistics.org, Office for Research Development and Education, URL https://freestatistics.org/blog/index.php?pk=24444, Retrieved Tue, 28 May 2024 12:25:54 +0000
QR Codes:

Original text written by user:
IsPrivate?No (this computation is public)
User-defined keywordsTrivariate Scatterplot
Estimated Impact181
Family? (F = Feedback message, R = changed R code, M = changed R Module, P = changed Parameters, D = changed Data)
F       [Trivariate Scatterplots] [Trivariate Scatte...] [2008-11-12 20:48:05] [3bdbbe597ac6c61989658933956ee6ac] [Current]
-   PD    [Trivariate Scatterplots] [Trivariate scatte...] [2008-12-04 12:36:27] [c96f3dce3a823a83b6ede18389e1cfd4]
Feedback Forum
2008-11-14 15:06:28 [c798c834ef86cb6aaf2fcb10ea683230] [reply
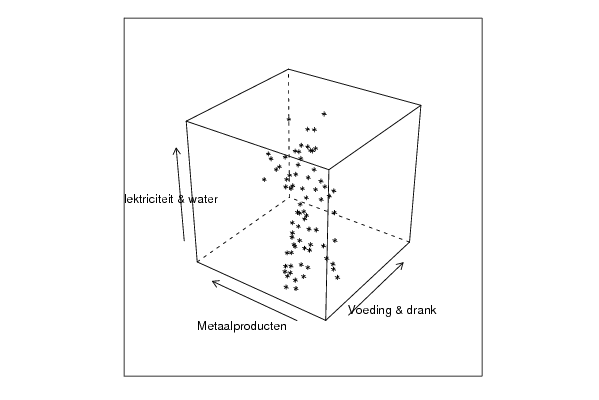
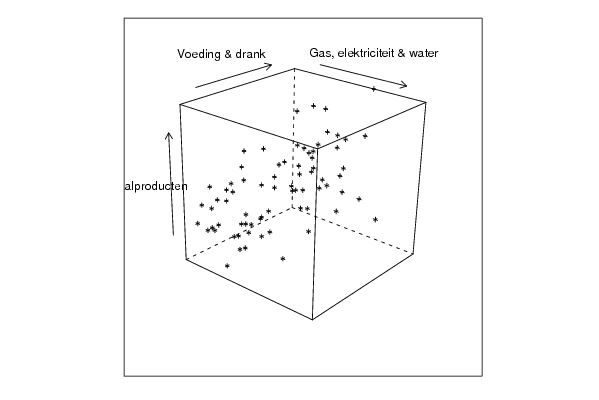
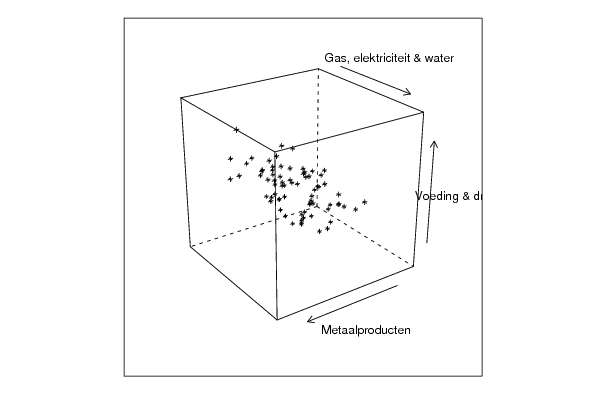
De kubussen geven het verband van de 3 variabelen op hetzelfde tijdstip weer. Door deze weer te geven in een 2 dimensionaal vlak, kan er info verloren gaan en hierdoor kan je een vertekend beeld krijgen.
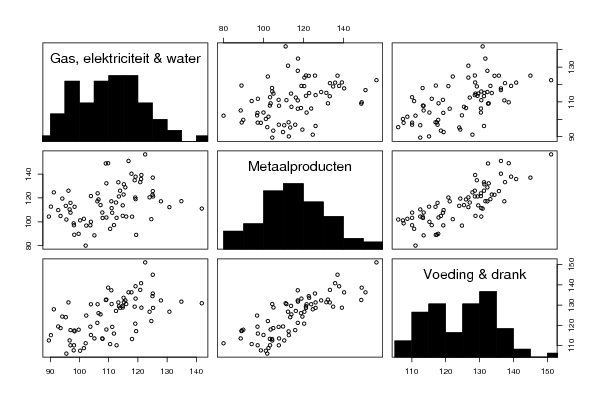
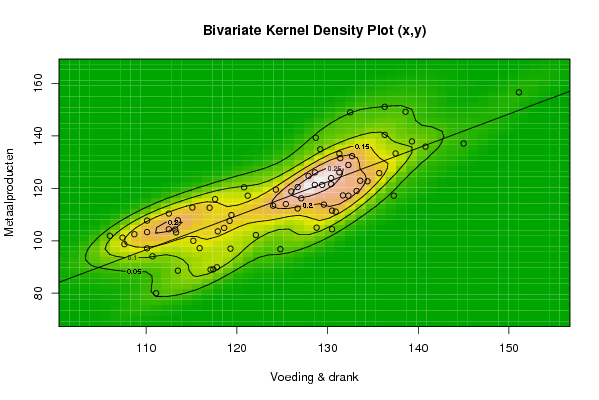
Tussen de metaalproducten en voeding en drank is de correlatie het grootst, dit is af te leiden van de scatterplots: als de punten op 1 lijn liggen is er sprake van hoge correlatie.
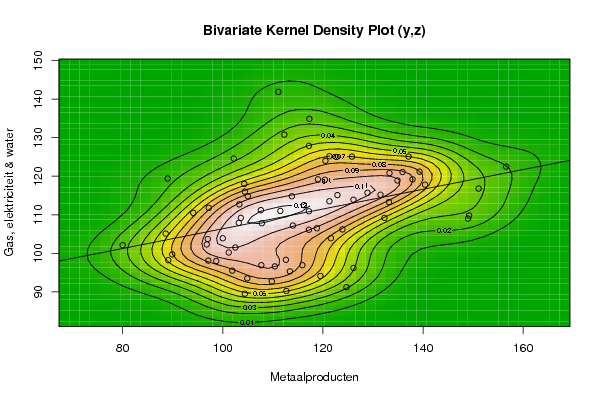
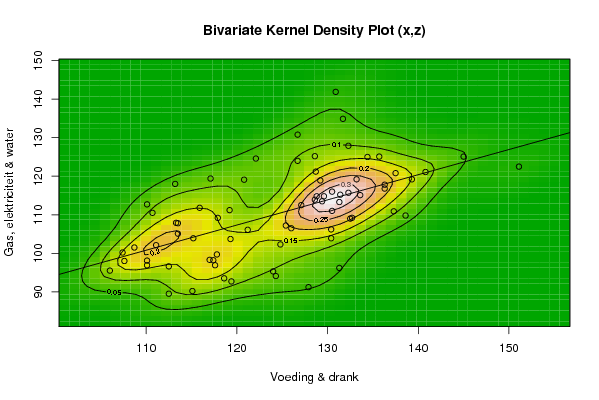
Ook uit de density plots kunnen we dezelfde conclusie stellen.De clusters liggen in lijn met de rechte, wat wijst op eeen positief verband. Bij de verbanden tussen de andere variabelen zijn de gegevens veel meer verspreid.
2008-11-23 16:27:08 [Peter Van Doninck] [reply
De student heeft de correcte bivariate kernel density plots getekend. Deze geven het verband weer tussen de 2 variabelen. In alle 3 de gevallen kunnen we een positief verband waarnemen. Dit wordt voorgesteld door de zogenaamde regressierechte. We mogen aannemen dat er een verband bestaat, aangezien we ellipsen verkrijgen en geen cirkels! De vorm verandert wel per observatie. De student heeft dit echter niet allemaal vermeld. Wel heeft hij geschreven dat het verband tussen de metaalproducten en 'voeding en drank' het grootste is.
2008-11-24 14:27:37 [Vincent Dolhain] [reply
De grafieken zijn juist gemaakt, en er is een goede conclusie gegeven. Alleen konden er een paar zaken beter verduidelijkt worden. De Trivariate Scatterplot geeft inderdaad het verband weer tussen 3 variabelen. Maar in de manier de student hem gebruikt vergelijkt hij maar 2 variabelen, hierdoor ontstaat er een vertekening.
Bij de partiële correlatie kon er specifieker worden gemeld dat bij de correlatie van xy,z (die de grootste was) dat er een duidelijk verband is, waar de invloed van z is uitgehaald.

Post a new message
Dataseries X:
110,1
117
129,6
113,5
113,3
110,1
107,4
110,1
112,5
106
117,6
117,8
113,5
121,2
130,4
115,2
117,9
110,7
107,6
124,3
115,1
112,5
127,9
117,4
119,3
130,4
126
125,4
130,5
115,9
108,7
124
119,4
118,6
131,3
111,1
124,8
132,3
126,7
131,7
130,9
122,1
113,2
133,6
119,2
129,4
131,4
117,1
130,5
132,3
140,8
137,5
128,6
126,7
120,8
139,3
128,6
131,3
136,3
128,8
133,2
136,3
151,1
145
134,4
135,7
128,7
129,2
138,6
132,7
132,5
137,3
127,1
Dataseries Y:
97,1
112,6
113,8
107,8
103,2
103,3
101,2
107,7
110,4
101,9
115,9
89,9
88,6
117,2
123,9
100
103,6
94,1
98,7
119,5
112,7
104,4
124,7
89,1
97
121,6
118,8
114
111,5
97,2
102,5
113,4
109,8
104,9
126,1
80
96,8
117,2
112,3
117,3
111,1
102,2
104,3
122,9
107,6
121,3
131,5
89
104,4
128,9
135,9
133,3
121,3
120,5
120,4
137,9
126,1
133,2
151,1
105
119
140,4
156,6
137,1
122,7
125,8
139,3
134,9
149,2
132,3
149
117,2
116,2
Dataseries Z:
98,1
98,3
114,8
107,8
107,9
112,7
100,2
96,9
96,6
95,5
96,9
99,7
105,1
106,1
106,2
103,9
109,2
110,5
98
94,1
90,2
89,5
91,2
98,2
103,7
103,9
106,5
107,2
111
111,8
101,5
95,3
92,7
93,5
96,2
102,1
102,3
127,9
130,8
134,9
141,9
124,6
118
115,1
111,2
113,5
115,2
119,4
116
115,7
121,1
120,8
125,2
124
119,1
119,2
113,9
113,3
116,8
114,8
119,2
117,8
122,5
125,1
125
125,1
121,2
118,9
109,8
109,2
109
110,9
112,5


Summary of computational transaction
Raw Inputview raw input (R code)
Raw Outputview raw output of R engine
Computing time7 seconds
R Server'Herman Ole Andreas Wold' @ 193.190.124.10:1001

\begin{tabular}{lllllllll}
\hline
Summary of computational transaction \tabularnewline
Raw Input & view raw input (R code)  \tabularnewline
Raw Output & view raw output of R engine  \tabularnewline
Computing time & 7 seconds \tabularnewline
R Server & 'Herman Ole Andreas Wold' @ 193.190.124.10:1001 \tabularnewline
\hline
\end{tabular}
%Source: https://freestatistics.org/blog/index.php?pk=24444&T=0

[TABLE]
[ROW][C]Summary of computational transaction[/C][/ROW]
[ROW][C]Raw Input[/C][C]view raw input (R code) [/C][/ROW]
[ROW][C]Raw Output[/C][C]view raw output of R engine [/C][/ROW]
[ROW][C]Computing time[/C][C]7 seconds[/C][/ROW]
[ROW][C]R Server[/C][C]'Herman Ole Andreas Wold' @ 193.190.124.10:1001[/C][/ROW]
[/TABLE]
Source: https://freestatistics.org/blog/index.php?pk=24444&T=0

Globally Unique Identifier (entire table): ba.freestatistics.org/blog/index.php?pk=24444&T=0

As an alternative you can also use a QR Code:  

The GUIDs for individual cells are displayed in the table below:

Summary of computational transaction
Raw Inputview raw input (R code)
Raw Outputview raw output of R engine
Computing time7 seconds
R Server'Herman Ole Andreas Wold' @ 193.190.124.10:1001


Parameters (Session):
par1 = 50 ; par2 = 50 ; par3 = Y ; par4 = Y ; par5 = Voeding & drank ; par6 = Metaalproducten ; par7 = Gas, elektriciteit & water ;
Parameters (R input):
par1 = 50 ; par2 = 50 ; par3 = Y ; par4 = Y ; par5 = Voeding & drank ; par6 = Metaalproducten ; par7 = Gas, elektriciteit & water ;
R code (references can be found in the software module):
x <- array(x,dim=c(length(x),1))
colnames(x) <- par5
y <- array(y,dim=c(length(y),1))
colnames(y) <- par6
z <- array(z,dim=c(length(z),1))
colnames(z) <- par7
d <- data.frame(cbind(z,y,x))
colnames(d) <- list(par7,par6,par5)
par1 <- as.numeric(par1)
par2 <- as.numeric(par2)
if (par1>500) par1 <- 500
if (par2>500) par2 <- 500
if (par1<10) par1 <- 10
if (par2<10) par2 <- 10
library(GenKern)
library(lattice)
panel.hist <- function(x, ...)
{
usr <- par('usr'); on.exit(par(usr))
par(usr = c(usr[1:2], 0, 1.5) )
h <- hist(x, plot = FALSE)
breaks <- h$breaks; nB <- length(breaks)
y <- h$counts; y <- y/max(y)
rect(breaks[-nB], 0, breaks[-1], y, col='black', ...)
}
bitmap(file='cloud1.png')
cloud(z~x*y, screen = list(x=-45, y=45, z=35),xlab=par5,ylab=par6,zlab=par7)
dev.off()
bitmap(file='cloud2.png')
cloud(z~x*y, screen = list(x=35, y=45, z=25),xlab=par5,ylab=par6,zlab=par7)
dev.off()
bitmap(file='cloud3.png')
cloud(z~x*y, screen = list(x=35, y=-25, z=90),xlab=par5,ylab=par6,zlab=par7)
dev.off()
bitmap(file='pairs.png')
pairs(d,diag.panel=panel.hist)
dev.off()
x <- as.vector(x)
y <- as.vector(y)
z <- as.vector(z)
bitmap(file='bidensity1.png')
op <- KernSur(x,y, xgridsize=par1, ygridsize=par2, correlation=cor(x,y), xbandwidth=dpik(x), ybandwidth=dpik(y))
image(op$xords, op$yords, op$zden, col=terrain.colors(100), axes=TRUE,main='Bivariate Kernel Density Plot (x,y)',xlab=par5,ylab=par6)
if (par3=='Y') contour(op$xords, op$yords, op$zden, add=TRUE)
if (par4=='Y') points(x,y)
(r<-lm(y ~ x))
abline(r)
box()
dev.off()
bitmap(file='bidensity2.png')
op <- KernSur(y,z, xgridsize=par1, ygridsize=par2, correlation=cor(y,z), xbandwidth=dpik(y), ybandwidth=dpik(z))
op
image(op$xords, op$yords, op$zden, col=terrain.colors(100), axes=TRUE,main='Bivariate Kernel Density Plot (y,z)',xlab=par6,ylab=par7)
if (par3=='Y') contour(op$xords, op$yords, op$zden, add=TRUE)
if (par4=='Y') points(y,z)
(r<-lm(z ~ y))
abline(r)
box()
dev.off()
bitmap(file='bidensity3.png')
op <- KernSur(x,z, xgridsize=par1, ygridsize=par2, correlation=cor(x,z), xbandwidth=dpik(x), ybandwidth=dpik(z))
op
image(op$xords, op$yords, op$zden, col=terrain.colors(100), axes=TRUE,main='Bivariate Kernel Density Plot (x,z)',xlab=par5,ylab=par7)
if (par3=='Y') contour(op$xords, op$yords, op$zden, add=TRUE)
if (par4=='Y') points(x,z)
(r<-lm(z ~ x))
abline(r)
box()
dev.off()