Free Statistics

of Irreproducible Research!

Author's title

Author*The author of this computation has been verified*
R Software Modulerwasp_boxcoxnorm.wasp
Title produced by softwareBox-Cox Normality Plot
Date of computationWed, 12 Nov 2008 13:42:53 -0700
Cite this page as followsStatistical Computations at FreeStatistics.org, Office for Research Development and Education, URL https://freestatistics.org/blog/index.php?v=date/2008/Nov/12/t1226522625zmgm6m4wipmaiti.htm/, Retrieved Sun, 19 May 2024 11:36:01 +0000
Statistical Computations at FreeStatistics.org, Office for Research Development and Education, URL https://freestatistics.org/blog/index.php?pk=24443, Retrieved Sun, 19 May 2024 11:36:01 +0000
QR Codes:

Original text written by user:
IsPrivate?No (this computation is public)
User-defined keywords
Estimated Impact144
Family? (F = Feedback message, R = changed R code, M = changed R Module, P = changed Parameters, D = changed Data)
F       [Box-Cox Normality Plot] [various EDA topic...] [2008-11-12 20:42:53] [821c4b3d195be8e737cf8c9dc649d3cf] [Current]
Feedback Forum
2008-11-19 16:55:57 [Carole Thielens] [reply
De student maakte correcte berekeningen, maar was in zijn uitleg wel veel te beperkt. Extra uitleg is hier dus vereist...

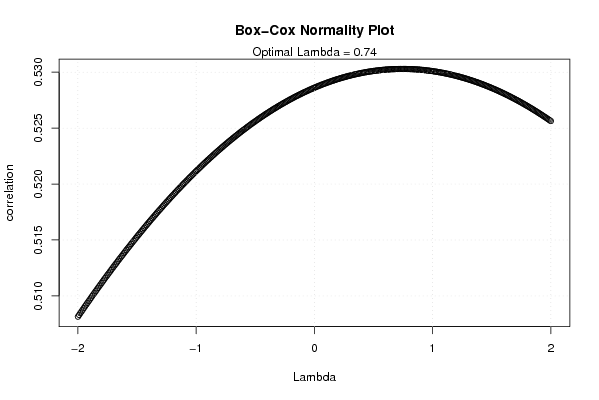
Een Box-cox transformatie kan leiden tot een meer uitgesproken normaalverdeling. Zo kunnen statistische technieken toegepast worden op de gegevens die gebaseerd zijn op de veronderstelling dat er sprake is van een normaalverdeling. Op de verticale as van de Box-cox normality plot wordt de correlatiecoëfficiënt na transformatie weergegeven, terwijl lambda op de x-as staat.

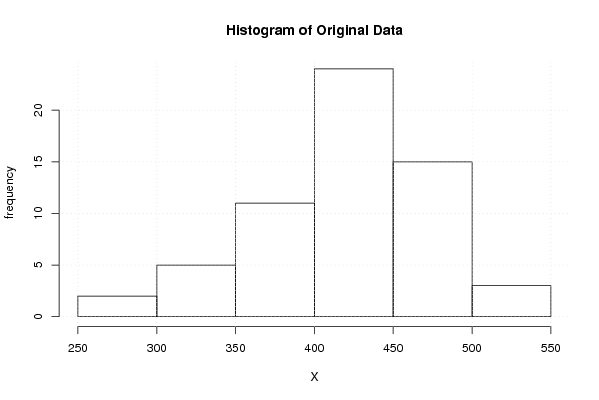
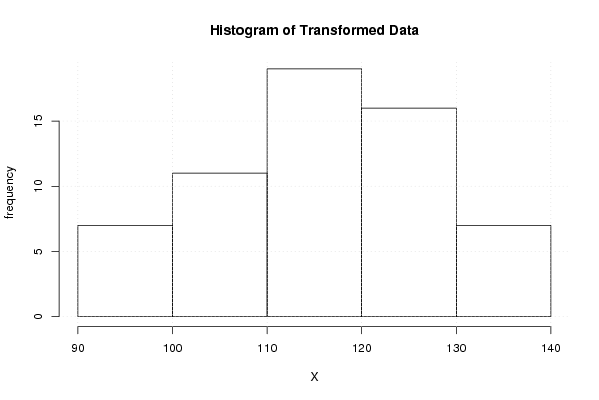
Uit deze transformatie wordt zowel uit het histogram duidelijk dat de oorspronkelijk linksscheve verdeling meer evolueerde naar een rechtsscheve verdeling. Er onstaat hierbij wel een iets sterkere normaalverdeling, maar het verschil is niet zeer markant.

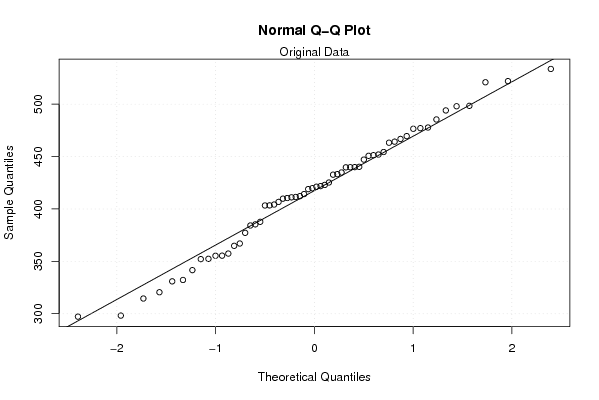
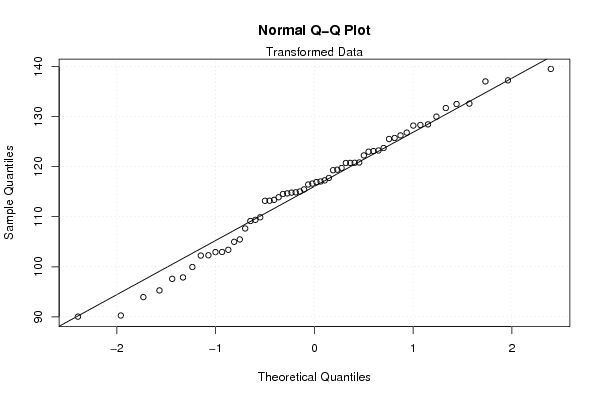
Eveneens vergat de student QQ plots bij zijn analyse toe te voegen. Deze vormen immers ook een mooi beeld van het effect van de transformatie.
2008-11-23 11:31:06 [Gert-Jan Geudens] [reply
Door de box-cox normality plot is het volgelijk om via een transformatie met lambda, een betere normaalverdeling te bekomen. De optimale lambda voor deze transformatie is gelijk aan 0.74. De transformatie heeft in dit geval niet veel zin aangezien de gegevens nauwelijks beter normaal verdeeld zijn. Ook uit de Q-Q plots (die de student niet heeft weergegeven) kunnen we slechts weinig verandering/verbetering afleiden.
2008-11-25 00:22:44 [Jessica Alves Pires] [reply
De student tracht een link te leggen tussen Q4 en Q3 zoals gevraagd wordt, maar het antwoord is vrij beperkt.
De Normal QQ-plot is naar mijn mening duidelijker en kan je daaruit makkelijker conclusies trekken. Deze staan wel hieronder op deze link maar niet in het Word document. De punten liggen ongeveer op de diagonaal waardoor men kan besluiten dat de gegevens min of meer normaal verdeeld zijn. De transformatie zorgt inderdaad niet voor veel verschil.

Post a new message
Dataseries X:
377,2
332,2
364,8
352,4
341,6
298,2
355,3
330,9
314,5
418,9
433,2
367
422,9
352,1
419,8
432,7
414,2
387,7
297,2
357,4
384,2
425,2
385,3
355,4
409,8
421,2
421,8
464,2
494
404,2
411,4
403,4
403,3
520,9
439,8
434,8
476,5
454,3
522
498,4
439,9
450,7
447,1
451,3
466,8
498
533,6
451,9
477,1
410,4
469,5
485,4
406,7
439,7
412,2
440,2
411,1
477,7
463,2
320,5


Summary of computational transaction
Raw Inputview raw input (R code)
Raw Outputview raw output of R engine
Computing time3 seconds
R Server'Gwilym Jenkins' @ 72.249.127.135

\begin{tabular}{lllllllll}
\hline
Summary of computational transaction \tabularnewline
Raw Input & view raw input (R code)  \tabularnewline
Raw Output & view raw output of R engine  \tabularnewline
Computing time & 3 seconds \tabularnewline
R Server & 'Gwilym Jenkins' @ 72.249.127.135 \tabularnewline
\hline
\end{tabular}
%Source: https://freestatistics.org/blog/index.php?pk=24443&T=0

[TABLE]
[ROW][C]Summary of computational transaction[/C][/ROW]
[ROW][C]Raw Input[/C][C]view raw input (R code) [/C][/ROW]
[ROW][C]Raw Output[/C][C]view raw output of R engine [/C][/ROW]
[ROW][C]Computing time[/C][C]3 seconds[/C][/ROW]
[ROW][C]R Server[/C][C]'Gwilym Jenkins' @ 72.249.127.135[/C][/ROW]
[/TABLE]
Source: https://freestatistics.org/blog/index.php?pk=24443&T=0

Globally Unique Identifier (entire table): ba.freestatistics.org/blog/index.php?pk=24443&T=0

As an alternative you can also use a QR Code:  

The GUIDs for individual cells are displayed in the table below:

Summary of computational transaction
Raw Inputview raw input (R code)
Raw Outputview raw output of R engine
Computing time3 seconds
R Server'Gwilym Jenkins' @ 72.249.127.135


Box-Cox Normality Plot
# observations x60
maximum correlation0.5302940215618
optimal lambda0.74

\begin{tabular}{lllllllll}
\hline
Box-Cox Normality Plot \tabularnewline
# observations x & 60 \tabularnewline
maximum correlation & 0.5302940215618 \tabularnewline
optimal lambda & 0.74 \tabularnewline
\hline
\end{tabular}
%Source: https://freestatistics.org/blog/index.php?pk=24443&T=1

[TABLE]
[ROW][C]Box-Cox Normality Plot[/C][/ROW]
[ROW][C]# observations x[/C][C]60[/C][/ROW]
[ROW][C]maximum correlation[/C][C]0.5302940215618[/C][/ROW]
[ROW][C]optimal lambda[/C][C]0.74[/C][/ROW]
[/TABLE]
Source: https://freestatistics.org/blog/index.php?pk=24443&T=1

Globally Unique Identifier (entire table): ba.freestatistics.org/blog/index.php?pk=24443&T=1

As an alternative you can also use a QR Code:  

The GUIDs for individual cells are displayed in the table below:

Box-Cox Normality Plot
# observations x60
maximum correlation0.5302940215618
optimal lambda0.74


Parameters (Session):
Parameters (R input):
R code (references can be found in the software module):
n <- length(x)
c <- array(NA,dim=c(401))
l <- array(NA,dim=c(401))
mx <- 0
mxli <- -999
for (i in 1:401)
{
l[i] <- (i-201)/100
if (l[i] != 0)
{
x1 <- (x^l[i] - 1) / l[i]
} else {
x1 <- log(x)
}
c[i] <- cor(qnorm(ppoints(x), mean=0, sd=1),x1)
if (mx < c[i])
{
mx <- c[i]
mxli <- l[i]
}
}
c
mx
mxli
if (mxli != 0)
{
x1 <- (x^mxli - 1) / mxli
} else {
x1 <- log(x)
}
bitmap(file='test1.png')
plot(l,c,main='Box-Cox Normality Plot',xlab='Lambda',ylab='correlation')
mtext(paste('Optimal Lambda =',mxli))
grid()
dev.off()
bitmap(file='test2.png')
hist(x,main='Histogram of Original Data',xlab='X',ylab='frequency')
grid()
dev.off()
bitmap(file='test3.png')
hist(x1,main='Histogram of Transformed Data',xlab='X',ylab='frequency')
grid()
dev.off()
bitmap(file='test4.png')
qqnorm(x)
qqline(x)
grid()
mtext('Original Data')
dev.off()
bitmap(file='test5.png')
qqnorm(x1)
qqline(x1)
grid()
mtext('Transformed Data')
dev.off()
load(file='createtable')
a<-table.start()
a<-table.row.start(a)
a<-table.element(a,'Box-Cox Normality Plot',2,TRUE)
a<-table.row.end(a)
a<-table.row.start(a)
a<-table.element(a,'# observations x',header=TRUE)
a<-table.element(a,n)
a<-table.row.end(a)
a<-table.row.start(a)
a<-table.element(a,'maximum correlation',header=TRUE)
a<-table.element(a,mx)
a<-table.row.end(a)
a<-table.row.start(a)
a<-table.element(a,'optimal lambda',header=TRUE)
a<-table.element(a,mxli)
a<-table.row.end(a)
a<-table.end(a)
table.save(a,file='mytable.tab')